Lesson 1: FOSS and its use in web mapping
The links below provide an outline of the material for this lesson. Be sure to carefully read through the entire lesson before returning to Canvas to submit your assignments.
Note: You can print the entire lesson by clicking on the "Print" link above.
Overview
In this lesson, you'll learn some of the history of web mapping and why web services are so important. You'll also learn about free and open source software (FOSS) and the benefits and drawbacks of using it. Finally, you'll get the chance to install and use QGIS, a FOSS solution for desktop GIS work. QGIS will help you preview and manipulate your data as you prepare to create web maps later in the course.
Objectives
- Describe the roles of clients, servers, and requests and how they contribute to web service communication patterns.
- Identify benefits and challenges to FOSS and how they should be weighed when choosing a software platform.
- List common FOSS solutions for general computing and GIS and discuss how you have seen these used in the “real world.”
- Recognize when and how FOSS might be used in a “hybrid” model with elements of proprietary software.
- Add and symbolize GIS data in QGIS.
Checklist
- Read the Lesson 1 materials on this page.
- Complete the walkthrough and post your final screenshot as a post on the "Lesson 1 walkthrough result forum" on Canvas.
- Complete the Lesson 1 assignment, which involves readings and a discussion.
The history and importance of web mapping
For decades, most digital geographic information was confined for use on desktop-based personal computers (PCs) or in-house mainframes and could not be easily shared with other organizations. GIS analysts would access data from their own workplace computers that were often connected to a central file server somewhere in the office. Specialized software was required to view or manipulate the data, effectively narrowing the audience that could benefit from the data.
With mass uptake of the Internet in the mid-1990s, people began thinking about how maps and other geographic information could be shared across computers, both within the organization and with the general public. The first step was to post static images of maps on HTML pages; however, people soon realized the potential for interactive maps. The first of these, served out by newborn versions of software such as Map Server and Esri ArcIMS, were horrendously pixelated, slow, and clunky by today's standards. Limited by these tools, cartographers had not yet arrived en masse on the web mapping scene, and most of the maps looked hideous. However, these early interactive web maps were revolutionary at the time. The idea that you could use your humble web browser to request a map anywhere you wanted and see the resulting image was liberating and exciting. See Brandon Plewe's 1997 book GIS Online (findable in many university geography libraries) to get a feel for the web mapping landscape at this time period.
These early, dynamically drawn web maps ran into challenges with speed and scalability (the ability to handle many simultaneous users). The server could only accommodate a limited number of map requests at a time before slowing down (at best) and crashing (at worst). Web maps matured significantly in these two metrics when websites began to serve out tiled map images from pregenerated caches. Why ask the server to draw every single map dynamically when you could just put forward an initial investment to predraw all possible map extents at a reasonable set of scales? Once you had the map images drawn and cached, you could serve out the images as a tiled mosaic. Each tiled map request was satisfied exponentially faster than it would take to serve the map dynamically, allowing for a server to accommodate hundreds of simultaneous users.
Following the lead of Google Maps, many sites began serving out “pre-cooked” tiled map images using a creative technique known as Asynchronous JavaScript and XML (AJAX) that eliminated the ubiquitous and annoying blink that occurred after any navigation action in earlier web maps. Now you could pan the map forever without your server gasping for breath as it tried to catch up.
Cartographers, who had largely been resigned to trading aesthetics for speed in web maps, also realized the potential of the tiling techniques. No longer would the number of layers in a map slow down the server: once you had pregenerated the tiles, you could serve a beautiful map just as fast as an ugly one. Web maps became an opportunity to exercise cartographic techniques and make the most attractive map possible. Thus were born the beautiful, fast, and detailed “web 2.0” basemaps that are common today on Google, Microsoft Bing, OpenStreetMap, and other popular websites.
As web browsers increased in their ability to draw graphics using technologies such as SVG and later WebGL, the possibilities for interactivity arose. On-the-fly feature highlighting and HTML-enriched popup windows became common elements. For several years, developers experimented with plug-ins such as Adobe Flash and Microsoft Silverlight for smooth animation of map navigation and associated widgets. More recently, developers are abandoning these platforms in favor of new HTML5 standards recognized by the latest web browsers without the need for plug-ins.
Although maps had arrived on the browser by the mid-2000s, they were still largely accessed through desktop PCs. The widespread adoption of smartphones and tablets in subsequent years only increased the demand for web maps. Mobile devices could not natively hold large collections of GIS data, nor could they install advanced GIS software; they relied on web or cellular connections to get maps on demand. These connections were either initiated by browsers on the device, such as Safari, or native applications installed on the device and built for simple, focused purposes. In both cases, GIS data and maps needed to be pulled from the organization's traditional data silos and made available on the web.
The importance of web services
All the above web mapping scenarios are possible because of web services. If you search the Internet, you'll find many definitions of web services and can easily get yourself confused. For the purposes of this course, just think of a web service as a focused task that a specialized computer (the server) knows how to do and allows other computers to invoke. You work with the web service like this:
- You invoke the web service by making a request from an application (the client). To make this request, you usually use HTTP, a standard protocol that web browsers use for communicating between clients and servers. The request contains structured pieces of information called parameters. These give specific instructions about how the task should be executed.
- The server reads the request and runs its web service code, considering all the parameters while doing so. This produces a response, which is usually a string of information or an image.
- The server sends you the response, and your application uses it.
Examine how the following simple diagram describes this process, returning a map of current precipitation:
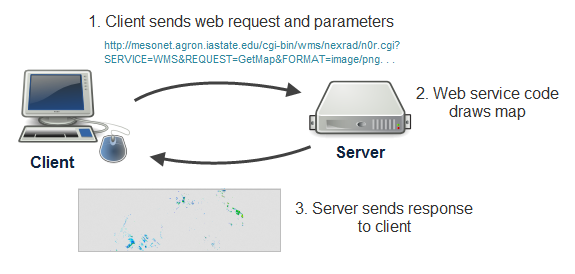
Now, for an example. Let's suppose that you've identified the URL of a web service out there somewhere that draws maps. You make a request by constructing a URL (http://...) containing the address of the web service and various parameters for the map, such as the format of the image you want to receive (JPG, PNG, etc.), bounding box (coordinates defining the geographic area you want to see mapped), and map scale. You paste this into your browser's address bar and the server sends you a response containing the map image you requested.
Here's an example of just such a request, using a radar map of the United States. First, see if you can identify some of the parameters in the URL. Then take a guess at what the response will look like when you get it back. Then click the link to invoke the web service and get the response:
As you examined the URL of this request, you might have noticed parameters indicating the width and height of the image, the image format, the image background transparency, and the bounding coordinates of the map to be drawn. These parameters provide specific details about how the web service should run its map drawing code. You see these parameters reflected in the response image sent back to your browser when you clicked the link. In a future lesson, you'll learn about more of the parameters in the request above.
Not all web requests invoke web service code. Some web requests just return you a file. This is how tiled maps work, and this is why they are so fast. You'll learn more about tiled maps in a later lesson, but examine the following request for a specific zoom level, row, and column of a tile:
http://a.tile.openstreetmap.org/15/11068/19742.png [3]
The request drills down into the server's folder structure and returns you the requested PNG image as a response. No special code ran on the server other than the basic file retrieval, therefore you could argue that a web service was not invoked. However, this type of simple web request is also an important part of many web maps.
At this point, you might be thinking, “I've used web maps for years and I have never had to cobble together long clunky URLs like this. Have I been using web services and other web requests?” Absolutely, yes. As you navigate Google Maps, your company's online map site, and so on, your browser is sending hundreds of web requests similar to this one. You've just never needed to know the details until now. When you begin setting up your own GIS server or designing your own client web application, it becomes important to understand the theory and architecture behind web traffic.
Not all web services use the same format of URL and parameters. In this course, you'll learn about some of the most common formats for online web services, especially ones that have been openly developed and documented to work across software packages.
Viewing web service requests in real time
Here's a simple way you can view web requests made “behind the scenes” by your browser as you navigate a website. These instructions are for the tools provided by Mozilla Firefox. Chrome and other browsers have similar tools that typically go under the name "developer tools" or "web tools" and should not be difficult to locate.
- Open Mozilla Firefox (if it's not already running) and from the main menu choose More Tools -> Web Developer Tools. This will open the developer tools window in the bottom part of your browser. At the top of the window, you can see different tabs "Inspector", "Console", and so on. Select the one called "Network", which is for monitoring network traffic. In addition to the "Network", the "Console" tab will be important for this course because it will show the Javascript and other error messages if something is not right with your Javascript code.
- Make sure that All is highlighted in the menu of filters below the tabs (which will contain items such as All, HTML, CSS, JavaScript, etc.).
- Hit this website for the Portland TriMet interactive system map [4] (note that this site exclusively uses FOSS mapping software).
- Navigate the map of the Portland transportation system.
- Notice the web requests as they are sent. You'll see a lot of requests appearing for map tiles.
- Hover over a request to see its full URL. If the response is an image, hovering over the little thumbnail in front of the URL will show a larger version of the returned image.
- When an entry in the list of requests is selected, the right part of the window will show many additional technical info about the request and response.
This kind of developer tool will be valuable to you later in the course as you develop your own web maps, mainly for troubleshooting scenarios where you expect a map to show up and your browser does not send you the expected response.
References
Plewe, B. (1997). GIS online: Information retrieval, mapping, and the Internet. OnWord Press.
Understanding FOSS and its use in web mapping
The term “free and open source software” (hereafter referred to as FOSS) includes a number of ideas that can invoke complex and even emotional discussions within the technical community. To begin to describe this term, it's important to understand that software development is more enigmatic and artistic than other crafts in the tech industry [5], such as computer chip design. Software cannot be seen, touched, tasted, or described in a physical sense, other than the number of megabytes it occupies on your computer. Software often begins as ideas on a whiteboard, which are then encapsulated into intangible “classes” and "objects" of code by a programmer. These are then assembled into invokable sets of concrete tasks and dressed with a user interface of buttons, menus, and icons that require a whole other skillset of aesthetic design.
As a result of all this work, software is an empowering technology that enables a person to make practical use of computer hardware. In fact, specialized software can often cost much more than the physical machine that it runs on. Software is your window into printing, painting, calculating, storing data, and, in our case, making maps.
Given the value of software, it's no surprise that commercial businesses invest millions in researching, developing, and selling proprietary software. They protect it through patent and copyright laws. They obfuscate (scramble) the code to make it harder to copy or reverse engineer. Commercial software development has become a successful enterprise whose resulting tools have shaped our work and home environments.
At the same time, some software users and developers have advocated that there are benefits from making software source code freely visible and able to be modified or shared without legal or technical restraint. Business benefits, technical benefits, and moral arguments have been invoked in support of this concept of “free and open source software.”
It's possible to get confused when learning about FOSS, because the word “free” carries several meanings in the English language. A common analogy describing the F in FOSS is “free as in free speech, not free beer.” In other words, FOSS is “free” in the sense that it is open and amenable to use and modification. (You may sometimes see the term Free/Libre [6] Open Source Software (FLOSS) used to communicate this idea.) A whole range of license types [7] are used with FOSS that specify the conditions surrounding the modification and reuse of the software, along with the attribution required on any derived products.
While the selling of FOSS is not necessarily restricted, FOSS is usually available free of charge. All of the software we'll use in this course can be downloaded directly from the Internet and requires no fee, although donating a few dollars to your favorite project is a good way to invest in its continued development.
If FOSS is usually available without cost, why is it such a successful concept? And how do people make a living from coding with it? First, it's important to mention that many developers contribute to FOSS solely for personal enjoyment and for the desire to donate their skills to a project offering wide societal benefits. They enjoy working on virtual teams and facing the challenges of rigorous software development that their ordinary “day jobs” might not offer.
At the same time, though, many individuals make a generous living by selling services and training related to FOSS, and some of these efforts may increase the quality and number of FOSS features available. For example, suppose your company invests in a FOSS package that does everything you want at $30,000 cheaper than the proprietary software alternative; however, it's missing “Feature X” that is critical for your workflows, and you don't have a programmer who can implement Feature X. Because the code for the software is all open to examination, modification, and extension, you can contract with Rock Star Programmer to implement Feature X for you for $10,000. If Feature X is widely applicable to the good of the product, and you and the contractor are okay with the idea, Feature X may eventually be rolled into the core source code so everyone can benefit from it.
Other people may not contribute frequently to FOSS projects, but can still make a profit selling support services for FOSS software. When you buy proprietary software, you often are given access to a technical support package that allows you to call and talk to an analyst if needed. Because FOSS does not offer these official support systems, enterprising individuals have stepped in to fill this void.
Finally, several new firms are building subscription-based online services that are created using open source building blocks and may even be released under open source licenses. The services are offered for a subscription cost that is lower than most organizations could achieve if they attempted to build their own comparable infrastructure or quality control procedures. Through these FOSS-based Software-as-a-Service (SaaS) offerings, the value of the free software is passed on to many buyers.
Although there are many FOSS purists out there, the decision to use FOSS does not have to result in a full migration away from proprietary software. Many businesses and governments use what might be termed a "hybrid approach," incorporating a mix of FOSS and proprietary software depending on their budget, staff skills, and technical needs.
Let's consider some of the benefits, challenges, and other considerations that the adoption of FOSS brings into your workflows.
Benefits of FOSS
As you begin the endeavor of learning to use FOSS, it's helpful to understand some of the benefits that you may see:
- Lower cost software – The reason FOSS can be offered free of charge is discussed above. Even if you have to spend a substantial amount on training, support, and consulting, these expenses may not reach the amount that you would have spent for a proprietary software package.
- More flexibility with the software – If you commit to a proprietary software vendor and you really need Feature X or Bug Fix Y, your ability to persuade the vendor to add this feature may depend on the size of your contract, how many other people want the feature, and when the next software release is available (unless you are an important enough customer to warrant a specially-built hotfix or patch). If you are a small customer and the feature you want is obscure (albeit mission critical to you), then you may wait for years and never see it added. With FOSS, you can add the feature or fix a bug at any time, and your only limits are the programmer skills you can find.
- Interoperability of the software – Many FOSS offerings attempt to abide by open specifications for data and web services so that they can interact seamlessly with other products. You will learn about some of these specifications for geospatial data later in this lesson and course.
Many proprietary software vendors indeed support the reading of open specifications, but often they will write data into proprietary data formats that can only be processed by the vendor's software. This becomes a problem when open government initiatives come into play, as demonstrated in March 2013 when the Ohio Supreme Court ruled [9](*) that Scioto County was justified in asking a citizen for a $2000 fee in response to a Public Records Act request for its GIS data. The reason for the fee: the data was inextricably intertwined with proprietary GIS software and would require extra effort to extract.
* If the link does not work for you, the reason most likely is that you are located outside the US; just search for the event on the web and you should be able to find some articles about it. - Security – Militaries, banks, and other government agencies have gravitated toward FOSS because they have a full view of its cybersecurity mechanisms and can patch or modify these according to their own desires. Some agencies will not use a new version of any software until it has passed a rigorous security certification process. FOSS allows for more agile response to issues that are brought to light during this testing.
- Ethics – Some people view the use of open source software as an ethical question. Creating and using software that is part of an intellectual commons is a powerful motivating factor for many open source advocates. The development and use of FOSS contributes to the expansion of collective human knowledge.
Challenges of FOSS
A danger of evaluating FOSS systems is to allow the potential exciting benefits to obscure the real challenges that can accompany a FOSS deployment. Some or all of the challenges below can be mitigated, but proprietary software may offer a smoother road in these areas, if you can bear the cost.
- Usability – Designing a user-friendly software product requires a much different skill set than that required to write back end software code. When the author of this course worked at a proprietary software vendor, he held the title of “Product Engineer.” These were people whom the company hired to work with the developers to design, test, and document the product. They did not write source code; they just concentrated on making a usable product.
Good product engineers are hard to find and hire, even when you are a proprietary software company with attractive salaries to offer. When the number of coders working on the back end logic of a FOSS project outweighs the effort going into user interface design, then usability can suffer. Compounding this problem is the need for frequent iteration and clear communication between software designers and developers. In the halls of a proprietary software company, this may occur more readily than in the online collaborative forums driving FOSS.
Some people who work on FOSS may vigorously debate this point, so as you work with FOSS in this course, be aware of its level of user-friendliness compared to proprietary software, and draw your own conclusions.
- Documentation availability – Just as proprietary software companies pay designers and test engineers, they also are expected to deliver a fully documented product. Thus, they hire technical writers who can produce software manuals, online tutorials, and other training. There is a business incentive for this: if your product isn't well documented, it will get a negative reputation in the community, and people will stop buying it.
When software is delivered free of charge, you rely on the benevolence of project contributors to provide any sort of documentation, much of which may be produced in the forms of wikis, tutorials, and forum posts. This can be maddeningly unstructured to someone accustomed to proprietary software whose documentation is expected to "just be there” in a single unified and searchable help system.
Some FOSS documentation is excellent, and it's important to respect the people who contribute, proofread, and translate it. However, beware that FOSS is often created by very bright individuals who can Just Figure Things Out using minimalist or fragmented sources of information, and they may expect that you can play at this same level as you try to use their product. In both proprietary software and FOSS, documentation quality can sometimes be slighted or given lower priority when the initial coding and testing have been completed and everyone is itching to get the product out the door.
Just as you did with usability, pay attention to documentation quality, and make your own judgment as you work through the course. Would you be able to figure things out without the course walkthroughs guiding you? How does it compare to the proprietary software help that you have used in the past?
- Support availability – As mentioned above, many third-party contractors offer technical support and consulting for FOSS products; however, the advantage of purchasing support from a proprietary software vendor is that the people who developed the software are often accessible by the support team. Thus, the support team can get a closer understanding of the intent, logic, design, and planned trajectory of the software. They may also maintain a large database of both internally and externally documented bugs that can help find you a workaround in a hurry. Although it may be possible for a FOSS support consultant to learn some of these same types of things, the support experience is not as smoothly integrated.
Contested points
Some aspects of FOSS and proprietary software are not as clear when it comes to deciding which type of software owns the advantage.
- Breadth of features – It can be argued (and you will see this in the Ramsey video required later in this lesson) that FOSS offers a more focused, prioritized list of features and may not be able to compete with proprietary software when it comes to sheer number and depth of features. At the same time, the flexibility of FOSS allows for infinite features to be added via plug-ins and direct modifications for the source code, something that cannot always be said for proprietary software where limited lists of new features are released via periodic updates. It should be noted here that if the proprietary software offers good APIs (in other words, programming frameworks), it, too, may be extended to a limited degree by third-party developers.
-
Quality and technical superiority – The “bugginess” of FOSS compared to proprietary software probably depends on the products in question, how mature they are, and who's developing them. FOSS advocate Eric Raymond argued that “given enough eyeballs, all bugs are shallow,” contending that it would be difficult for any major issues with FOSS to go unfixed for long among a broad community of developers. It's less clear who fixes the obscure bugs that you hit and others don't. If you can't convince someone in the FOSS community to fix it, you could at least attempt it yourself or hire a consultant.
Proprietary software vendors obviously have business incentives to fix bugs; however, they also have business incentives to NOT fix certain obscure bugs if the time, effort, and risk to do so would not provide a good return on investment. If you're a small-potatoes customer with an obscure bug holding up your project, you'd better start looking for a workaround. - Innovation – Does innovation occur more readily in a proprietary software company where large amounts of research and development dollars can be invested in full-time employees who collaborate face-to-face, or does it thrive in an environment where all the code is available for perusal and experimentation by anybody? Part of the answer may depend on how much the proprietary software company operates on a “reactive” basis as compared to a forward-looking vision. It also depends on whether the company's goals encourage certain types of development at the expense of others.
Innovation rarely occurs in a vacuum. Some would argue that innovation happens more freely when there are more elements in the intellectual commons that can be drawn upon.
Examples of widely-used FOSS
FOSS has been developed to support all tiers of system architecture. You've probably heard of (or used) some of this software before. For example, the term “LAMP stack” refers to a system that is running:
- Linux operating system
- Apache web server
- MySQL (or MariaDB) relational database
- PHP application scripting language
Other variations of this acronym exist. For example, PostgreSQL is another open source relational database that is commonly used with GIS because of the popular PostGIS extension. This results in a LAPP stack rather than a LAMP stack.
Other general-use FOSS includes the LibreOffice suite (similar to Microsoft Office), the Mozilla Firefox web browser, the Thunderbird e-mail client, the Python scripting language, and more.
FOSS use in government
Some governments have begun mandating or encouraging the use of FOSS for government offices and projects. This is especially popular in Latin America and Europe, with one of the more recent government decrees occurring in the United Kingdom [10]. Often the FOSS is implemented first on servers and back-end infrastructure, then rolled out to desktop workstations in later phases.
These policies favoring FOSS come about for different reasons. Obviously, the savings in software licenses and the flexible security models offered by FOSS are desirable, but sometimes there are political motivations to reject proprietary software companies and their countries of origin (particularly in places where the United States is perceived as imperialist). If you are interested in more reading on this topic, I recommend Aaron Shaw's study of the FOSS movement in the Brazilian government [11] and its tie to leftist politics [here is an alternative link [12] to the paper in case the other link isn't working].
FOSS and web mapping
FOSS has a strong and growing presence in the GIS industry. Some tools and utilities for processing geospatial data have been around for decades. For example, GRASS GIS [13] developed by the US Army Corps of Engineers recently turned 30 years old. To see what it looked like back then, see this old GRASS promotional video [14] narrated by none other than William Shatner. I still use this video in introductory classes to teach the benefits of GIS and the main components of a GIS system.
In this course, we'll use some of these desktop workstation GIS tools for previewing and manipulating our datasets before putting them on the web. For example, later in this lesson, you'll install and explore QGIS [15] (previously known as Quantum GIS), one of the most popular and user-friendly FOSS GIS programs.
There are also various FOSS options for exposing your GIS data on the web, either within your own office network or on the entire Internet. These include Map Server [16], QGIS Server [17], and GeoServer [18], the latter of which you will learn in this course. These software offerings take your GIS datasets and make them available as web services that speak in a variety of formats. They include a web server or are designed to integrate with an existing web server, so that your web services can reach computers outside your own office or network.
FOSS can also be used to generate sets of tiled images or vector data that you can use as layers in your web maps. In this course, you'll learn how to do this using a new tool recently integrated into QGIS.
Underlying both desktop and server GIS are the databases containing your GIS data. If you need something a little more complex than a folder of shapefiles or want to make use of spatial database types, then you can use a FOSS GIS database. These include PostGIS [19] (which is an extension to the PostgreSQL relational database) and SpatiaLite [20] (which uses the SQLite database). A lighter fare option for smaller datasets is to use standalone files of GeoJSON, KML, GeoRSS, or other well-documented text-based data formats.
To pull all your map layers together and display them on a web page, you'll use a programming framework, or API. Some of the most mature web mapping APIs are OpenLayers [21] and Leaflet [22], which you will use later in this course with the JavaScript programming language. Other popular FOSS web mapping APIs include ModestMaps [23], D3 [24], and Polymaps [25].
The role of open specifications and open data
Not to be confused with open software, open specifications are documented and mutually agreed-upon patterns of how software and digital data should behave in order to be interoperable between systems. For example, HTTP (hypertext transfer protocol) is based on a specification defining how web servers and web browsers should communicate in order to exchange information. Without open specifications, you would not be reading this web page.
How are open specifications used in web mapping?
In this course, we'll learn about two types of open specifications:
- Open data formats – Most GIS data formats are open in the sense that the way they are constructed is fully documented, and various GIS programs can read and write them. Also, the inventors of these formats have not asserted the right to any royalties when you use them.
KML and GeoJSON are some examples of GIS data formats that you can create just by writing a text document in a particular way. Most raster formats such as JPEG or PNG are also open. The shapefile is one of the most common formats for exchanging vector GIS data, because Esri has openly documented how to create a shapefile and relinquished any legal restrictions on creating shapefiles. In contrast, an example of a closed data format is the Esri file geodatabase, because Esri has not openly documented how to create a file geodatabase without using Esri tools. - Open specifications for web map services – There have been several efforts to openly document patterns that GIS web services should use when communicating with clients. The Open Geospatial Consortium (OGC) has created several of these specifications, the most popular of which is the Web Map Service (WMS). The USA weather radar service you accessed earlier in this lesson was an example of a WMS. You will learn more about the various OGC specifications later in this course.
In a document called the GeoServices REST Specification, Esri has also openly documented the form of communication used by geospatial web services in its products such as ArcGIS Enterprise and ArcGIS Online. This means that non-Esri developers are free to build applications that read or serve web services according to this pattern. Although the GeoServices REST Specification was not adopted by the OGC (a long story covered in a later lesson), it is an example of a specification that has been voluntarily made open by a proprietary software vendor.
The role of open data
In this course, we'll also be using open data, which is data that has been made available to the public free of charge and bereft of most copyright restrictions. These data may be shared by government entities, researchers, not-for-profit organizations, or ordinary citizens contributing to online projects. For example, Data.gov [26] is a popular website offering datasets collected by the US government. And, later in this course, we'll learn about one significant source of open GIS data called OpenStreetMap [27]. This is an online map consisting of voluntary contributions in the style of Wikipedia.
Open datasets are often rich and exciting to include in web maps, but there are some precautionary measures you should follow in order to be successful with using them. First, be aware that even though the data is free, you are often still required to provide attribution describing where you obtained the data. You may also be restricted from redistributing the data in any way that requires a fee. When you use an open dataset, you are responsible to carefully research and adhere to any attribution requirements. You should also make an effort to verify the data quality by examining any accompanying metadata, researching the sources and collection methods of the data, and scrutinizing the data itself.
The scope of this course
In this course, you will be getting some experience installing and using FOSS and creating web maps with it. While doing this, you will use open specifications for GIS data and web services. You'll also learn how to use open data and contribute to OpenStreetMap.
Each week, you'll complete a walkthrough explaining some FOSS tool. Following the walkthrough, I will often ask you to apply what you've learned to some of your own datasets you've found or collected. This will allow you to build up a comprehensive project as the course progresses. The goal is to produce something you can host on your personal webspace and reference in a professional portfolio.
The functionality of our web maps will be relatively simple, limited to layer display and point-and-click queries. However, the frameworks that we'll use are broadly extensible depending on how much programming you're willing and able to do.
Along the way, you'll pick up some skills with manipulating data (projecting, clipping, and so forth) with FOSS, which will hopefully prove handy throughout your GIS career. Many of these tools can be scripted with Python and other languages that you may have learned already in other GIS coursework.
Walkthrough: Installing and exploring QGIS
The first FOSS product you'll use is a GUI-based program designed for desktop workstations. It's called QGIS (kyoo-jis), although you should know that sometimes in the past it was referred to as Quantum GIS. QGIS is somewhat similar in appearance and function to Esri's ArcMap, which you've likely used in previous courses.
In this tutorial, you'll install QGIS and make a basic vector map with it. You'll use some shapefiles of downtown Ottawa, Ontario, Canada that I originally downloaded from the OpenStreetMap database.
Download the Lesson 1 walkthrough data [28] (It is a folder of shapefiles that you should extract into a folder such as c:\data).
- Visit the QGIS home page at www.qgis.org [29]. Take a few minutes to explore this introductory page and any links that look interesting. This tells you a bit about who makes QGIS and what it can do.
- From the main QGIS page, click the Download Now Button.
The usability of this page has greatly improved in the past few years. Because FOSS can run on a variety of platforms and can be built directly from source code (as opposed to running an installer program), it's not uncommon with FOSS to see mind-boggling installation instructions with all manner of parenthetical warnings, stipulations, dependencies, and links to obscure download pages. This was previously the case with QGIS, but now the experience is much smoother. - You can now choose between the latest release of QGIS or the most recent long term release (LTR) version. The advantage of using the LTR version, (version 3.28 at the point of this writing) is that the examples in this course have been tested with this version and things on your screen will look very close to what is shown in the images you will see here. If you instead want to see all the features that QGIS has to offer right now and don't mind that things may look slightly different, feel free to go ahead and install the latest release. You can also install both version and switch between them.
To start the download, click on the large green button saying "Download QGIS ..." to download the most current release, or click the small link below it "Looking for the most stable version? ..." for the LTR version. Once you've downloaded it, run through the installation wizard and accept the default options:
QGIS can also run on Mac or Linux. You will see installation instructions for these platforms, and you are welcome to use them; however, only Windows instructions are given in these lesson materials. (I know this is paradoxical for a FOSS course, but teaching you to use Linux is outside the scope of these lessons.) If you get hung up, you may be expected to troubleshoot on your own or default to a Windows machine in order to complete the exercises. If all you know is Windows, I suggest you stick with Windows for this course.
The QGIS installation will place some other shortcuts and programs on your machine, such as GRASS GIS and OSGeo4W. This is fine. In fact, we will use some of these in later lessons. - Start QGIS. You can do this through the Windows Start Menu > All Programs > QGIS (Version name/number) > QGIS Desktop (Version number).
You will notice many toolbars available. In QGIS, the button you click to add data depends on the type of data source. For example, you click different buttons to add vector files, raster files, CSV files, web service layers, and layers from databases. - Drag the toolbars and windows around and clean up your display so that the layout looks something like the screenshot below (Figure 1.3). Don't worry about the order of the toolbars; just get them off the left-hand side if they show up there. You may have to explicitly add the "Manage Layers" toolbar to perfom the next step, as described below. Adding toolbars works the same as it does with ArcMap: just right-click any empty gray area around the toolbars and select the desired toolbar from the menu that appears. Alternatively, go View -> Toolbars in the main menu bar to toggle individual toolbars on and off.
- Click the button for adding vector data:

Once you've clicked the button to add vector data, click the ... button and browse to the roads.shp file from the lesson data folder. Even though a shapefile consists of multiple files, you just need to browse to the .shp when adding a shapefile in QGIS. Now click Add and then Close to close the window again.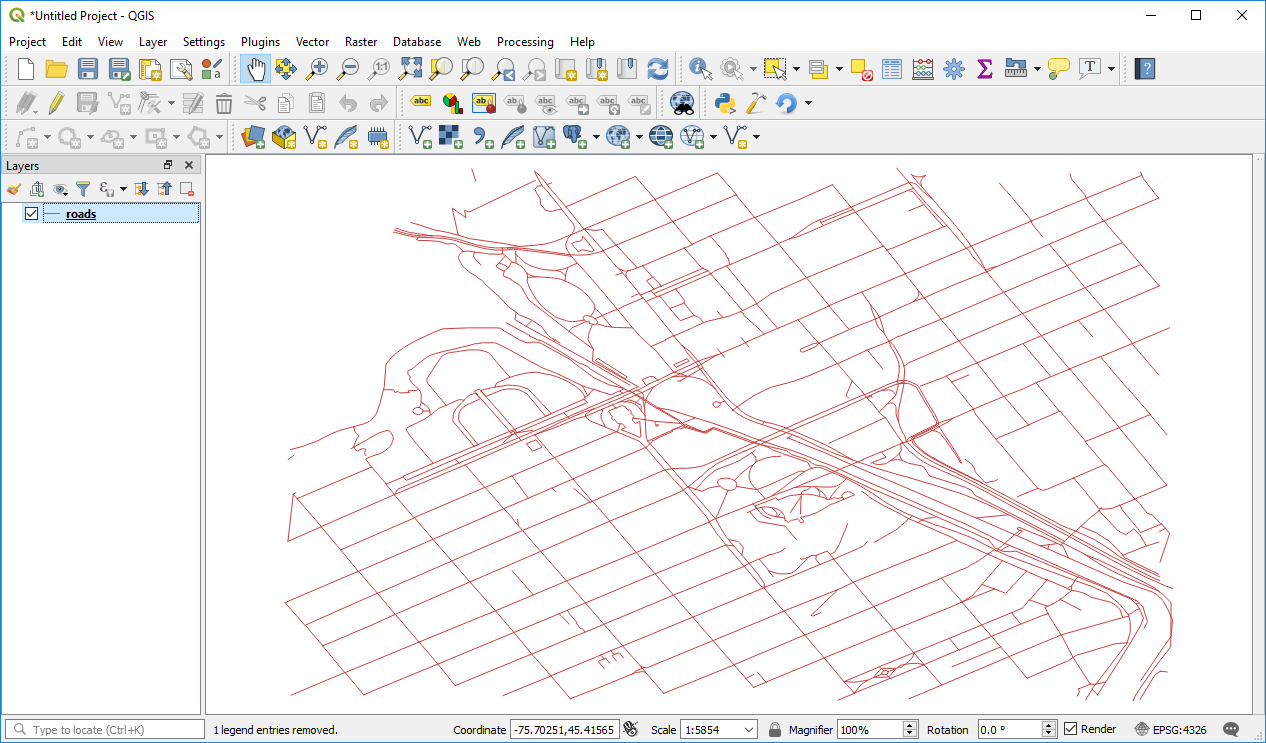 Figure 1.3
 - In the layer list, double-click the roads layer. You'll see a Symbology menu and a bunch of styling options where you can set the line color, the line width, a scale range for visibility, and labeling. Set the roads as a thin gray line.
Notice that in QGIS, you typically get a lot more symbol options if you highlight the deepest level of the symbol hierarchy, in this case, Simple line.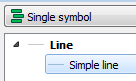
Note: During this walkthrough, I will provide general guidance about which settings to apply, and I will lead you to the correct neighborhood of dialog boxes to accomplish it; however, I will not provide point-and-click instructions for all actions. Although you may curse my name for this, I am doing it deliberately so that A) you can think about what you are doing and B) you can develop the habit of exploring new and unfamiliar software in a fearless manner. This is an essential skill if you are going to use FOSS.
That being said, it is not my intent to leave you frustrated and helpless. If something is not clear, please use the discussion forums to help each other out. I will regularly monitor the forums to make sure your question doesn't languish unanswered.
Next, we'll put some labels on the roads. - In the Layer Properties dialog box, use the Labels tab to label the roads layer with the roads' name attribute using a small gray font (this in the Text submenu). Set the label distance as 0.5 mm (this is in the Placement submenu of the Labels tab) so that the layer is not too close or too far away from the line. When working with streets, you might also want to check Merge connected lines to avoid duplicate labels (this is in the Rendering submenu). Finally, set Scale-based visibility (or Scale dependent visibility) preventing the labels from displaying when the map is zoomed out beyond 1:10000. When you are finished, you should have something like this.
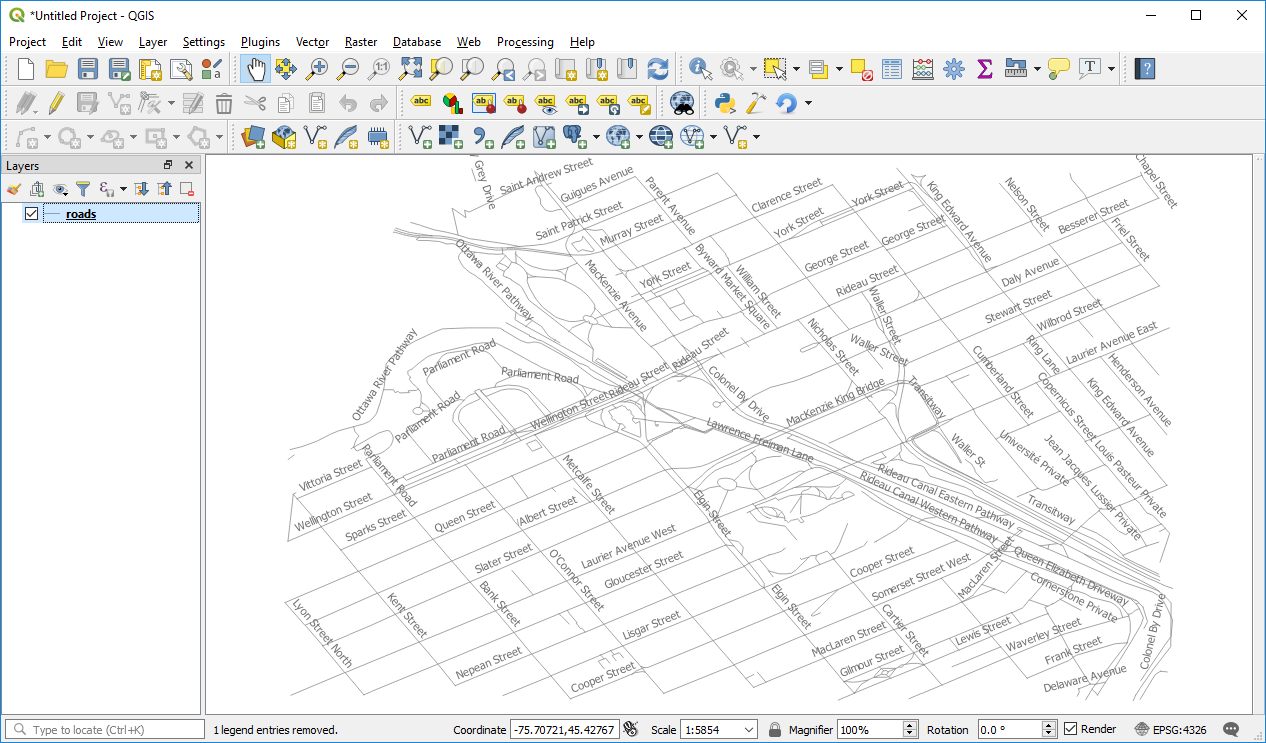 Figure 1.4
 - Add the dataset natural.shp and symbolize it as a light green fill with no outline. You will need to set the Stroke style to No pen in order to accomplish this.
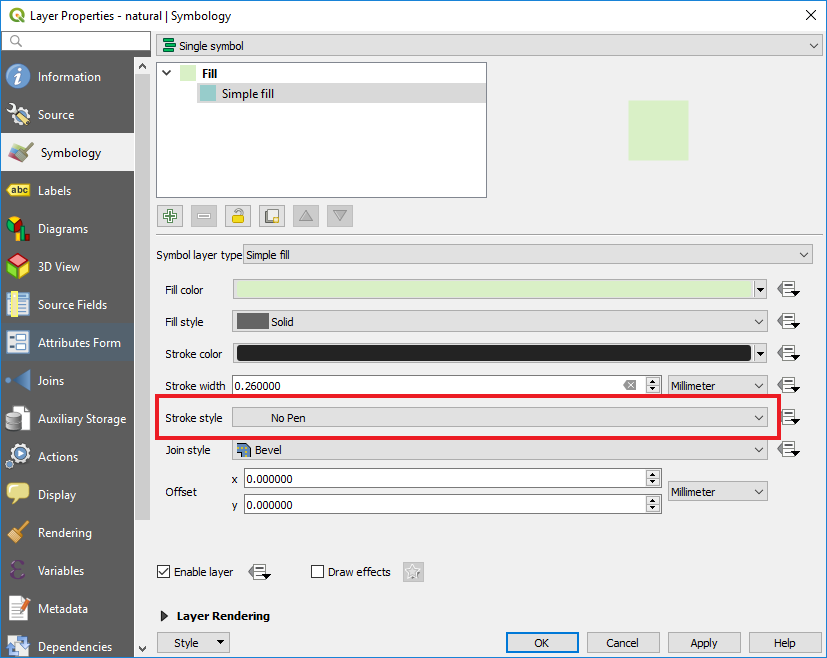 Figure 1.5
 - This is a good time to save your map. Click Project > Save As and save your map as Ottawa.qgz. It will be easiest if you save it in the same folder where your shapefiles live.
Note: You may be accustomed to using the .mxd format, and now is an opportune time to learn that .mxd is a proprietary format that is used by Esri software. QGIS uses an easily-readable XML format for storing projects (.qgs file) and the .qgz file is a zipped version of the .qgs file. You can also choose to store your project as an unzipped .qgs file and then open it in a text editor to inspect the XML code. However, .qgz is now the default file format for QGIS. - Add buildings.shp to the map, and experiment with a multilayer symbol to make the buildings “pop out.” Here's how I set this up:
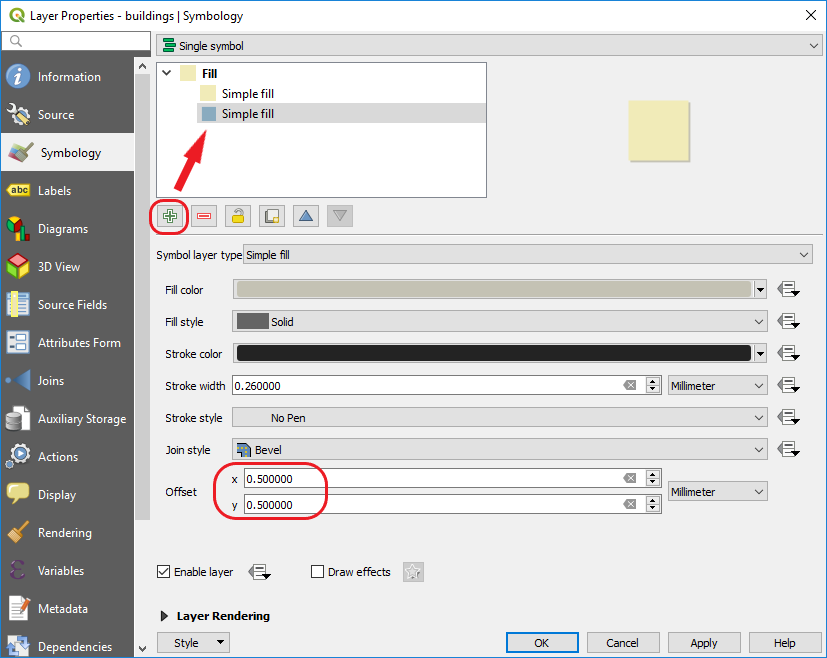 Figure 1.6
 - Add bus_stops.shp to the map, and symbolize it with an SVG marker that looks like a bus. In the Symbol layer type dropdown, select SVG marker like in the image below.
SVG stands for “scalable vector graphics.” It's a way of making marker symbols that don't get more pixelated as you expand their size. If you want a different color of marker, you can open the SVG in a graphics editing program such as the open source Inkscape, recolor and save a new version of the graphic, and then browse to it in QGIS.
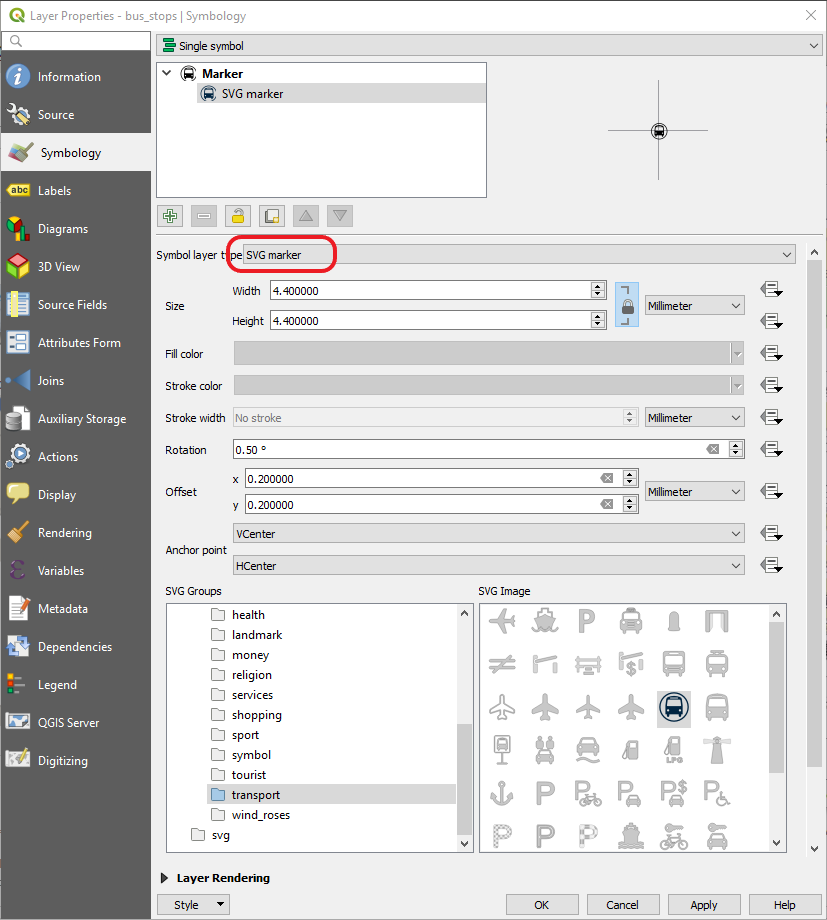 Figure 1.7
 - Set a scale range on the bus_stops layer so that it doesn't appear when zoomed out beyond 1:10000. You can do this in the Rendering tab.
This is also a good time to set a user-friendly display name for this and other layers. The display name appears in the layer list. You can change the display name in the Source tab.
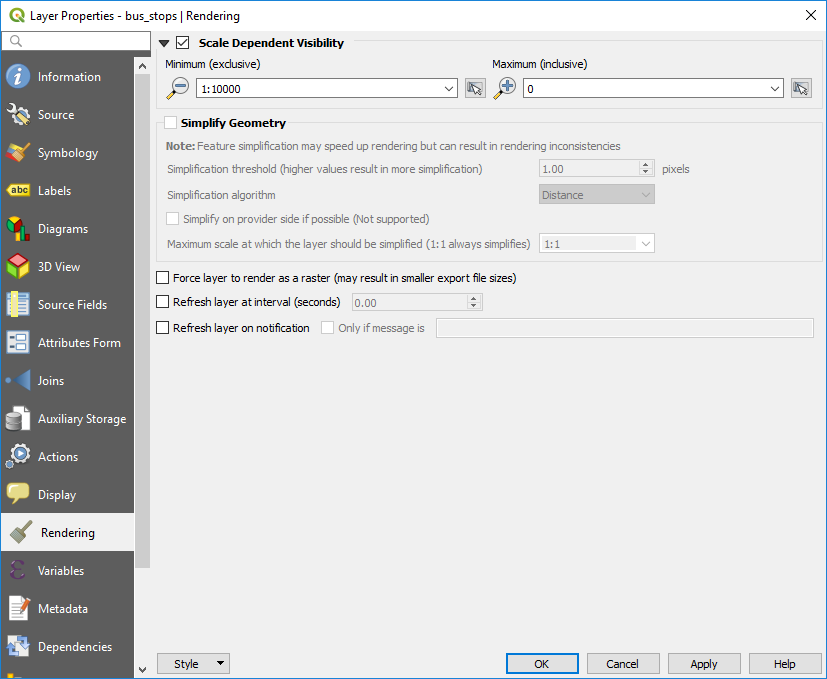 Figure 1.8
 - In the layer list, highlight the bus stops layer and click the Show Map Tips button. This button varies in appearance depending on the version of QGIS you're using, but in all cases it contains a little yellow speech bubble, like this
 . Map tips add some interactivity to the layer, a la Google Maps, so that when you hover over a stop for a short moment, the name of the corresponding bus line will be displayed. As we work with web maps during this course, we'll work with getting the same kind of interactivity for particular layers of interest.
In some versions of QGIS, this will show the bus stop ID number by default rather than the name. To remedy this, open the bus stops' Layer Properties again, go to the Display tab, and select the name field in the Display expression or Display name dropdown list.
Your map should now look something like the following: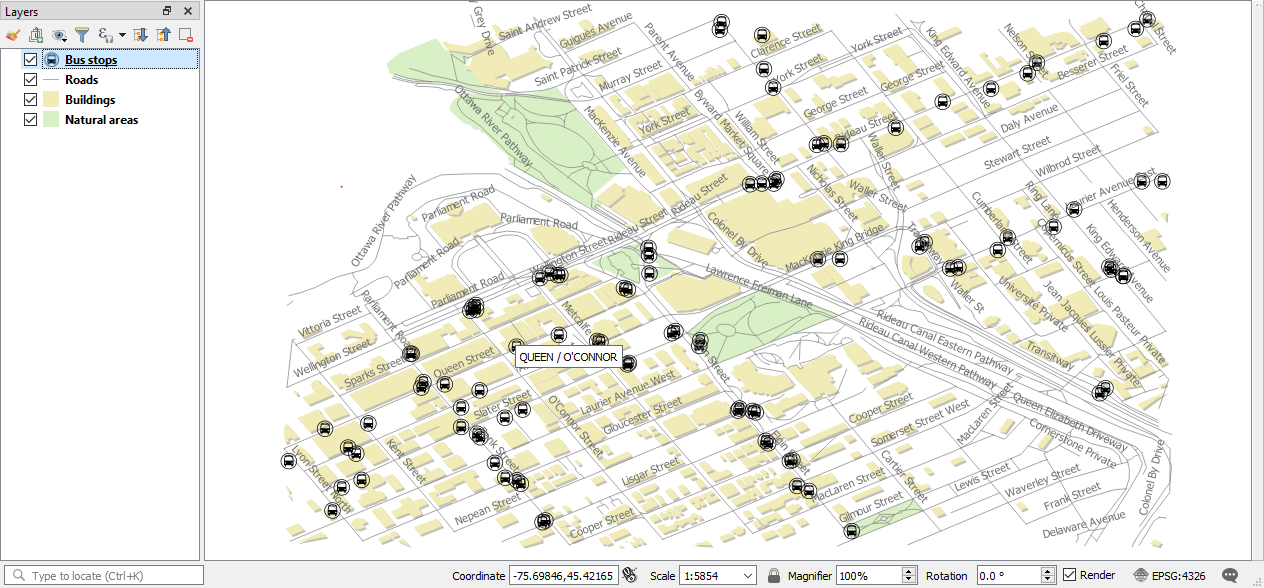 Figure 1.9
 - Save your map, then add some more shapefiles and experiment with symbolizing and labeling things in an aesthetically pleasing way.
- Post a screenshot of your beautiful QGIS map on the "Lesson 1 walkthrough result forum" on Canvas. Include some commentary about any features you found useful.
Lesson 1 assignment: Responding to FOSS
In this week's assignment, you'll watch and read several opinions on the use of FOSS within the GIS community. I will then ask you to respond to these in a detailed discussion below.
Readings
- Read the online chapter Web GIS [30] from the GIS&T Body of Knowledge, a web-based resource used by educators to outline the essential information that people should know about geographic information science and technology. This assigned chapter contains an overview of the most important things to know about Web GIS, and mentions many of the topics that will be covered throughout this course. Becoming familiar with the terms and acronyms in the glossary at the beginning will help you when you encounter these later on.
- Watch the video below: A GIS Manager's Guide to Open Source. This is a talk given by Paul Ramsey, a major contributor to PostGIS. He submits an argument for the use of FOSS and summarizes some of the FOSS tools available to geospatial professionals. Plan for 45 minutes to watch the entire video.
Click here for transcript of A Managers Guide to Open Source.
The Unknowns: A Managers Guide to Open Source
PAUL RAMSEY: I'd like to start this-- start this morning with a digression, actually, off to the side. One of my favorite pieces of poetry was composed not by a Beat poet in Greenwich Village or by a 19th century romantic, but by one Donald Rumsfeld, then Secretary of Defense, from the Pentagon press briefing room on February 12, 2002. Hart Seely later formed the secretary's words into a poem, which was published in Harper's Magazine in June 2003 as "The Unknown."
"As we know, there are known knowns. There are things we know we know. We also know there are known unknowns. That is to say, we know there are some things we do not know. But there are also unknown unknowns, the ones we don't know we don't know."
I found the same sentiments expressed less elegantly, but more forcefully, in diagram form, showing the things we know, the stuff we don't know, and the vast expanse of stuff that we don't know we don't know. And it's scary that the largest category by far is the one that we definitionally cannot comprehend, the stuff we don't know we don't know. Of course, this is an epistemological diagram of all knowledge. So, we can constrain it a bit by noting that, for practical purposes, we're really only concerned with the stuff we should know. But unfortunately, the stuff we should know still falls in all three categories.
And as IT managers, there is, amongst the stuff we should know, the stuff we should know about open source software. And I hope, at this point, we can all agree that open source is worth knowing about. The largest, most heavily trafficked companies on the internet have built their infrastructure on open source for practical, hardheaded business reasons. And open source is no longer just a technology fast follower. Leading-edge work in fields like software development tools, document search, big data analysis, and NoSQL storage, it's being spearheaded by open source projects.
And that's not because open source is just some kind of fad or just something the cool kids currently consider trendy. It's because open source is a bona fide trend. It's a trend that's been building for over 30 years. And it's changing not only the way we build software, but how we collaborate in building knowledge in general.
So I bring two perspectives to this topic, the perspective of a developer of open source software-- a hacker, a programmer, in particular on the PostGIS spatial database, which I've been involved in for 10 years-- but I also bring the perspective of a manager. I ran a small consulting company, Refractions Research, for 10 years. My goal today is to modify your internal epistemological diagrams a little bit, maybe to something more like this, and not because I expect you to all rush back home and implement open source, but because when you know more about open source, it becomes an option.
So to understand why open source is an option, it helps to have some background. So let's start with a little history. Once upon a time-- once upon a time, there was a young man with wild ideas about freedom who took on the established order of things, appeared to lose, but, in the end, changed the world forever, though perhaps not in ways you would approve of-- actually not that young man, although there is a striking resemblance.
In 1980, Richard Stallman was a programmer at the MIT Artificial Intelligence Lab. So some of the best minds in artificial intelligence worked together there. They shared ideas and implementations of those ideas in code. It was, to hear Stallman tell it, a golden age, a brief golden age of collaboration and intellectual ferment. And then one day-- and don't all horror stories start this way? One day, the lab got a new printer. It was a Xerox 9700. That's the actual printer. Unlike the print it was replacing, the new printer came with a binary-only printer driver, OK? The source code was not included this time.
Now, Stallman had modified the previous driver to send a message to users when the printer jammed. With the new binary driver, he couldn't do that. The situation was inconvenient. It was a pain.
Now, why couldn't Xerox just share their code? Everyone would be happier. Now most people would have shrugged, right-- eh, pff. But for Stallman, it was a galvanizing moment. So over the last five years, working in the AI lab, he'd gotten used to sharing code and ideas with other programmers. But now the atmosphere in computing was changing. And it wasn't just the printer driver.
A private corporation had started recruiting his colleagues in the lab. And once they were hired, they were allowed to exchange code to him anymore. Completely unrelated nerd trivia-- the company who was doing the hiring, Symbolics, was the very first company to register a dot-com domain name in 1985. So, the old computers in the lab, the software that ran on it were becoming obsolete. The new computers being purchased by the lab included operating systems that were locked down. You had to sign non-disclosures just to use them.
So, it was the death of the old collaborative community. And Stallman worried that the first step in using a computer was now to promise not to help your neighbor by accepting a license agreement. So as a highly talented, idealistic computer programmer, Stallman wanted his work to serve a larger purpose. The financial promise of working in the proprietary industry wasn't enough. The sterile intellectual amusement of continuing his work alone in academia didn't appeal. So, facing the death of his old intellectual community, Stallman asked himself, was there a program or programs that I could write so as to make community possible once again?
You can't use a computer without an operating system. So Stallman decided that, first, he needed to write an operating system. It had to be portable to many computer platforms. It should be compatible with the popular new Unix operating system to make it easy for people to run their existing programs on it. And most importantly, it should be free.
Now, Stallman had a very particular definition of "free." He meant that it should be free to run the software, you should be free to modify the software, and you should be free to share the software. You should also be free to share any modifications you made to the software. Stallman wasn't talking about free as in price. He was talking about free as in freedom.
Like, in a Latinate language like French, Spanish, or Italian, it's more obvious, right? He wasn't talking about logiciel gratuit, he was talking about logiciel libre, or software libre, or il software libero. He's talking about liberty, right? He's talking about liberated software. The key addition is liberty.
So in 1984, rather than join a computing industry he considered morally bankrupt, Stallman basically decided to start a new one from scratch. It was an audacious plan. Stallman called his new system GNU, which stands, recursively, for GNU's Not Unix. Do you see the recursion? GNU's not Unix. What's GNU? GNU's not Unix. What's GNU? GNU's not Unix.
Let me take just a very minor diversion here to add some extra flavor. In order to ensure GNU remained free and did not get subsumed into a proprietary system in the future, Stallman released his work using a scheme he called copyleft. Generally speaking, intellectual books-- books-- intellectual works-- books, movies, songs, computer programs-- they're either under copyright or public domain. The author either retains full control over the work-- like all rights are reserved-- or no control-- no rights are retained. Copyleft, and open licenses in general, use the copyright system to selectively grant permission and exert control over software through licensing.
Authors retain copyright, but they grant liberal usage rights via a license. So the copyleft license grants permission to all recipients of the code to use, modify, and redistribute the work in any way they wish with one exception. The license requires that any redistribution of the work or derived products include the source code and be subject to the same license. The legal language-- very complex. But the principles are hardly foreign. Share and share alike. Do unto others as you would have them do unto you.
So back on the highway-- in 1984, Stallman quits his job at MIT, and he starts working on GNU full-time-- no visible means of support. This is a labor of love. But where to start? OK, from a blank canvas, you want a completely free software ecosystem. What do you do first? If you wanted to build 100%, all-handcrafted house, you would start by handcrafting your tools. And Stallman did the same thing with GNU versions of software development tools.
He starts by writing a text editor, GNU Emacs, so he can write his free system using only free tools. The Emacs editor proves so popular, and internet access is still so rare, that he's able to earn a small living-- but the best programmers don't need Emacs-- a small living selling tape copies of the code, distributed under copyleft, of course. And then he writes a compiler, GCC. And you can still find GCC in every Linux distribution, also the Mac OS 10.
Stallman lives like a monk. He works like a demon. He attracts some followers and helpers who formalize the project in a foundation. By 1990, they have most of the components of an operating system. Most importantly, they have the full programming tool chain. They've got shells, compilers, debuggers, editors, core libraries, and so on-- all the things you need to write complex software. What they don't have is a Unix kernel, the piece of software that talks directly to the hardware. At this point, all their free tools are still being run on proprietary Unix.
OK, in 1991, a Finnish computer scientist named Linus Torvalds buys a new computer, an Intel 386. He's got access to Unix systems at the university as a student. And he wants to run Unix on his 386 at home. This is not possible. The good implementations for the 386 cost more than the computer itself. The cheap implementation Minix is quite limited. So, Linux writes his own kernel.
He uses Stallman's GNU tools to write and compile it. Add in August of 1991, he posts the following on an internet discussion list. Excuse my Finnish accent.
PAUL RAMSEY (FINNISH ACCENT): "Hello, everyone out there using Minix."
PAUL RAMSEY: "I'm doing a free operating system-- just a hobby, won't be big and professional like GNU-- for 386 AT clones. This has been brewing since April and is starting to get ready. I'd like any feedback on things people like or dislike in Minix, as my OS resembles it somewhat-- same physical layout of the file system-- due to practical reasons-- among other things.
I've currently ported Bash and GCC. Things seem to work. This implies I'll get something useful within a few months, and I'd like to know what features most people would want. Any suggestions are welcome, but I won't promise I'll implement them-- smiley face-- Linux."
Underneath the technical language, note the subtextual bits, the humility, right-- it's just a hobby-- the interest in other people's ideas. What do you like? What do you dislike about Minix? The posting is an invitation, right? Does anyone else want to come out and play? They do. Within 15 minutes, he has a reply-- "Tell us more! Does it need an MMU? How much of it is in C?"
Within 24 hours, he has replies from Finland, Austria, Maryland, England. In a month, the code's on a public FTP server. Within four months, it's so popular that an FAQ document has been written to handle the common questions. Linus Torvalds tapped a seam of enthusiasm just dying to express itself. People who loved computers and computing just wanted to play together. And through the medium of the internet, using only the simplest tools-- diff, patch, FTP, and email-- he built a community of thousands of contributors. And together, they built a usable operating system.
Now, something important changed between the time that Stallman started the GNU project and Torvalds released Linux. The values of collaboration were the same, but the opportunity to exercise those values was far greater via the internet. When Stallman started GNU in 1984, there were a thousand hosts on internet. When Torvalds started Linux in 1991, there were over 400,000. And the pool of potential collaborators was in the midst of a huge expansion.
Permit me one more short digression on the digression to talk about Star Wars. And in particular, let's look at a website called Star Wars Uncut. Star Wars Uncut has taken the original movie and chopped it into 473 15-second scenes.
[VIDEO PLAYBACK]
Each scene is then separately claimed and reenacted by site members. And then they upload their scene, their 15-second scene. And the result looks like this. They've actually finished the project now. So they have the whole 90 minutes in 15-second chunks. And you can watch Star Wars Uncut, the full edit. For Star Wars aficionados, it's the most hilarious 90 minutes you'll ever spend. Because you just can't predict what's going to come next? Because it's an incredible mix.
This is actually my favorite part right here-- oop, upstairs. The costumes are fabulous. The stop-motion ranges from LEGO to plasticine. Millennium Falcon, you know-- really, whatever you can imagine, right?
[END PLAYBACK]
So, it seems pretty frivolous, right? But break it down, right? How is this frivolous collaboration possible? And why is it only happening now, right? Why didn't it happen 10 years ago? There are just as many Star Wars nerds, maybe more, 10 years ago as there are now.
First, the activity requires easy access to video recording and editing tools. And until recently, video editors were very expensive, and cameras. And it requires enough bandwidth to download and upload video. And until recently, people didn't have that kind of bandwidth in their homes. And finally, it requires Star Wars geeks.
But generalizing then, to build the large, collaborative project, you need tools freely or at least very cheaply available. You need sufficient connectivity between participants. You combine that basic infrastructure with community collaboration and love for the subject matter, and magic happens. There's many, many more examples of this kind of group collaboration. The academics call these collaborations "commons-based peer production."
And open source software in general, and the Linux project in particular, are some of the earliest examples of internet-mediated, commons-based peer production. You may have heard of Wikipedia and OpenStreetMap, right-- millions of people collaborating over the internet to build rich, valuable collections of knowledge. This is not a fad. This is the new normal, OK, complex structures of knowledge built by distributed communities using free tools, held together by a shared interest, an emotional interest or a financial interest, in the product being created.
The proof's already there, right, in our software, our encyclopedia, in our maps. The development of Linux fits the commons-based peer production pattern. The free access to tools was provided by the GNU project components. The medium of communication was just email. The work they were sending around was source code, snippets of text. And why do open source programmers do it? What's the core motivation? It isn't money. Fundamentally, they code because they love it.
It's the same reason Star Wars geeks reshoot 35-year-old films, why food geeks post restaurant reviews, why car geeks rebuild '68 Camaros, OK? It's an avocation. At least it starts that way. But open source software has a wider utility then restaurant reviews and vintage muscle cars. So as projects have expanded, they have, at each stage, become more and more integrated into the wider community.
Linux is a good example. Start with Linus, the early group of enthusiasts in 1991. These are individuals. They're working in their spare time. They're doing it for love. By 1992, you get distributors. They're packaging up Linux kernel with collections of GNU and other tools to form full working operating systems. First, they do it for love, helping other Linux lovers. But soon they're covering their cost and time selling CD-ROMs for $50, $40. So programmers are earning livings with small Linux businesses within a couple of years of the project's start.
1994, Digital Equipment Corporation sends Linus a free Alpha workstation in the hopes that he'll port Linux to the Alpha chip. He does. Simultaneously, David Miller ports Linux to the Sun processor. So Linux is now competing with "real" Unix on corporate big iron. Over the next couple of years, the makers of these machines, they started to hire Linux programmers of their own.
In 1995, Red Hat Linux is formed. That's a company which will eventually grow to an $8 billion Linux support enterprise. 1996, Los Alamos National Labs builds the first Linux cluster for simulating atomic shockwaves. By 1998, the explosion of the internet into general public use is underpinned by thousands of commodity servers running Linux as their operating system. Microsoft is drafting strategy memos about how to counter Linux. And Linus Torvalds is featured on the front page of Forbes magazine, OK?
Linux is no longer a hobbyist activity. It's deeply embedded in the economy at multiple levels. This is in 1998, just seven years after that first newsgroup post.
Fast-forward to the present. The NSA employs Linux programmers to make their systems secure. NASA employees Linux programmers to run it on space mission hardware. Google employs Linux programmers to optimize their massive compute clusters. Oracle employs Linux programmers to support Oracle Optimized Linux. IBM employs Linux programmers to make sure it runs on systems and mainframes. Microsoft employs Linux programmers to add kernel support for Windows virtualization, and so on, and so on, and so on.
So, here's the question I get asked a lot-- how do you make a living writing free software? Referring back to the previous slide, hopefully it would be obvious. I make my living the same way my dentist, my barber, and my plumber make their livings. I sell my very specialized expert services in open source spatial database programming to people who need those services. And in a globalized, internet-connected world, there are plenty of people who need them.
So, I could talk to you for another half hour about different ways open source projects are deriving support from the general economy. But unfortunately, then, I wouldn't have enough time to talk about you-- yes, you, right? Should you use open source? Here are five good managerial reasons to consider open source for your enterprise-- cloud readiness-- also known as scaling, also known as rapid deployment-- license liability-- or actually, lack of same-- flexibility and its kissing cousin, heterogeneity, staff development and recruitment, and most importantly, market power.
So first of all, technical superiority-- did I forget to mention this one? There are open source advocates who will claim, straight up, no [INAUDIBLE] that open source software is just technically superior to proprietary software. They will say that the open development model results in code with fewer bugs per thousand lines, higher levels of modularity, better security due to wider peer review, faster release cycles, better performance. I think that's actually often true. But it's unfair to present the list with also adding that, in general, open source projects have a narrower base of features. Though larger projects like Linux, or Postgres, or Hadoop, or Eclipse are often fully competitive on features too.
Like Linux, for example, they've concentrated an incredibly large number of very high-quality technical contributors into one code base. There's more people than any one company could ever employ. But many open source projects, and certainly those in the geospatial realm, operate with, at most, a few dozen contributors. They aren't out of the league of corporate development teams, although appearances can be deceiving. And big companies keep their development processes secret.
But sometimes the veil falls off, and it did recently. I was told the number of developers working on SQL Server Spacial was actually fewer than the number working on PostGIS-- bit of a surprise. If you're interested in the topic of technical superiority, David Wheeler has a 2007 paper, "Why Open Source Software? Look at the Numbers." It brings together all the research into one very, very, very long page. It's well worth reading.
So moving on, number 1, reason number 1, cloud readiness-- also known as scaling, also known as rapid deployment-- and it looks like I'm squeezing three topics into one, but I'm not. These three benefits are all aspects of the same open source attribute, the $0 capital cost of deployment. Always on the trailing edge of the leading edge, Microsoft has been advertising, to the cloud. More and more computing tasks are going to be delegated to cloud computers hosted in big data centers somewhere on the internet. And more users will expect direct access to data through web services, which means more mobile devices are going to consume those services with every passing year.
And all that new user demand adds up to potentially unconstrained load on services and growth curves that quickly transition from horizontal to vertical. Scaling services is important, right? And it's getting even more important. Now let me take a quick detour.
I'm a principle developer of the PostGIS open source spatial database. And one of the things I've noticed over the years about PostGIS is the most enthusiastic adopters have been startup companies. Startups love it. GlobeXplorer based their satellite image service on PostGIS. They chose it over Oracle Informix. Redfin started their real estate information site in MySQL and moved it to PostGIS for performance reasons. MapMyFitness-- local company-- they developed their mobile fitness mapping application on top of PostGIS.
And the Google Analytics for the PostGIS website show that California is the state with the highest interest. And inside California, it's San Francisco and the Silicon Valley that have the highest interest. The reason startups love open source software is because it removes a critical constraint to their growth.
So the cost of computing hardware falls dramatically year after year. The cost of proprietary software does not follow the same curve. So if you're using software license per CPU or core, it means the primary driver of scaling cost is software cost. So the math can be brutal even before you start scaling horizontally.
So, this Dell T710-- dual quad-core CPUs, 36 gigabytes of memory, 2 terabytes of RAID 10 storage-- will set you back $6,953. OK, now you've got a lovely server. Let's put Oracle Enterprise on our fancy new server. We got 8 cores. Multiply that by a 0.5 "processor core factor" times the per-processor price of Oracle Enterprise, add in the Spatial because we are GIS guys-- and remember, you need Enterprise to run Spatial-- and the grand total is a cool $260,000, or as Larry Ellison calls it, a quarter-- of a million dollars.
Just contemplate the numbers for a moment-- hmm, hmm. The exact same unpleasant math applies to GIS map serving, right? And it gets worse and worse the more you scale up. Now let's compare scaling in open source in our proprietary map servers.
At initial rollout, the load is small, so we buy one server for $5,000 and one copy of the software for $30,000. And to be fair, or perhaps unfair, let's assume that staff is already fully trained in the proprietary software but requires an immense amount of expensive training or learning time to adopt the open source. So there's our total for the first server, $35,000. Great.
Now, great news-- the citizens love the new map service. Maybe someone built a cool iPhone app around it. And suddenly, the load on the machine quadruples. What does it cost? Add three more servers. Add three more licenses. You don't need more training. The software is the same. And the more you scale, the worse the totals on the left become.
Now it's possible you're already so highly evolved that you run your public services in the cloud. So there are no capital costs for servers. But the math in the cloud remains just as unpleasant. Per instance, proprietary software licensing dwarfs the per-instance hardware cost. And the only difference is the hardware costs in the cloud are more spread out more evenly over time instead of being concentrated in big, capital-intensive bursts.
The final reason startups love open source is they don't have to ask permission to fire up those new services. So they can respond to crises and opportunities very, very quickly. Any software that requires a license or a license manager can potentially slow a deployment for days or weeks. And if you're suddenly enjoying a surge in traffic, the last thing you want to offer your new customers is a slow customer experience.
Number 2, license liability-- lack of. So before I was a programmer, I was a manager. Figure out that career arc. And I used to run a consulting company. And at our peak, we had 30 staff. It was a small company. But still, that meant 30 workstations under 30 desks running 30 licensed copies of Windows and 30 licensed copies of Microsoft Office. At least that was the theory.
In practice, the company had grown very quickly over two years. And software, particularly application software, had been installed wherever it was needed whenever it was needed. So when we finally got around to counting up the difference between what were using and what we owned, it was a bit shocking. We had 10 licenses of Windows, five for Office. Coming into compliance would have cost almost $20,000. Not coming into compliance would risk hundreds of thousands of dollars in fines. We were one disgruntled employee away from a big cash crunch.
And so we examined what we wanted our software to do. Our developers needed Java development environments. Our BAs needed document processing. Our managers needed some word processing. Everyone needed email. So we switched to open source. Everyone got Open Office for word processing. Email and web browsing was with Firefox and Thunderbird. Some developers switched to Linux as their operating system. And we bought a few extra Windows licenses to come into compliance for the rest. It was all surprisingly easy.
Now two things to keep in mind-- first, if we'd been more disciplined in the first place about using open source, we wouldn't have built up the license liability we did. On the server side, we'd always been a Linux and open source shop, so we never built up a problem there. Second, once we got the open source discipline, our potential future liability problems were reduced. There were just a lot fewer licenses remaining to keep track of.
So, we replaced our office automation side without much trouble. What about the GIS side, right? Some tools were just too specialized and ingrained in our workflow to be replaced. So we just worked to manage our license load. We put FME licenses on a shared system with remote desktop. Other things had just gotten out of hand. ArcView 3 is just really, really easy to copy, isn't it? How many of you still have a legal copies of ArcView 3 floating around your offices or your homes, right? If I listen very carefully, I can hear a license compliance manager's teeth grinding somewhere in the back, right? it's OK. Jack's already rich.
Our story ended with removing all the unlicensed ArcView copies and using QGIS instead. OK, here's a few screenshots of QGIS. It looks eerily familiar, right? Doesn't it? Same UI, it's got a basic scripting language, some simple printing capability. It fills a need.
But the core point here is not that proprietary software is replaceable-- though it often is-- it's that proprietary software adds a layer of legal liability that needs to be managed. And that takes time and effort because software gets copied a lot. Like, why wouldn't it? You can make a perfect copy with two keystrokes-- Control-C, Control-V, Control-C, Control-V. And if the software is proprietary, each of those keystrokes digs a compliance hole for your organization-- click, click, click-- like deeper, and deeper, and deeper. And you don't realize how deep that compliance hole is until you fall into it.
Number 3-- flexibility and heterogeneity-- now this is a bit of a geeky argument, OK? But bear with me. First, flexible components are easy to connect to each other and to adapt. You can use flexible components from multiple vendors to build a heterogeneous system. A heterogeneous system incorporates components from multiple sources.
Now flexibility is great, but usually, you have to trade some ease of use to get it. Which toolbox would you rather work with, the hex tool-- it's convenient and easy, fits in the palm of your hand, three sizes-- or the socket set-- modular, extensible, 64 sizes, metric and imperial? One's easy. One's flexible. So here's a practical example of the values of flexibility and heterogeneity. The British Columbia government built their web mapping infrastructure using ArcIMS for internal web servers and the web applications, and using Map Server for external WMS services.
Both web mapping services' servers pull their data from the central ArcSDE instance. So they have a flexible tool in Map Server and a heterogeneous infrastructure using both ArcIMS and Map Server. A few years ago, the infrastructure team applied a minor, minor-- oof-- teeny, weeny sliver of a service patch to the Oracle database that hosted ArcSDE. And to their surprise, the minor patch locked up SDE, and they couldn't restart, which meant that their web services that depended on SDE were also down.
The WMS services were bought back up in three days after a long process of loading raw data into a temporary PostGIS database, because Map Server could read from PostGIS just as easily as from ArcSDE. This was no problem. The ArcIMS services remained offline for the duration of the outage, which was 28 long days, until a patch to ArcSDE was made available.
As a general proposition, proprietary product lines talk well to other systems from the same vendor and less well to systems from other vendors. Competitive advantage dictates this arrangement, right? But it puts the interests of the customer, in interoperability, below the interests of the vendor in promoting lock-in. As a general proposition, open source products talk well to all other systems.
The reason why is less obvious, right? But it has to do with the practical motivations of the developers. Once a project moves past the for-fun stage, the developers are working on it because it is a workplace tool. They need it to do something. And the something they need it to do is usually within the context of other software.
So as a developer, if you like Map Server's GML support, but you work in an environment where most of the data resides in ArcSDE, a reasonable thing to do is to write code to connect the two. That's exactly how Map Server got SDE support. A guy in Iowa needed to talk to SDE, and he added the support. One of these practi-- one of-- each of these practical interconnections increases the overall value of the product, bringing in more developers who bring in their own unique interconnection requirements.
Indulge me in a short digression. This is the boreal forest around Prince George, British Columbia, where I grew up. In the mature forest outside of the creek valleys, over 80% of the trees are pine and spruce. In the late '90s, an infestation of mountain pine beetle began in Wells Gray Park in the northwestern corner of British Columbia. The local infestation turned into an epidemic over the next few years. The epidemic has been uncontrolled for a decade now. And it's only forecast to abate by the middle of this decade when the population of mature lodgepole pine has been completely digested.
Here's a graph of the number of hectares affected over time. The pine beetle has been so successful, for lack of a better word, not just because climate change has reduced the number of cold winters that kill beetles, but also because of its good luck in finding a huge, homogeneous area of mature boreal forest ready to consume. This is the product of 50 years of successful forest firefighting-- just a little digression on the digression.
Computer worms are pieces of code that self-replicate, kind of like beetles. They start from a host, they scan for other vulnerable hosts, and then they copy their children to the new host, where the process continues. This is the infection timeline for the Code Red worm, which, in 2001, spread through a vulnerability the Microsoft IIS web server. Familiar, yes? OK, let's get back on the road.
Homogeneous systems and single-vendor strategies are usually convenient, but there is a trade-off. They lack flexibility, which can make it hard to adapt them for unexpected purposes, and they represent reliability risk and increased vulnerability to population catastrophes, issues that are capable of shutting down your whole infrastructure in one go.
Number 4-- staff development and recruitment-- so one of the most gratifying things I've heard over my career of teaching about open source software is this-- that talk you gave last year totally changed my life. They're saying this about a software talk. This is totally absurd thing to hear about a software talk. And yet, I've actually been told this several times.
The people saying it are technology staff in GIS departments. And the reason they say it is because adopt the open source gave them a whole new toolbox to solve problems. The exhilaration of knowing what's in that box and the freedom to use that knowledge to make cool things without external constraints like licenses on what they could make was deeply empowering for them. These are very special people. They're the kind of people you want to hire.
I recently came across a diagram which explains it all in one page. Take the personality traits of intelligence, obsession, social ineptitude. People with intelligence and obsession are geeks. Inept, smart people are dweebs. The inept obsessives are dorks. And those with all three traits in the middle are the nerds.
So as GIS managers, building out new systems, pushing the envelope, you probably want smart folks with a mapping technology obsession, geo-geeks ideally. But you can settle for geo-nerds. So how do you get these geeks and nerds working for you? Offer something interesting. Remember, these are technology obsessives. So permit me a short digression to talk about LISP.
Paul Graham is a Silicon Valley entrepreneur and a major-league nerd who tells this story about building an e-commerce site, an e-commerce engine that he eventually sold to Yahoo in the late '90s. For personal, technical reasons, they chose to write their engine in LISP, which was a rare choice, right, since most mainstream use of LISP had disappeared by the late '90s. But using LISP had this odd side effect, which was, when they advertised job openings, they got these amazing resumes, rock star candidates. And when they interviewed them, they all mentioned their interest in LISP.
Now, by the '90s, LISP was mostly used in academic settings. But it retained a prominent role as a customization language in-- wait for it-- Emacs, Richard Stallman's text editor for super-programmers. So, the super-nerd programmers who obsessed over Emacs LISP macros were intrigued by the chance to do web development in LISP.
OK, so you're not going to build your websites in LISP. I'm not recommending that. But you might build them in Python or Ruby. And you might run them on Linux. You might serve them with Map Server or GeoServer. You might store your data in PostGIS or PostgreSQL. You might build your web pages with JavaScript, and OpenLayers, and GeoExt. This does work in the real world.
The city of Northglenn, Colorado, they wrote a report about their experience with open source. And they cited some of the motivations I already talked about. But in the section "unobvious motivations for adoption," there is this quote-- "Contrast an open-source implementation position with a 'defined skill set' job where the first diagnostic action is to reboot the server, and the second is to call the vendor and wait in a telephone hold queue. It's easy to understand why open-source jobs are prized."
Finally, market power-- so I chose not to give a deeply technical talk today. So I haven't really run through the panoply of open source GIS software that's available to you. But let me do that quickly, just for effect, OK? So for databases, you have PostGIS, MySQL, Ingres, and SpatiaLite. For map and feature servers, you've got GeoServer, Map Server, Mapnik, TinyOWS, SharpMap, and others. For tile caching, you've got TileCache, GeoWebCache, Tile Stache, and others. For web interfaces, you've got OpenLayers OpenScales, GeoExt, Polymaps, and others. On the desktop, you've got gvSIG, uDig, QGIS, Open Jump, MapWindow, and others. And underneath it all are libraries like GEOS, and GDAL, and OGR, PROJ.4, JTS, GeoTools, which can be leveraged with a scripting language like Python, Perl, Ruby, Groovy, ASP.NET, and others-- whoo, right? It sounds complex, right?
So, I give this talk, which, five years ago-- to conference, five years ago-- it was a quick, 20-minute talk. And it's now metastasized into this 90-minute marathon where I cover all these options in detail. And afterwards, exhausted people, they come up to me. They say, ugh, open source offers too many choices. It's easier with just one vendor-- which is odd, right? Because we deal with lots of choice in all the other markets we navigate every day. There's lots of kinds of cars. There's lots of kinds of blue jeans, lots of kinds of coffee.
And we've got a good idea what a market with just one vendor looks like, right? We actually have laws against it. Proprietary software has a dirty little secret. And it is a secret that lives in plain sight. Even in otherwise competitive markets, the effect of proprietary license is to-- licensing-- is to create an instant de facto monopoly.
How many companies provide support for your proprietary software? One. How many companies provide upgrades? One. How many companies provide enhancements? One. And proprietary companies guard their aftermarket monopoly zealously. Like, in 2010, Oracle sued SAP for providing service patches and support for Oracle to SAP customers. And there's a good reason Oracle sued. The profit margin on Oracle Support is 800%.
It's all about market power. Open source vests the market power in the software user, not the vendor. As a manager, you probably don't care about tinkering with the internals of your software source code. But you should care about holding on to your market power as a customer.
Bob Young, the founder of Red Hat Linux, asks this question of customers-- would you buy a car with its hood welded shut? No, right? So ask the follow-up question. What do you know about modern internal combustion engines? And the answer for most of us is not much. We demand the ability to open the hood of our cars because it gives us, the customer, control over the product we have bought, and it takes it away from the vendor.
We can take the car back to the dealer. If he does a good job, he doesn't overcharge us, he adds the features we want, well, we might keep taking it back to that dealer. But if he overcharges us, if he won't fix the problem we're having, or he refuses to install that musical horn we always wanted, well, there's 10,000 other car repair companies that would be happy to have our business. Making an enterprise commitment to a single vendor puts you permanently into the worst negotiating position possible. You go into every negotiation with no alternative position, no other store to storm off to. The only leverage you have left is the threat to buy nothing at all, right, which isn't much of a threat.
Speaking of market power, does anyone see the resemblance between these images-- huh, huh, huh, huh, huh, huh. I can't bring that segue back-- not a good detour, perhaps. So to maintain market power, provide our staff with [INAUDIBLE] opportunity to build heterogeneous systems, to lower license liability, to be able to scale, for all these reasons, it makes sense to have open source as an option. But how to start? We're going to need a Simpson's hand for this one.
OK, so to get started, you should first experiment with open source on pilot projects. Second, integrate open source into your existing operations slowly and incrementally. Evaluate the open source alternatives for yourself. Don't take other people's word for capabilities. And expand the capabilities of open source to do what you need done. So, we're running of time. I'll take these first two at once, experiment and integrate.
Way back in 2007, Pierce County, Washington State was a 100% ESRI and Microsoft shop with a limited budget for new software acquisition. It did have some talented technical staff and a GIS manager, Linda Gerull, who was interested in new ideas. In the fall of that year, she learned that the International Open Source GIS Conference was being held just to the north in Victoria. And she took the opportunity to send several of their staff. Keep an eye out for alternatives, she told them.
When they came back, they had lots and lots of alternatives. They were very excited. But they couldn't just tear down their infrastructure and start again, right? They had to maintain service continuity. So, the team started experimenting by duplicating some of the existing services that were built using old MapObjects technology and that were slated to be replaced anyways.
Some of them were just really simple services with very minimal user interface like this critical areas query form. It just takes in a partial number and address, and it returns a simple report on environmental factors based on a query of 18 layers. MapObjects was unstable. ArcIMS was too slow. But open source-- PostGIS in this case-- was just right. The form didn't change at all, just the back end.
And as their confidence and the tools grew, they looked at migrating core bits of their infrastructure. So more recently, they replaced their SQL Server database with PostGIS and PostgreSQL. And the key here is that they're continuing to run ArcSDE on top. And this allows them to use their existing data management tools like ArcGIS, but to use a pure open source web services stack directly against PostGIS.
So the changes are incremental, and they're exploratory. Pierce County still runs ESRI software. They still have ArcGIS desktops. But the number of options they have for deploying new systems is much higher. And the number of licenses they require is going down, not up. So their budget flexibility is increasing. At the same time, the staff has enjoyed learning the new technology.
And this is the conclusion slide from a presentation that Pierce County's Jared Erickson gave at the Washington State GIS Conference. Note the conclusions. Open source and ESRI can work together. Open source provides a diverse range of options. Now Pierce County experimented with a limited number of open source components. They experimented with PostGIS and PostgreSQL, GeoServer and OpenLayers. But as we saw earlier, there's lots of choices in every product category.
So, how do you choose the product that's right for you? What are the criteria of evaluation? David Wheeler, who I mentioned previously in the context of open source versus proprietary, also has a very complete document on how to evaluate open source software. And much of the evaluation is the same as with proprietary COTS, Commercial Off-The-Sort, software. And you look at whether the software does what you want and whether it works with the software you already have. But some key things are different.
In evaluating longevity, for instance, you don't necessarily look at the revenues or the customer count of a company, right? That's not there. But you look, instead, at the history and at the activity of the community around the software. And most importantly, you have to do the evaluations yourself. There won't be sales reps. There's not going to be snappy PowerPoint presentations, except for this one. There's not going be sales material or brochures. You're probably going to have to download, install, and test the software yourself.
But this is a good thing, right? This is a feature, not a bug. Trying the software yourself will give you a reality-based understanding of its features, capabilities, and weaknesses, rather than a marketing-based understanding, OK? I always get taken in by the glossy brochure.
But suppose you evaluate, and a software that meets most of your criteria is missing a key feature. What then, OK? Open source often has a lower feature count than proprietary software. But unlike proprietary, adding features that you need is not impossible. You might want special-purpose features for your project, like this list of really obscure functionality. A vendor would never add these because too few customers want them. These are all examples of features that I added on small services contracts to customers from Australia, the USA, Spain, Germany. None of these cost more than $4,000. All of them were added to the community source code, and they're still present in releases today.
In contrast, if you want a feature added to Oracle Spatial, you have to become the Department of Defense. And it would help to lean on Larry Ellison while you're yachting, right? Come on, Larry, add it. If you want a feature added to PostGIS, you just give me $2,000 to $10,000 and wait two to six weeks. It's a big difference in process.
This is a new way of thinking about enterprise software, right-- not just taking it as is, but pushing an open source project in the direction you need it to go. And it's hard to adopt a new way of thinking about software. But it's part of getting started in open source. You've got to experiment. You've got to integrate with your existing software. You've got to evaluate it yourself with your hands on. And you've got to expand the software the way you want to go and expand your thinking about how you approach using software.
The benefits will be organizations that can do-- that have greater scalability, lower license liability, greater flexibility, more staff empowerment, and more market power for the organization. Because open source isn't going away, right? It's not a fad, it's the new normal. Sharing code makes sense for individuals. It makes sense for organizations. The only people it doesn't make sense for is the existing legacy software vendors, which is too bad for them, right, because open source culture, it's just business as usual on the internet-- collections of people and organizations with shared interests, financial and social, using open tools, open licensing to build the software and the knowledge they need.
My name is Paul Ramsey, and I work for OpenGeo, the open source geospatial company. I'll be here for the rest of the event. I look forward to talking with you all. Thanks for listening to me today.
[APPLAUSE]
Credit: OpenGeoSuite [31] - Read the following items to see how a proprietary software company positions itself in the area of open source and how this changed over time. Pay attention to which aspects of FOSS and open standards are emphasized, and, just as importantly, make note of which FOSS projects are deliberately not mentioned:
1) Open Source Technology and Esri [32] - this news item is a historic account stemming from 2011
2) Esri's Open Vision [33] - Esri's current web site dedicated to its "open vision"; check out Jack Dangermond's initial statement linked at the top and then just browse the content and links from this page a bit
Discussion
Make a post on the "Lesson 1 assignment forum" on Canvas that addresses both of the following questions:
- Which of Ramsey's observations about FOSS and proprietary software have you observed in your own home or workplace (does not have to be GIS related)? Or, if you don't think Ramsey's observations are legitimate, justify why.
- After studying this lesson, would you advocate the use of a pure FOSS approach for your GIS work, or are there certain elements of proprietary software that you would retain as part of a hybrid approach? If the latter, which software would you want to keep as proprietary?
You can optionally make two posts addressing the questions separately. You will be graded on the depth of the arguments that you put forward in your responses and the evidence you produce to support these arguments, not on your opinions toward FOSS.
To receive full credit, please also write at least one response to another student's post building on whatever he or she said.
I encourage you to continue thinking about these questions throughout this course as you get more hands-on experience with FOSS.