Lesson 2: Designing web services and web maps
The links below provide an outline of the material for this lesson. Be sure to carefully read through the entire lesson before returning to Canvas to submit your assignments.
Note: You can print the entire lesson by clicking on the "Print" link above.
Overview
How do you start with some raw datasets on your computer and create a beautiful interactive web map that can be enjoyed by thousands of Internet users? This lesson will give an overview of how you can approach a web mapping project. The remaining lessons will get into the step-by-step details of how you make each part happen.
Objectives
- Identify the pieces of hardware and software architecture used in web mapping and describe the role played by each.
- Recognize the roles of basemaps and thematic layers in a web map, and identify examples of each.
- Critique the layer construction and architecture of a web map.
- Log in to the GeoServer administrator page and preview layers.
Checklist
- Read the Lesson 2 materials on this page.
- Complete the walkthrough.
- Complete the Lesson 2 assignment.
- Read the term project introduction and post your initial idea for the project in the Term Project Proposal drop box.
System architecture for web mapping
It can take several different physical machines to create, serve, and use a web map. These are often depicted in diagrams as separate levels, or tiers of architecture. In this course, you'll likely use just one machine to play all these roles; however, it's important to understand how the tiers fit together.
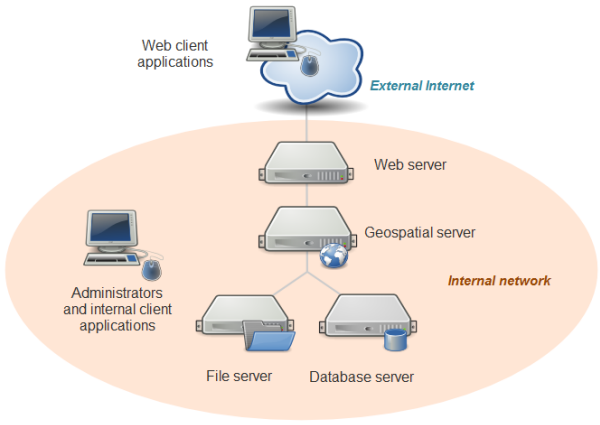
At the top is a drawing of a computer with the label: Web client applications. The computer image extends into a little cloud with the label: External Internet.
A line extends from the bottom of this cloud into a wide oval diagram with the label: Internal network. The line leads to the drawing of a Web server and then, below the Web server, to a Geospatial server. The line then branches to drawings of a file server (left) and a database server (right). To the left (within the Internal network oval) is another computer drawing with the label: Administrators and internal client applications.
For example, you might have:
- desktop workstations that are used by administrators and internal client applications. These machines will also be used to prepare data, author maps, and sometimes administer the other machines.
In this course, you will be using QGIS and some command line libraries such as GDAL to accomplish these tasks. GeoServer also has a web-browser-based administrator dashboard that you would use from this machine.
In some cases, your web map may be designed solely for the use of people within your organization and may never see the open web. In this scenario, client applications may also reside on these desktop workstation machines. - a database and/or file server holding all of your GIS data. This machine might be equipped with redundant storage mechanisms and regular backup scripts that prevent the loss of data.
In this course, you'll be using folders of shapefiles for some of the exercises. If you had decided to use a database like PostgreSQL or MariaDB, it would also go on this tier. - a geospatial web services server that has specialized software and processing power for drawing maps, responding to feature queries, and performing GIS analysis operations.
In this course, you will use GeoServer to host your web services. - a web server that acts as a web entry point into your organization's network. This is also called a proxy server. It is protected by firewalls that shield malicious traffic into your internal network. It's also a place where you can put web application code (such as HTML and JavaScript files) for your web maps.
In this course, you will just be using GeoServer on your local machine; therefore, you will not install separate web server software. GeoServer comes with an embedded “servlet” called Jetty that gives you a simple endpoint to your web services that you can locally access for testing. In a more formal setup where you wanted to reveal your GeoServer web services to the world, you would have a web server such as Apache that would forward requests to GeoServer.
In this course, you will put your web applications in your Jetty home folder (if the application uses GeoServer) or host them on Amazon's cloud storage (if your application does not use GeoServer). - many client applications that use the web map. These can be apps that run on your desktop workstation or they could be mobile apps. The clients may be based within your network, or you may allow them to come from outside your network. All clients must be able to make web requests through HTTP, and any client coming from outside your network must have an Internet connection.
This is the tier you usually have no control over; therefore, it's important to design for different browser versions, screen sizes, ambient lighting, and so forth.
In this course, you can use any modern web browser to test your apps and services. You can also use a mobile browser, such as Safari on the iPhone, to test the apps that you place on your personal webspace.
Again, when developing and testing a web map, you can certainly use a single physical machine to play all these roles. This is a common practice that keeps things simple and more economic. When you work for a “real world” company with its own network and are ready to deploy your web map, you will move your tested services and applications into a formal “production” environment where you have individual enterprise-grade machines for each role, as described above.
Elements of a web map
Building and using web maps is different from working with a desktop GIS for a variety of reasons:
- In a web map, any information you see has to be sent “across the wire” from the server to your browser, introducing latency.
- In a web map, you may be pulling in information from several different servers. Your map performance is therefore limited by the availability and speed of all the servers you're using.
- In a web map, performance may be affected by other people using the server at the same time.
- In a web map, you are limited to the display technologies supported by the client application, which may be a basic web browser.
These considerations can sometimes take people by surprise. For example, if you've only used ArcMap or QGIS in the past, you may not be accustomed to thinking about broadband speeds or sharing the machine with other people.
By far, the biggest challenge for new web mappers is understanding the amount of data that is displayed in their maps and how to get all that information drawn on the screen of a web user in sub-second speeds. Many people who have worked with desktop GIS packages are accustomed to adding dozens (or even hundreds) of layers to the map and switching them on and off as needed. Your powerful desktop machine may be able to handle the drawing of this kind of map; however, performance will be unacceptably slow if you try to move the map directly to the web. The server requires precious time to iterate through all those layers, retrieve the data, draw it, and send the image back to the client.
To address this problem, most web maps break apart the layers into groups that are handled very differently. Layers whose sole purpose are to provide geographic context are grouped together and brought into the map as a single tiled basemap. In contrast, thematic layers (the layers that are the focus of the map) are brought in as one or more separate web services and placed on top of the basemap. You might additionally decide to include a set of interactive elements such as popups, charts, analysis tools, and so forth.
Let's take a closer look at these three things--basemaps, thematic layers, and interactive elements--to understand how each is created and displayed.
Basemaps
A basemap provides geographic context for your map. In other words, it is usually not the main reason people look at your map, but your map would be difficult to interpret without it. The most common basemaps you've used online are vector road maps and remotely sensed imagery.
Although a basemap may consist of many sublayers (such as roads, lakes, buildings, and so forth), these are often fused together into a rasterized set of tiled images and treated as a single layer in your web map. These tiled maps consist of often thousands or millions of predrawn images that are saved on the server and passed out to web browsers as people pan around the map. Lesson 5 will explain tiled maps in greater depth and give you a chance to make your own.
In the past couple of years, it has become fashionable in some applications for the server to send the basemap as chunks of vector coordinates, sometimes known as "vector tiles." Displaying the basemap as vectors instead of a rasterized map allows for more flexibility in visualization, such as being able to rotate the map while the labels stay right-side-up. You can see a vector basemap in action if you look at the Google Maps app on a smartphone.
Sometimes two tiled layers will work together to form a basemap. For example, you may have a tiled layer with aerial imagery and a second tiled layer with a vector road overlay that has been designed to go on top of the imagery. (In Google Maps, this appears when you check the Labels item). Keeping these two tilesets separate takes less disk space and makes it easier to update the imagery.
Thematic layers
Thematic layers (also known as business or operational layers) go on top of the basemap. They're the reason people are coming to visit your map. If placed on the basemap, they might not be of interest to everybody, but when placed on your focused web map, they are the main layer of interest. If your map is titled “Farmers markets in Philadelphia,” then farmers markets are your thematic layer. If your map is titled “Migration patterns of North American birds,” then the migration patterns are your thematic layer.
Like basemaps, thematic layers are sometimes displayed with tiles; however, this may not always be possible due to the rapidly changing nature of some data. For example, if you need to display the real time positions of police vans, you cannot rely on predrawn tiles and must use some other way to draw the data. There are various web services such as WMS (which you will learn about in Lesson 4) that are designed to draw maps on the fly in this way. You can use these for your thematic layers. Another option is to query the server for all the data and use the browser to draw it. This approach lends itself well to interactive elements such as popups and is described in Lesson 6.
Thematic layers work together with basemap layers to form an effective web map. Interestingly, the thematic layer is not always the top one. In a 2009 blog post (no longer online), Esri cartographer Charlie Frye described a “map sandwich” approach, wherein a thematic layer (which could be tiled or not) is placed in between two tiled basemap layers that give geographic context. The bottom layer has physiographic features and the top layer has labels and boundaries. This is the “bread.” The thematic layer in the middle is the “meat.” The Esri "Light Gray Canvas" basemap in ArcMap and ArcGIS Online uses this technique. FOSS technology definitely allows this approach as well.
Your map may include several thematic layers that you allow users to toggle on and off. To accomplish this, you can use a single web service with multiple sublayers, or multiple web services that each contain a single layer. However, to keep your app usable and relatively fast-performing, you should avoid including many thematic layers in your web map.
Try this
- Open your browser's web developer tools you used during the previous lesson and open the Network tab; then visit Bing maps [2] on your computer's web browser.
- Pan around and switch between the basemaps (drop-down menu at the top right), and note the different web request URLs displayed in the table. These will appear quickly as you interact with the website.
- Click a row representing a request, and then click the Response tab to see what came back from the request. If you see an image (try a couple of the requests going to https://t.ssl.ak.dynamic.tiles.virtualearth.net [3] for this), it means the request sent back a tiled map image as a response. Other times you may see JSON and/or other text.
- Now turn on the thematic layer for Traffic.
How is Bing displaying these layers? Why are they taking this approach? At the end of this class, you will have a good understanding of the different options that exist and their advantages and disadvantages. Feel free to go ahead and check out HERE WeGo [4] in the same way (layer options can be accessed at the bottom right). You should notice a couple of similarities between the two web maps.
Interactive elements
Web maps are often equipped with interactive elements that can help you learn more about the layers in the map. These can be informational popups that appear when you click a feature, charts and graphs that are drawn in a separate part of the page, slider bars that adjust the time slice of data displayed in the map, and so forth. Some web maps allow you to edit GIS data in real time, or submit a geoprocessing job to the server and see the response drawn on the screen. Others allow you to type a series of stops and view driving directions between each.
These elements make the map come alive. The key to making an effective web map is to include the interactive elements that are most useful to your audience, without overwhelming them with options or making the tasks too complicated. Even a little bit of housekeeping, such as including user-friendly field aliases in your popups, can go a long way toward making your map approachable and useful.
Interactive elements are the part of your web map that require the most custom programming. The amount of interactivity you have the freedom to add may be strongly correlated with the amount of JavaScript programming that you know how to do. Open web mapping APIs such as OpenLayers and Leaflet provide convenient methods for doing some of the most common things, such as opening a popup.
Later in this lesson, you'll examine some web maps and discuss the interactive elements they provide. You'll also revisit this subject in Lesson 6 as you begin using the web mapping APIs to put all your layers together into a web map.
Getting some practice with identifying web map elements
Let's get some practice identifying these elements. I will walk you through two simple web maps and point out the basemap, the thematic layers, and the interactive elements. Then, in this week's assignment, you'll get the chance to try it yourself using two web maps of your choosing.
GDACS Disaster Alerts
The first map we'll look at is www.gdacs.org/ [7], published by the Global Disaster Alert and Coordination System (GDACS), a cooperation framework between the United Nations, the European Commission, and others to share disaster information and alerts. The web map on the main page showing alerts for the last four days is relatively simple in terms of interactive elements, focusing on displaying disaster related information and providing links to more detailed reports. This map has been created with OpenLayers. It is similar in scope to what you will be creating in this course. Take a minute to open this map and examine it.
- The map offers three different terrain-based basemap options serving as unintrusive backdrops for displaying the thematic layers. However, when you zoom in, you will see that at a certain zoom level the basemap changes to a typical road map version, similar to what you are familiar with from Google Maps, Bing, or OpenStreetMap. By inspecting the network traffic in the browser's network log while panning around and zooming, we can see that all these basemaps options are loaded as image tiles using URLs like this one:
https://gisco-services.ec.europa.eu/maps/tiles/NaturalEarth/EPSG3857/2/0/3.png
- The map has a larger number of thematic layers, most of them for displaying disasters of different types (fire, drought, flood, etc.) as icons/symbols on the map. When you zoom in, you will see that in addition to the icons there are actually vector features like polygons representing the events (including detailed past and predicted trajectories for cyclones). In addition, there are raster layers for rain and clouds. These two thematic layers are relatively easy to find in the browser's network log because they are also brought in as image tiles, in this case from a local ArcGIS Server installation using URLs like this one:
https://www.gdacs.org/arcgis/rest/services/GDACS/daily_rain/MapServer/export?F=image&FORMAT=PNG32&TRANSPARENT=true&SIZE=256%2C256&BBOX=-180%2C-90%2C-90%2C0&BBOXSR=4326&IMAGESR=4326&DPI=90
In contrast, to the previous URL for the basemap tiles, which used nested folders for zoom level, x and y coordinates of the tiles, we here find bounding box coordinates and other information encoded as arguments following the '?' which are then decoded by the server and used to produce the requested tile image. How about the other thematic layers? It turns out these do not come as images but fortunately, they can still be identified relatively easily in the network log because the URLs for the requests contain abbreviations for the event types, like this:https://www.gdacs.org/gdacsapi/api/events/geteventlist/MAP?eventtypes=EQ
These requests are sent out immediately when the map is loaded, and the response from the GDACS server always is a GeoJSON file with a text specification of the vector features and their geometries. These vector features are then drawn by the web browser. You will learn more about client-side rendering of data from GeoJSON files in Lesson 7. - The interactive elements of the map are a couple of buttons for zooming (top left), for accessing the layer switch control and legend for the Rain layer (top right), and for displaying some general information and attribution (bottom right) confirming that OpenStreetMap data has been used to create the map. Clicking on a symbol from one of the thematic layers will open a popup with information on the event and a link to the full report. When you add interactive elements to your web maps, you will often add code that "listens" for particular events, such as clicking, tapping, or hovering over a feature.
NYC Crime Map
The second map is a web map at https://maps.nyc.gov/crime/ [8] showing the concentration of crimes of different types for New York City. The map is entirely based on services provided by ESRI. The map is created in Javascript using ESRI's ArcGIS Javascript API and some other Javascript libraries for the general layout of the page such as Dojo..
- The basemap is tiled and the tiles are loaded from an arcgis.com using URLs of the following form:
https://tiles.arcgis.com/tiles/yG5s3afENB5iO9fj/arcgis/rest/services/NYC_Basemap/VectorTileServer/tile/14/6161/4830.pbf
Similar to the previous web map example, the tiles are stored on the server in some folder/file organization with numbers referring to the zoom level (.../14/...), x grid coordinate (.../6161/...), and y grid coordiante (.../4830.pbf). However, one important difference is that these are not image tiles. They are vector tiles using the .pbf vector tile format in which the content of the tile is specified as vector data that then still needs to be rendered by the web map application running in the browser when the .pbf file is received. Therefore, we don't get to see an image in the Preview of the browser's Developer Tools but rather some cryptic text because the .pbf file stores the vector data in binary format. Looking at the map itself, we can see that these basemap vector tiles are rendred using a light non-intrusive design. - There are two types of thematic layers that you can switch between under "Layers" at the top right. The polygon based , choropleth-style "Crimes by police precinct" layer and the point based "Crimes by location" layer that uses a cluster rendering approach with clusters of points represented by circles that then get split up when you zoom in further. These layers are also brought in as vector data and then rendered by the browser. Here is one example URL:
https://services6.arcgis.com/yG5s3afENB5iO9fj/arcgis/rest/services/NYC_Crime_Locations_PROD_view/FeatureServer/0/query?f=pbf&cacheHint=true&maxRecordCountFactor=4&resultOffset=8000&resultRecordCount=8000&where=1%3D1&orderByFields=OBJECTID&outFields=OBJECTID&outSR=102100&spatialRel=esriSpatialRelIntersects
We see that the data is coming from arcgis.com as well. We don't have to worry about the details of these requests for now but note how the details of what exactly is requested are encoded in the URL using different parameters separated by & symbols. - In addition to the standard map controls and the controls for choosing the layer and different information to be displayed in the area directly to the right of the map, the interactive elements of the web map allow for filtering the data presented in the thematic layers based on crime type and a date range. Clicking on one of the thematic features from either layer, will display more detailed information about that feature using visually appealing tables and interactive plots. You can also search for a particular location.
Other maps
Here are a few other maps you can look at if you want to keep practicing. Although some of these maps have very nice elements, I am recommending them for their variety, not for their excellence in any particular realm.
- TriMet Trip Ride Planner [10]
- Downtown Alliance Interactive Map New York [11] (click on Open Map View at the bottom right)
- NIU Campus Webmap [12]
From this brief exercise, you can begin to see the various approaches that can be used to put together a web map. Hopefully, you can look at a web map and immediately begin to see how the layers were broken up into basemap layers and thematic layers. Whenever you see a web map, you should also think about the interactive elements that are present and decide whether they are usable and applicable.
Walkthrough: Setting up GeoServer
GeoServer is free and open source software (FOSS) that exposes your data as geospatial web services. You'll be using GeoServer later in this course and possibly in your term project if you choose. This week, we'll take some time to get GeoServer installed and configured. This is a detour from our discussion of web map elements, but you'll soon revisit that topic in the weekly assignment.
Again, the lesson materials provide instructions for Windows. You are welcome to install on another platform, but you are on your own for instructions and troubleshooting.
- If you do not already have Java 8 on your computer, visit the Java download page [13] and install the latest version of Java 8. Make note of the file system location where you install it. You will need this when you set up GeoServer. In case that a new Java version will be released during the course and your computer asks you whether it should install the update. Be warned that if you decide to do so, GeoServer may stop working until you adapt the Java path in the GeoServer startup .bat file. Also, it is important that this is a version of Java 8; GeoServer most likely won't run with Java 9 or higher.
- Visit the GeoServer home page at www.geoserver.org [14] and click the Download link. From here you can download different versions of GeoServer including the most current stable and maintenance releases. You are free to check out these newer versions (it's pretty easy to work with multiple version of GeoServer on the same computer). If you want to play it safe and use the latest version we tested the course materials with, then follow the instructions in the next step to download version 2.19.6. The differences between these versions are minimal in the context of this class. If you decide to use a different version, make sure that you download the "Platform Independent Binary".
- To download GeoServer 2.19.6, click on this direct link [15] to start the download of the "Platform Independent Binary" from SourceForge.
- After the download has finished, you will have a .zip file called geoserver-x-y-z-bin.zip on your computer. Extract the content of this file to a new subfolder somewhere on your computer where you have read/write access, for instance in your user's home directory. The result should look similar to the screenshot below.
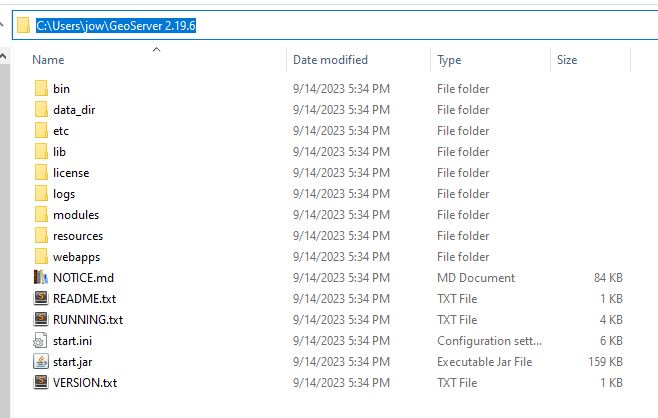 Figure 2.1b GeoServer installation folder after extracting the .zip file.
 - Now look in the subfolder called "bin". There you will find two .bat files for starting and shutting down GeoServer on Windows. These scripts will look for three important environment variables on your system: JAVA_HOME, GEOSERVER_HOME, and GEOSERVER_DATA_DIR. JAVA_HOME should point to your Java installation from step 1 above and should be set automatically. The other two need to refer to the new folder to which you just extracted the GeoServer file tree and to the subfolder called data_dir in it, which is meant for storing the spatial and other data to use with GeoServer. We could now go to the Windows Settings and define these environmental variables there, but instead we are going to define them in the script files themselves. This way, there won't be any issues with older GeoServer installations you may already have on your computer, and you will be able to simply delete the GeoServer folder at the end of the class if you want. So please open the file "startup.bat" in a text editor (make sure it is startup.bat, not startup.sh!) and add the following two lines at the very beginning. Adapt the path to the right of the equal sign in the first line to refer to your GeoServer folder.
set GEOSERVER_HOME=C:\Users\jow\GeoServer 2.19.6
set GEOSERVER_DATA_DIR=%GEOSERVER_HOME%\data_dir
Now do the same for the file called "shutdown.bat". - Now double-click startup.bat to start Geoserver.
You'll see a bunch of status messages appearing in a black and white console, like the following.
Wait a second for the messages to stop appearing, then go on to the next step. (If you keep this window open, you'll see messages appear as you interact with GeoServer. This is okay, and may even help you with troubleshooting.)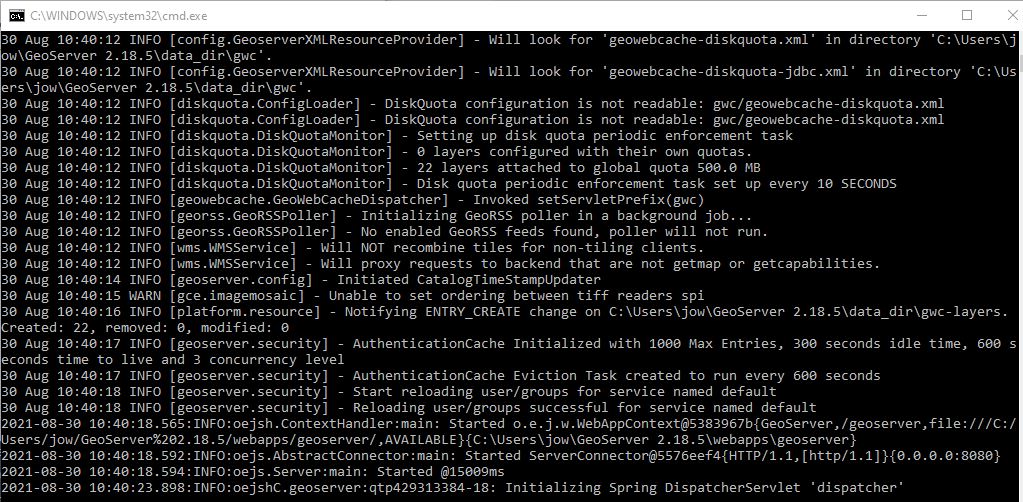 Figure 2.2 Status messages during GeoServer startup.
If you get a Windows Security Alert that Windows Firewall has blocked some features of the program, check the top box to allow it to run on private networks and click Allow access. Uncheck the bottom box, as public access will not be needed in this course. - Next, go to your browser and enter the address localhost:8080/geoserver/web.
This is a web page that you can use to administer GeoServer from this or any other computer in your network. You might be wondering, "How did my machine get the ability to serve out web pages?" This is possible because GeoServer includes a servlet [17] called Jetty, which allows your machine to respond to web service and web page requests without having a full-blown web server software package installed.
In an enterprise environment, you would install GeoServer onto your existing web server such as Apache Tomcat, and it is very possible that you will need to do this sometime in the future. The process is straightforward enough that I was able to do it following this instructional YouTube video [18] even though the video is not in English; however, for the assignments in this class, please use the Jetty server and only attempt the Tomcat install if Jetty is not working. My intent is to keep everyone on as close to the same environment as possible, so that I can be more helpful with troubleshooting if needed. - Log into GeoServer by using the username admin and the password geoserver in the upper boxes and click Login. These are the default username and password for the administrator account. You must use this the first time you log in.
You will see a welcome page similar to the following:
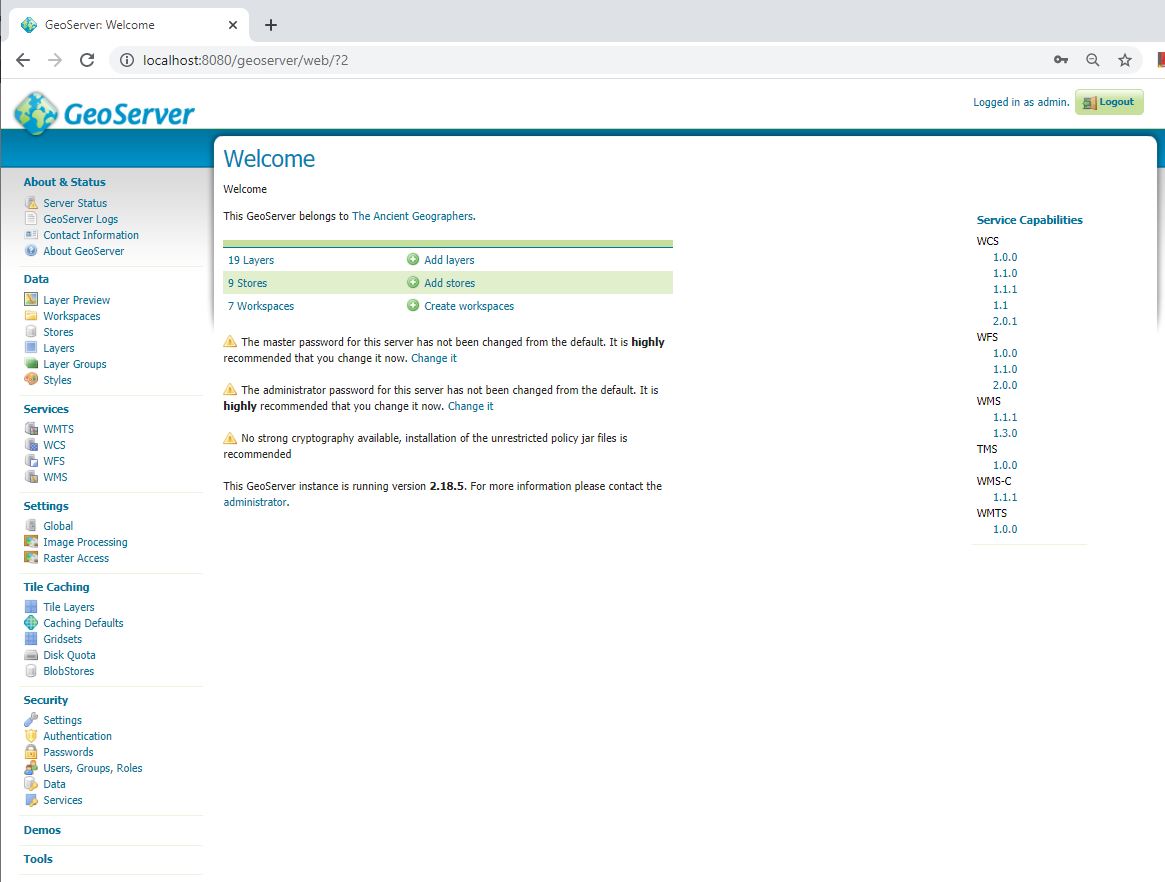 Figure 2.3 Geoserver startup webpage
 - Rather than working with files that represent an entire map, like .mxd or .qgs, GeoServer works with the concept of layers and layer groups. You define a set of datasets that you want to have exposed on your server, and then you define what characteristics they'll exhibit when brought into web maps as web service layers.
GeoServer comes with a bunch of sample layers already loaded. Let's take a look at those. - In the left-hand menu, click Layer Preview.
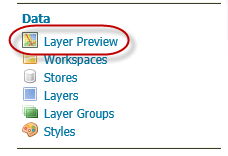 Figure 2.4 Layer Preview
 - Scroll down to the Tasmania state boundaries layer and click the OpenLayers link.
This displays your map as a web service that you can navigate. The web service was delivered through the Open Geospatial Consortium (OGC) Web Map Service (WMS) specification, an openly documented way of serving web maps that you'll learn more about in Lesson 4. The map frame and navigation buttons were created through the OpenLayers JavaScript framework.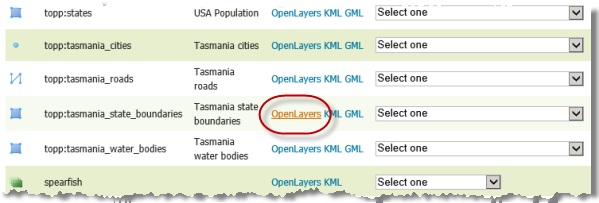 Figure 2.5 Find Tasmania in the list of layers
It's important to understand that you also could have done this by clicking the dropdown list and choosing WMS > OpenLayers 3 (or just OpenLayers on older versions of GeoSever). Looking at this list, you get a better idea of the many different output formats supported by GeoServer.Let's try one of these other options.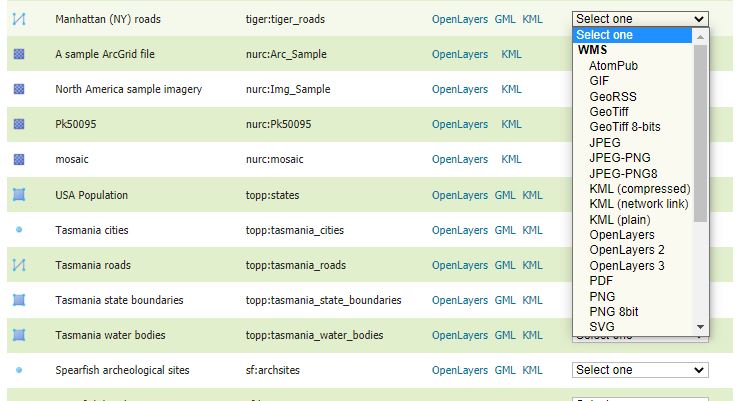 Figure 2.6 OpenLayers selection in GeoServer
 - Close the map preview window and return to the GeoServer layer preview list. This time, click the KML link to get the layer as KML and XML-based open specification for geographic data, often used by Google. If you have Google Earth installed, the layer should open there. If you don't have Google Earth, you can open the downloaded .kml file in Notepad and just examine the raw KML.
In addition to requesting many layer formats, you can request groups of layers together if they have been configured as a group layer. GeoServer comes with a few preconfigured group layers. - In the GeoServer layer preview list, scroll down to the Tasmania group layer (symbolized by green squares). Using the techniques you have learned, preview this in OpenLayers.
Here, you see three layers that have been delivered together as one map.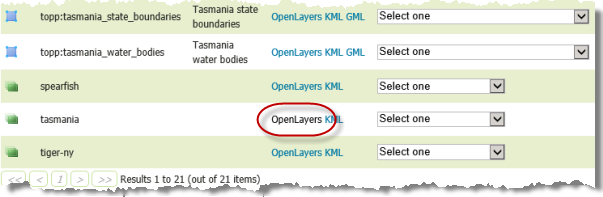 Figure 2.7 Layer preview in GeoServer
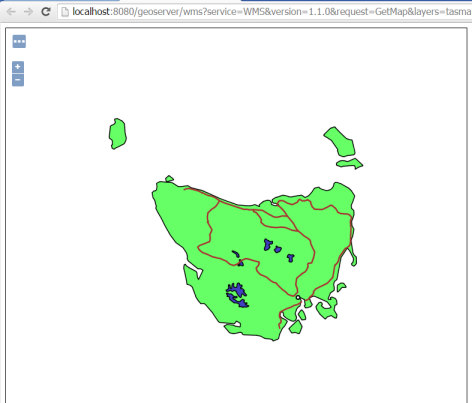 Figure 2.8 Preview of Tasmania from GeoServer
You'll return to GeoServer later in this course. This walkthrough just ensures you have it up and running correctly. If technical difficulties prevented you from getting to this point, please alert your instructor.
Lesson 2 assignment: Analyze two web maps
For this week's assignment, find two web maps "in the wild" and create a post on the "Lesson 2 assignment forum" on Canvas that describes the following for each map:
- The web address (URL) of the map and who created it.
- The basemap, thematic layers, and interactive elements in the map.
- The servers and display techniques used for each layer (tiles, image drawn by the server on the fly, browser-drawn vector graphics, etc.). Use your web browser's developer tools/plugins to figure this out. For example, using the Network tab of the developer tools while you pan around the map, you might determine that your web map is pulling in a tiled basemap from CloudMade.com. This is enough for the assignment; you don't have to go into further technical details about how the tiles were made or their file structure.
- The software and programming framework used to build the web map (if you can determine this) and whether it is proprietary or FOSS.
- Suggestions on how the map administrator could make this map more useful or faster performing.
Please make an effort to find these maps on your own. In other words, do not choose any of the web maps previously referenced in this lesson, nor should you browse through other students' posts in order to find maps to analyze. Except for the first point (URL), please use short paragraphs to address the different points in your description similar to what you saw in this lesson, not just bullet point enumerations.
If you are having difficulties analyzing your web map, please refer back to the section "Elements of a web map" and the examples and techniques using your browser's developer tool described there. If you check out the requests in the Network log, requests for images drawn by a server will be relatively easy to identify because the individual images sent back to the browser as a response will be image files in one of the typical image formats (.png, .jpg, etc.). You will be able to see images under 'Preview' of the Network tab. Looking at the preview images will allow you to identify which layers are included, e.g. is it just the basemap, just one thematic layer, or maybe basemap and thematic layer combined. Then the last question is whether these images are tiles, so are multiple images requested and then put together to cover the entire area of the map you are seeing, or is it always just a single image covering the entire map area (something that, for instance, you can experience with a WMS service where the browser tells the server the extent of the area covered by the map, the server then renders an image for that area and sends it back to the browser).
With requests for vector data that that is then rendered by the browser, things are more difficult. The vector data sent by the browser can come in a variety of formats (.json and .pbf are common ones) and is often in a binary format or in some other way compressed, in which case there is no direct way to check out what exactly the files contain. So if you come to the conclusion that some of the data for your map is not coming in as images, that's goood enough for this assignment. If you are able to identify some candidate requests in the network, you should mention that and the server these are going to, but in some cases even that can be difficult, e.g. when the vector data is just stored in a local file on the same web server that is hosting the page with the map.
Term project introduction
This course contains many walkthroughs showing how to use FOSS, but the ultimate objective is to apply these skills toward your own web map using data that's interesting to you (or your supervisor at work!). As the course progresses, you'll be expected to complete a portion of the weekly assignments using your own datasets. By the end of the course, this will become a fully functioning "term project" web map that combines base layers, thematic layers, and some degree of interactivity through popups, filters, or queries.
Part of the final week of the course is reserved for putting the finishing touches on your term project; however, most of the major pieces will be in place by that time if you put a respectable effort into the weekly walkthroughs and assignments.
Proposing an idea for the term project
Please do the following to get started with the term project:
- Skim through the upcoming lesson pages and titles to get an idea for the functionality that will be covered in this course. This will help you choose a project that is within scope.
- Read the Term project submission guidelines [19] to see what you will be required to submit
- Create a 1 - 2 paragraph write-up describing an idea for your term project. This should mention the basemaps, thematic layers, and interactive elements that you'd like to have in your project, along with an explanation of where you will get the data. Place this in the Term Project Proposal drop box on Canvas, which you can find by going "Modules tab" -> "Lesson 2" -> "Term project proposal drop box". We will reply within a week, commenting on the scope and appropriateness of the project.