Lesson 6: Putting layers together with a web mapping API
The links below provide an outline of the material for this lesson. Be sure to carefully read through the entire lesson before returning to Canvas to submit your assignments.
Note: You can print the entire lesson by clicking on the "Print" link above.
Overview
Note: Currently, this lesson teaches the Leaflet API. If you are looking for the earlier materials on OpenLayers, see the Lesson 6 archive page [1].
So far, you've been able to create several different types of layers, such as a dynamically-served web map service (WMS) and a static tiled web map. You've previewed these layers in various ways, but have probably come to the conclusion that they're not very useful or easy to share using these preview mechanisms. You will learn how to create more types of layers in future lessons, but, for now, we are going to pause for a week and learn how you can program a web application that combines your layers, creating an easily shareable "front end" for your web maps. You will learn what the Leaflet API is and how to use it for this purpose. It's impossible to learn Leaflet in a single week (or even in a single course), so, in this lesson, you'll just get a taste of the basics. Future lessons continue to use the Leaflet and expand on the knowledge you gain this week.
If you are new to web programming, it is recommended that you take some time to review the W3Schools HTML [2] and JavaScript [3] tutorials that you studied during orientation week. You don't need to know everything, but you do need to be familiar enough with the code and markup patterns that you can interpret most of what you are seeing when you view the examples later in the lesson. The prerequisite for this course is prior familiarity with at least one programming language, and it is expected in this lesson that you apply this familiarity to understanding the JavaScript syntax for loops, functions, decision structures, and so forth. Exerting a little extra time and effort, you should be able to see how JavaScript relates to the language(s) that you already know.
Objectives
- Identify commonly-used web mapping APIs (both proprietary and FOSS) and recognize programming patterns that are common to each.
- Choose developer examples that relate to your web mapping task and adjust the code to meet the needs of your own application.
- Use Leaflet to create a mashup from a tiled basemap and a WMS thematic layer.
- Create informational popups for your web map features using Leaflet.
Checklist
- Read the Lesson 6 materials on this page.
- Complete the walkthrough.
- Complete the Lesson 6 assignment (note that it has two distinct deliverables).
- Complete the "second quiz" on Canvas. This covers material from Lessons 4 - 6.
What is a web mapping API?
An API (application programming interface) is a framework that you can use to write a program. It provides a set of classes and functions that help you avoid writing all the low-level code to perform specific actions. For example, web mapping APIs typically include classes for maps and layers so that you don't have to write all the low-level code for displaying an interactive map image and drawing a new layer on it. Instead, you can just create a new map object, create a new layer object, and call some method such as layer.addTo(map). The API abstracts the complexity of the task and makes it easy for you to focus on the mapping aspects of your application, rather than spending time on the low-level logistics.
You've probably heard of general purpose APIs such as Java and the Microsoft .NET Framework that can be used to write all kinds of programs on desktop, web, and mobile platforms. There are also more specialized APIs built around certain products and functionalities. For example, you may have heard of Google App Engine, Amazon Web Services, and Microsoft Windows Azure that are designed for proprietary cloud computing environments.
APIs designed specifically for the purpose of making web maps include OpenLayers, Leaflet, the Google Maps API, and the ArcGIS API for JavaScript. The latter two are even more specific in that they are designed around particular proprietary platforms. This lesson introduces some of the different APIs and application development approaches, then gets into detail on how to use the Leaflet API.
Be aware that an API is not a programming language; rather, it is a set of building blocks that you invoke using a language. Some APIs are supported for use with multiple programming languages and other APIs are tied to one specific language. For example, there is both a language and an API named Java. The Java language is used to work with the Java API (and other APIs). In contrast, the .NET Framework is solely an API; there is no language called .NET. Applications using the .NET Framework are typically programmed using the C# or Visual Basic languages.
Choosing a web mapping API
When you set out to create a web map, one of the most important choices you will make is which API to use. If your application is large in scope with many clients, this one decision can affect your professional activities and trajectory for years. How can you select an API that will be the best fit for your requirements and skill set?
The selection of an API is often tightly coupled with the decision of a platform and programming language. These two factors affect the APIs available to you. For example, if you know that your application is required to run on Android tablets, you first need to decide whether you are going to build a full-fledged native app (in other words, one that is available in Google Play and has access to the device hardware such as the camera) or one that simply runs in a web browser on the Android tablet. Developing a native app most likely means that you'll be using Java, while developing a browser-based app allows more flexibility and can be done with JavaScript and HTML, perhaps employing an API that's designed to be mobile-friendly (in other words, it supports touch gestures, resizes to device width, and so forth).
From this example, you can probably also tell that it's important to consider which languages and platforms your developers are familiar with. If you have people on staff who know Java or Objective C, your options increase for developing native mobile apps. However, knowledge of HTML and JavaScript is usually sufficient to build browser-based apps. Most FOSS APIs for web mapping are geared toward an HTML and JavaScript approach, so this is what we'll focus on in Geog 585.
Examples of FOSS web mapping APIs
Below are some examples of FOSS web mapping APIs for building browser-based apps with HTML and JavaScript.
OpenLayers
OpenLayers [4] is a mature and richly featured JavaScript API for building web map applications. It has an extensive collection of documentation and samples, although some of the materials can be difficult for beginners to grasp. One of the nicest things about OpenLayers is the large developer community using the API. This community has created a mass of tips and examples on forums such as GIS Stack Exchange [5]. Although OpenLayers is not as approachable for beginners as some of the other APIs, its accumulation of online help resources, and its support for many layer types from both FOSS and commercial sources offer some advantage over other APIs. In 2014, OpenLayers 3 was released which was a major step because it was a complete rewrite of the library not compatible with the OpenLayers 2 branch anymore. In contrast, the current version OpenLayers 7 is still backwards compatible to previous versions of OpenLayers 3. If you feel comfortable with JavaScript and Leaflet after this lesson and decide you would like to use OpenLayers for your final project, you are welcome to go ahead, keeping in mind its strengths and weaknesses.
Leaflet
Leaflet [6] is a younger FOSS web mapping API that is designed to be lightweight, mobile-friendly, and easy to get started with. It has become extremely popular over the last years (one reason why we are now teaching it in this course), and quite a few companies, such as Mapbox, use it as a basis for their own APIs. Leaflet places heavy emphasis on the use of tiled maps and client-side vector graphics drawn from sources such as GeoJSON (you will learn more about the latter in the next lesson). For basic maps that use these layer types, Leaflet is an excellent choice that has already endeared itself to many GIS developers.
Leaflet contains a full API reference but only a handful of full working examples compared to OpenLayers. Going beyond the examples can be tricky for beginners; however, the simplicity of the API lends itself well to learning on the fly.
D3
D3 [7] is a FOSS data visualization library that is frequently used for charting, but also contains many map examples. It binds data elements to the page's document object model (DOM), allowing for interesting and flexible data animations and transitions. Although it has a steeper learning curve for newbies, D3 is a nice option for composing a web app with interactive maps and charts. It also offers examples for using non-Mercator projections [8].
Polymaps
Polymaps [9]is a simple FOSS mapping API primarily designed for mashing up map tiles with vector features drawn from GeoJSON and other sources. However, it seems like it is not under active development anymore, even though we have not seen an official announcement in this regard. Unfortunately, the developer examples on their web site also stopped working recently so that you can currently not see the map examples showing how Polymaps can transform and overlay a raster image [10] onto an existing tile set and demonstrating Polymap's unique ability to generalize a large set of points on the fly using k-means clustering [11].
ModestMaps
ModestMaps [12] is a lightweight FOSS API for displaying tiled maps. By design, it lacks a lot of the functionality of the other APIs mentioned above. Running JavaScript code requires transferring that code to the browser. Why load hundreds of functions if you know that you just want to display a map? Unfortunately, similarly to Polymaps, the web map examples on their pages don't seem to work anymore.
Examples of proprietary web mapping APIs
Several proprietary web mapping APIs created by commercial software companies have become very popular. In this context, "proprietary" means that the API's source code cannot be downloaded and/or is not permitted to be modified and/or cannot be deployed without paying a royalty.
I include this section on proprietary options because you will hear about them all the time, many are free to use (under various conditions), and some of them will work with the types of layers we're using in this course. Just be aware that proprietary APIs may be oriented toward the purchase of a particular product or service and may cost money if you deploy them for monetary benefit or if they incur enormous amounts of traffic. Always check the API's license agreement before you deploy any application on a server outside your own development machine.
Google Maps and Bing Maps APIs
The Google Maps API [13] part of the Google Maps Platform [14] gives developers the opportunity to overlay their own data on top of tiled map layers from Google Maps. The overlaid data is typically supplied through KML files, and is displayed as interactive vector graphics drawn on the client side. These graphics can be restyled by the developer to use custom marker symbols, and can be bound to popups or tables to show additional information on a mouse click.
Perhaps the biggest advantage of the Google Maps API is that it brings the look and feel of Google Maps to an application. Many Internet users have experience with Google Maps and may feel more comfortable when they see the Google Maps navigation control or map style, even when this is embedded in an unfamiliar third-party application. The Google Maps API is arguably no more robust or easier to use than some of the FOSS APIs described above; however, it is thoroughly documented and offers a large developer community.
In July 2018, Google Maps adopted a pay-as-you-go model wherein, all customers get $200/month of credit and must pay fees for service usage beyond this amount. Under their pricing plan at the time of this writing, that is enough to cover 100,000 static map views or 28,500 dynamic map views. See this page [15] for the most up-to-date information on Google's Pricing and Plans.
Microsoft's Bing Maps [16], another large commercial maps provider, offers APIs for web and mobile applications that are similar in scope to Google's. Bing Maps offers a free usage tier along with volume-based pricing for enterprises (see details here [17]). One difference from Google is that the Bing Maps API places less emphasis on KML usage, since Google popularized the KML format and is a primary platform used to create KML files.
The Google and Bing mapping APIs are a popular choices among developers of place-finder applications that display real estate listings [18], businesses [19], churches [20], etc. However, some sites are beginning to adopt FOSS alternatives. For example, Craigslist [21] has adopted a Leaflet + OpenStreetMap approach when showing the results of real estate searches.
ArcGIS APIs
Esri has created APIs for building both web apps and native mobile apps, some of which are relatively rich in function compared to the Google Maps API and many of the FOSS APIs. The ArcGIS API for JavaScript [22] is one of the most fully featured and actively developed of these APIs.
The ArcGIS APIs are primarily designed to work with web services that you have published using ArcGIS Online [23] and ArcGIS Enterprise [24] (comprised of ArcGIS Server [25] and Portal for ArcGIS [26]). However, some of the APIs can also display OGC services, KML, and generic tiled map services (such as the one we built with QGIS). One of the more distinguishing advantages of the APIs is their ability to tap into web services originating from ArcToolbox that perform geoprocessing on the server. This is an area where FOSS solutions lack an equivalent GUI experience (see the section on WPS services in Lesson 8).
The APIs are free to use for development or educational use, but require a fee if you are selling the application or embedding advertising within it. Published here are Esri's terms of use [27].
If you are interested in learning the Google Maps API and/or the ArcGIS API for JavaScript, the Penn State course materials for Geog 863 [28] provide an excellent place to get started.
Other web mapping APIs
A multitude of other free and proprietary APIs have appeared over the years for doing pretty much the same things as the ones listed above. Some of them, such as Mapbox-GL.js [29] (previously Mapbox.js [30]) and the CARTO Maps API [31], are associated with cloud-based mapping and location services. Please take a detour to read this GIS Stack Exchange post [32] describing available web mapping APIs. You will refer back to the post when you complete this week's assignment.
Programming patterns with web mapping APIs
If you distinguish yourself within your organization as a person who can develop web maps, it's likely you'll eventually be called upon to use more than just one of the APIs described in the previous section. As noted, project circumstances and requirements can force the selection of different APIs for differing endeavors. As a programmer, it's important to understand the general structures, patterns, and architectures behind the APIs and languages you use, so that you can learn new ones on the fly. Technology is always changing, and you will limit your utility if you tie yourself to a single development mode.
The following section describes some patterns and features that are held in common among many (but not all) of the web mapping APIs described earlier. I include this section before diving into Leaflet, so that you get an idea of what things are not unique to Leaflet when we begin looking at the code. However, I also include example snippets to show how the concept is implemented in Leaflet.
Nearly all pages that use web mapping APIs include the following:
References to JavaScript files and stylesheets
Before you can get off the ground, your HTML page needs to include a <script> tag pointing at the web mapping API's JavaScript files. Be aware that the more JavaScript you are referencing, the longer it will take to load your page. Some APIs are slimmer than others (hence a name like ModestMaps) but may offer fewer features. When adopting one of the larger APIs, like OpenLayers, some developers build and reference their own smaller version of the API that contains just the functions they want to offer.
There are a couple of ways to reference the API. One approach is to download and host the API on your own server, thus minimizing load times and allowing you to customize the API. The second approach is to reference the API on someone else's server. Sites called content delivery networks (CDNs) specialize in hosting commonly-referenced APIs. This is what a CDN URL looks like for Leaflet, referenced within a script tag within the page head:
<script src="https://cdnjs.cloudflare.com/ajax/libs/leaflet/1.2.0/leaflet.js"></script>
In this course, we'll reference Leaflet through the CloudFlare CDN in this manner, for simplicity. This requires you to maintain an Internet connection while you are testing your code. Be aware that if you were developing an internal application, needed full control over the APIs hardware, or needed to customize the API in any way, you would need to download and host the API yourself.
Many web mapping APIs offer some stylesheets that can get you started with making nice-looking applications. You can reference these stylesheets in the form of CSS files, either by hosting them on your own server or using a CDN. You can bring a Leaflet stylesheet into your page from the CloudFlare CDN within the head using syntax like this:
<link rel="stylesheet" href="https://cdnjs.cloudflare.com/ajax/libs/leaflet/1.2.0/leaflet.css" type="text/css" crossorigin="">
The map div and object
When you want to put a map in your page, you will typically carve out some space using an HTML <div> tag. You then create a map object using the API and relate it to your div.
For example, with Leaflet, you can create a map div like this in the body of your page.
<div id="mapid"></div>
Elsewhere in your page, in your JavaScript code, you can create a Leaftlet Map [33] object and relate it to the div. The L.map constructor takes the div name as an argument (L stands for the Leaflet library here).
var myMap;
myMap = new L.map('mapid');
The map contains methods for getting the current layer set, centering the map, zooming to given coordinates, and so forth. In many web mapping APIs, the map is one of the most powerful objects. Whenever you adopt a new mapping API, take a look at the reference documentation for the map object to understand what it can do and the syntax for invoking the most common methods.
Layer objects
Most web mapping APIs provide ways to define layer objects, which you add to the map object one by one to create your mashup. It is very important to note that a layer, in this sense, could represent a web service such as a WMS or tiled service that itself contains many underlying data layers. However, you would only need one layer object to bring this type of web service into your map. Other layer objects that reference single data files, such as KML or GeoJSON, are simpler to conceptualize.
In many web mapping APIs, the layer is an abstract (or "base") class offering a set of common properties, and is exposed to the developer only through more specific classes. Take a look at the methods and events offered in Leaftlet's Layer [34] base class. These include methods to add and remove the layer from the map and manage elements like popups and tooltips. Now look at the properties of some of the more specific derived classes such as TileLayer [35], WMS [36], and GeoJSON [37] to see some of the more specific methods associated with these layer types. You will typically be working with the API help documents at this lower level; however, it is important to remember that you still have all the properties and methods of the Layer class available to you whenever you use any of these specialized layer types.
When you create a new layer in Leaflet, you're generally expected to provide the URL or file path containing the source data for the layer. The layer will not show up on the map until you call its addTo(...) method. Adapted from the Leaflet documentation, here's one way you could create a layer referencing a WMS and add it onto your basemap:
var nexrad = L.tileLayer.wms("http://mesonet.agron.iastate.edu/cgi-bin/wms/nexrad/n0r.cgi", {
    layers: 'nexrad-n0r-900913',
    format: 'image/png',
    transparent: true,
    attribution: "Weather data © 2012 IEM Nexrad"
});

nexrad.addTo(myMap);
Don't worry if the meaning of all the parameters above is not immediately apparent. The important thing is to recognize that the layer required you to supply a URL before it could recognize the WMS. You were also able to toggle a transparency option and supply attribution text for the layer.
If you call the addTo(...) method on some other layer, it will be placed on top of the first layer.
Many types of tiled layers include the tile zoom level, row, and column number in each URL. When you create these layers in Leaflet, it would not make sense to supply a specific URL, since this would only point to one tile. Instead, you supply a general format using {x}, {y}, and {z} for the column, row, and zoom levels, respectively. This is sort of like what you did when you added your tiles to the ArcGIS Online map viewer in the previous lesson.
// create and add OpenStreetMap tile layer
var osm = L.tileLayer('http://{s}.tile.openstreetmap.org/{z}/{x}/{y}.png', {
maxZoom: 19,
attribution: '© <a href="http://www.openstreetmap.org/copyright">OpenStreetMap</a>'
});
osm.addTo(map);Layer styling mechanisms
Layers that come already drawn by the server, such as tiled maps and WMS images, already have styling applied, but for layers drawn by the browser such as GeoJSON or GeoRSS, you must define how the layer will be styled. Web mapping APIs typically offer a group of properties that you can set on a layer like this to define how the browser should draw it. These properties include things like fill width, fill color, outline width, outline color, and so forth. In Leaflet, it's common to define styles as functions that can then be referenced in the layer constructor, like so:
function parkStyle(feature) {
    return {
        fillColor: '#FF00FF',
        fillOpacity: 1,
        color: '#B04173',
    };
}

var gardenLayer = new L.GeoJSON.AJAX('gardens.geojson', {
    style: parkStyle
});

gardenLayer.addTo(map);
The style function returns a set of style properties (fillColor, fillOpacity, and color in this case) that will be applied when drawing the features from the layer. In this simple case, all features will look exactly the same. However, since the style function has the feature to be drawn as a parameter (function parameter feature), we can use properties of the feature to calculate its style property values. e.g., to have all features colored differently based on one of their attributes. You will learn how to do this later on in this course.
Many APIs allow you to use a custom image for a marker, rather than placing a simple dot. The Leaflet example below shows how you could add a GeoJSON layer of grocery stores to your map and style it with a shopping cart icon saved in an SVG (scalable vector graphics) file called grocery.svg. This could just as easily be a PNG file or other rasterized image type.
// create icons for supermarkets
var groceryIcon = L.icon({
    iconUrl: 'grocery.svg',
    iconSize: [20,20]
});

// create a vector layer of grocery stores from GeoJSON data
var groceryLayer = new L.GeoJSON.AJAX('supermarkets.geojson',{
    pointToLayer: function (feature, latlng) {
        return L.marker(latlng, {icon: groceryIcon});
    }
});

groceryLayer.addTo(map);
The result might look something like this when put on top of a basemap layer:
Don't worry if all the code above is not completely clear to you yet. Just make sure you can see where the style is being defined via a JavaScript object. In Lesson 7, you will get some more exposure to GeoJSON and styling browser-drawn graphics.
Events and interactive elements
Web mapping APIs offer interactive elements that help your map become more than just a static picture on an HTML page. The map and layer objects described above typically allow you to run code in response to certain user actions, such as clicking the mouse. The user action is called an event (or firing an event). The code you run in response is called the event handler, and it typically goes into its own function block of code. Sometimes the event can supply arguments to the handler function via an "event object" containing properties of the event, such as the screen coordinates of the mouse click that fired the event.
For example, you might instruct the map to "listen" for a mouse click event. You could then write a handler function that takes the screen coordinates of the event argument (in other words, the coordinates of the clicked pixel) and converts them to map coordinates, then writes the coordinates into a label in the HTML page so they can be seen by the user. An even greater measure of interactivity could be achieved by wiring up this handler function to a hover event, instead of a click. You would then get the effect of always seeing the coordinates of your mouse as you moved it around the screen.
Web map users often want to obtain more detailed information about specific features in the map. It is very common to handle a click event by showing a popup window with more information about the clicked feature; so common, in fact, that many web APIs have special classes and methods for popups that don't require you to write the typical amount of event listening logic. You will learn more about popups in Leaflet in future lessons in this course.
Sometimes popups are too limited in space or complexity for the content you want to show. Even if your mapping API allows you to cram large images or tabbed interfaces into a popup, it often makes more sense to show this type of content in an HTML div elsewhere on the page. Web mapping APIs allow you to perform queries on a clicked point and retrieve attribute information from the clicked features (often as part of a handler function like the ones mentioned above). You can then do anything you want with this handler function in order to display the information in HTML. You might even pass the information to a different specialized API that draws charts, queries Wikipedia, finds nearby homes for sale, and so forth.
Another common piece of desired interactivity is the ability to switch layers off and on. Remember that in this sense, a "layer" is an entire web service. It is obviously not possible to toggle the visibility of individual sublayers inside a tiled map because all the layers are "burned into" the tiled image. However, you could switch to a different tiled base map, or turn off a WMS or GeoJSON layer placed on top of it.
Leaflet offers a Layers Control [38] that acts like a table of contents for toggling visibility. You create your layers as usual, but instead of adding them to the map individually, you organize them in JavaScript objects for your base layers and overlays (thematic or business layers). Suppose you have two layer variables, grayscale and streets, representing tiled maps, and one layer variable cities representing a layer of city points. Again, from the Leaflet doc, here is how you can add the layer switching control with these defined as base layers and overlays:
var baseLayers = {
  "Grayscale": grayscale,
  "Streets": streets
};

var overlays = {
  "Cities": cities
};

L.control.layers(baseLayers, overlays).addTo(map);
Now that you are familiar with the different elements of a web mapping API and have seen how these are expressed in Leaflet, we'll move forward and take a look at some fully functioning examples.
Examining some Leaflet examples
Now that you have received an introduction to web mapping APIs and their basic elements, you need to start experimenting with one in order to make any more significant progress. The way you will learn Leaflet, and any other API, is by taking a look at its developer code samples, trying to run them, and experimenting with adjustments or tweaks to suit your fancy. Indeed, a strategy for building any web application is to find the combination of samples that best approximates what you want to do and then start experimenting with merging those samples, testing the functionality one piece at a time until you've met all your requirements.
In this spirit of exploration and experimentation, we are going to take some time to look through some of the Leaflet developer samples and other online supplementary materials such as developer forum posts. These are the kinds of resources that you'll be working with as you complete your final project and continue Leaflet development beyond this course. I want to make sure you can use and interpret them effectively.
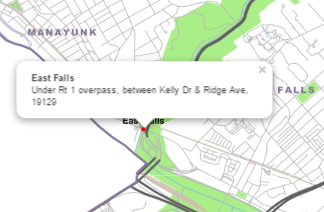
In the next section of the lessons, you'll complete a walkthrough where you put your PhillyBasemap tiles that you made with QGIS into the map, and then place a WMS on top of them. The user should be able to click a feature in the WMS and see a popup with basic information about that feature. The completed walkthrough will look something like this:
A good strategy when you approach a coding problem like this is to make a basic list of the things you'll need to figure out how to do. Then you can hunt for examples that show how to accomplish those tasks. In the above scenario, I can think of four key things you need to know how to do in order to get this to work.
- Add a tiled basemap to the map
- Add a WMS layer on top of the basemap
- Query a WMS layer on a mouse click
- Display the result in a popup
Now take a look through some of the following Leaflet examples and developer forum posts that could help you achieve this goal. Don't worry about writing the code yet; that will be covered in the walkthrough. For now, just get familiar with the code structure and patterns. Then the material will be somewhat familiar when it's time to complete the walkthrough.
Add a tiled basemap to the map
This is such a common task that you could go to the Leaflet Quick Start Guide [39] example. Indeed, this shows how to add a tiled basemap from Mapbox, using the L.tileLayer class:
L.tileLayer('https://api.tiles.mapbox.com/v4/{id}/{z}/{x}/{y}.png?access_token={accessToken}', ...)This is even more complex than you need, though, because the sample requires you to have a Mapbox access token and project ID. If you're just adding tiles hosted from your own server, you could adapt the simple code snippet from the L.tileLayer [40] API reference:
L.tileLayer('http://{s}.somedomain.com/{foo}/{z}/{x}/{y}.png', {foo: 'bar'});In this situation, foo just represents additional options you can apply to the tile layer. The important part is that you pass in a URL to your tiles with {x}, {y}, and {z} representing the column, row, and zoom level, respectively.
If you Google OpenStreetMap in Leaflet example, you'll find helpful sample code on the Getting Started with Leaflet [41] page that adds OpenStreetMap as a tiled basemap.
// set up the map
map = new L.Map('map');

// create the tile layer with correct attribution
var osmUrl='http://{s}.tile.openstreetmap.org/{z}/{x}/{y}.png';
var osmAttrib='Map data © <a href="http://openstreetmap.org">OpenStreetMap</a> contributors';
var osm = new L.TileLayer(osmUrl, {minZoom: 8, maxZoom: 12, attribution: osmAttrib});

// start the map in South-East England
map.setView(new L.LatLng(51.3, 0.7),9);
map.addLayer(osm);
Add a WMS layer on top of the basemap
The Leaflet examples contain a page about working with WMS in Leaflet. From the Leaflet WMS and TMS tutorial [42]:
var wmsLayer = L.tileLayer.wms('https://demo.boundlessgeo.com/geoserver/ows?', { layers: 'nasa:bluemarble' }).addTo(map);The above example shows how the L.tileLayer.wms [36] class can be used together with a URL and a list of layer names to add a WMS to the Leaflet map.
Query a WMS layer on a mouse click
This one is a little harder. A WMS query is based on a GetFeatureInfo request, and Leaflet doesn't provide any kind of method for doing that. In contrast, Leaflet is more focused on working with vector data drawn by the browser from sources like GeoJSON. Its support for WMS layers is limited to display only.
So how do you query a WMS using Leaflet? It's time to head over to Google and try WMS GetFeatureInfo Leaflet. A couple of resources in the results are useful. First, a GitHub page by Ryan Clark [43] shares some JavaScript functions he wrote for doing the GetFeatureInfo request directly through the web via jQuery and AJAX. I'll describe this more thoroughly in the walkthrough, but basically, he constructs a JavaScript string variable of the URL he needs in order to do the request, then he sends the request to the web using a method from the jQuery open source JavaScript helper library. Paul Crickard III wrote a simplified implementation [44] of Clark's technique on his blog that forms the basis for the code in the walkthrough.
Both examples listen for a mouse click event on the map to trigger the query, although this is coded in slightly different ways. Crickard's pattern is sufficient for our purposes, with onMapClick being a function that runs after the map detects a click event:
map.addEventListener('click', onMapClick);
function onMapClick(e){
  . . .
}
Please take a few minutes to review both these resources and do your best to see what's going on. You likely won't understand all the code, but pay attention to the general patterns of setting up a URL, making a request, and working with the result.
Display the result in a popup
Both Clark's and Crickard's GetFeatureInfo examples above display elements of the query response inside a popup. Both use the L.Popup [45] class for this, but Crickard's example is a bit easier to follow for beginners. He does:
popup = new L.Popup({maxWidth: 400});
Then later he sets an anchor point for the popup and the content that should appear inside.
popup.setLatLng(e.latlng);
popup.setContent("<iframe src='"+URL+"' width='300' height='100' frameborder='0'></iframe>");
map.openPopup(popup);
Notice that HTML can be used for the content. You can parse the WMS GetFeatureInfo response and pull out the elements you need and format them into an HTML string to act as the content.
Finding and adapting examples to fit your goal
It's natural to ask, "How do you expect me to write a bunch of code like this from scratch when I'm just barely getting familiar with JavaScript?!" The answer is that you don't have to write code like this from scratch. You only need to know enough to interpret and adapt a working example. Using the documentation and examining the code line by line, you should be able to get at least a basic idea of what is happening. If there's a parameter you don't understand, you can zero in on it. But don't worry about grasping everything.
Experienced developers sometimes say that the way to learn an API is to "play with it." This can drive beginners insane. Play with what? How do I even know what to do? In this lesson, you have hopefully learned to pick out simple code examples that are most relevant to what you want to do, then examine them line by line and see if you can tell what each line of the code is doing. Then make minor adjustments to the code to fit it to your own data and scenario. (This is the "playing with it" part.) Let's go to the walkthrough to see how the above examples could be adapted to some of your own web map services.
Walkthrough: Overlaying a WMS on a tiled map with Leaflet
The goal of this walkthrough is to get some practice overlaying different kinds of web services in Leaflet. You will first publish a WMS showing farmers' markets in Philadelphia. You will then use Leaflet to place this layer on top of the Philadelphia basemap tiles you made with QGIS in the previous lesson. You'll also add code, so that a user of your application can click any farmers market and see some more information in a popup.
Setting up the farmers' markets WMS
The first step is setting up a (passably) good-looking WMS showing farmers' markets in Philadelphia. In this application, the farmers' markets WMS will play the role of the business layer.
Setting up this WMS will be a nice review of some of the skills you learned in Lesson 4. In places where step-by-step instructions are lacking, you should be able to go back to the Lesson 4 walkthrough to remember the procedures.
- Download this shapefile of Philadelphia farmers' markets [46]. This was obtained from the City of Philadelphia via the PASDA [47] library. It's probably easiest if you extract it into your C:\data\Philadelphia folder.
- Open the GeoServer web admin page, and publish the farmers market shapefile as a layer in GeoServer using coordinate system EPSG:3857. Put it into your geog585 workspace. It should look like the following when you preview the layer.
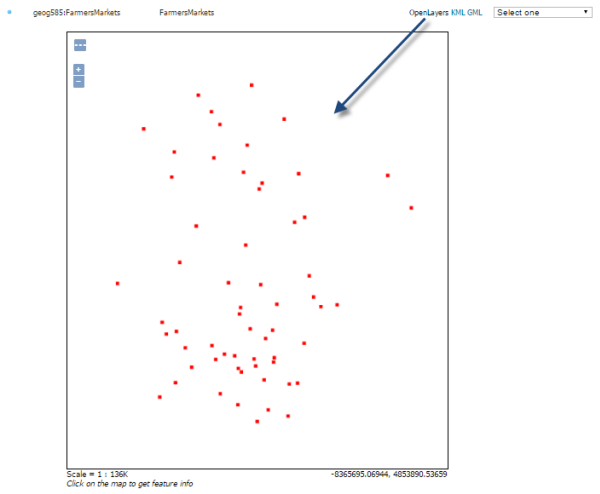 Figure 6.5
 - Using the SLD Cookbook example for Point With Styled Label [48], create an SLD named point_pointwithstyledlabel. If you don't remember how to do this, see the Lesson 4 walkthrough. You did exactly the same thing in that lesson using a polygon example.
Remember that the SLD is case-sensitive when reading the field that contains the label name. In this FarmersMarkets shapefile, the field you want to use for the label text is called NAME, in all caps, therefore, you will have to change the SLD code so that NAME is in all caps:<Label> <ogc:PropertyName>NAME</ogc:PropertyName> </Label> - Apply the point_pointwithstyledlabel SLD to your farmers market WMS so that it is the only available SLD, or at least the default. Again, see the Lesson 4 walkthrough if you're having trouble remembering how to do this.
When you have successfully applied the SLD, the WMS should look like the following when you preview the layer in GeoServer:You've now successfully prepared the WMS that you will overlay on your tiled map later in this walkthrough.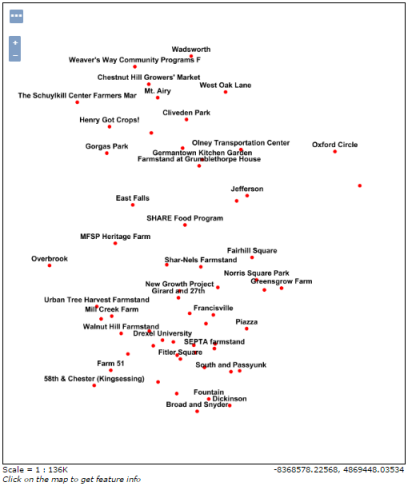 Figure 6.6
Preparing the web development environment
Now you'll make a few preparations for writing a simple Leaflet application. We’re going to host this app on the mini web server called Jetty that is installed with GeoServer. Just remember that in "the real world" you would probably get your IT staff to install an enterprise grade web server, such as Apache where you could run both GeoServer and your HTML pages. If you don't have an IT staff, you may even be lucky enough to do this yourself someday! :-)
- Stop GeoServer. (run the shutdown.bat file in the bin folder or press CTRL+C in the command shell window in which GeoServer is running than confirm with Y)
- Create a folder C:\Users\{username}\GeoServer 2.x.x\webapps\geog585 (insert your user name or adapt accordingly if you have installed GeoServer somewhere else)
- As you develop web pages, you will put all your HTML pages and stylesheets in this folder.
- Start GeoServer (run the startup.bat file in the bin folder)
As long as GeoServer is started, you should now be able to access your HTML pages through a URL such as http://localhost:8080/geog585/mypage.html [49] (where mypage.html needs to be replaced by the name of the actual html file).
Your HTML pages will often use stylesheets to define how the page should be drawn.
- Create a new text file and paste in the following code:
#mapid {
    width: 512px;
    height: 512px;
    border: 1px solid #ccc;
}

.leaflet-container {
    background: #fff;
}
The above CSS sets the size of the map container, the size and color of the map border, and the color of the background.
- Save the file in your new Jetty folder as ...\GeoServer 2.x.x\webapps\geog585\style.css. If you get an access denied error, you will have to modify the access rights of the geog585 folder so that your user has read and write access rights to the folder. Alternatively, you can try to run your text editor in Administrator mode.
- Test that your CSS is accessible by opening a browser to http://localhost:8080/geog585/style.css [50]. You should see the same CSS file.
If you get an HTTP 404 “Page not found” error and you are certain your URL is correct (or try it without the .css extension - http://localhost:8080/geog585/style [51]), then something might have gone wrong with Jetty recognizing your new geog585 folder. I have been able to work around this situation by doing a full restart of the machine and starting GeoServer again. After that, the folder was recognized.
Note that when you also put your HTML pages in this folder, you can refer to this file in your HTML code simply as style.css instead of supplying the entire URL.
- Save and close style.css.
Creating the HTML page and writing the code
Now you'll create an HTML page and insert the JavaScript code that configures the map and popups. The steps below do not provide the code linearly; you are expected to insert the code in the correct places as given in the instructions. Code is hierarchical, in the sense that some blocks run within others. It's more intuitive to describe the blocks of code rather than to give the code in its exact sequence. If you get confused about where the code is supposed to go, refer to the full example code at the end of this walkthrough page.
- Create an empty text file and save it as markets.html in your Jetty web folder (in other words, ...\GeoServer 2.x.x\webapps\geog585\).
Tip: If you are trying to edit this file later in the lesson and your text editor won't let you save it, stop GeoServer. You can start GeoServer after you have saved your edits and are ready to preview.
- Place the following code in your text file (unlike Python, indentation doesn't matter in HTML, so don't worry if the indentation doesn't come through exactly):
<!DOCTYPE html>
    <html>
      <head>
        <meta http-equiv="Content-Type" content="text/html; charset=utf-8">
        <title>Farmers markets in Philadelphia</title>
          <link rel="stylesheet" href="https://cdnjs.cloudflare.com/ajax/libs/leaflet/1.2.0/leaflet.css" type="text/css" crossorigin="">
        <script src="https://cdnjs.cloudflare.com/ajax/libs/leaflet/1.2.0/leaflet.js" crossorigin=""></script>
        <script src="http://ajax.googleapis.com/ajax/libs/jquery/1.9.1/jquery.min.js"></script>
        <link rel="stylesheet" href="style.css" type="text/css">

        <script type="text/javascript">


        </script>
      </head>
      <body onload="init()">
        <h1 id="title">Farmers markets in Philadelphia</h1>

        <div id="mapid">
        </div>

        <div id="docs">
            <p>This page shows farmers markets in Philadelphia, Pennsylvania. Click a market to get more information.</p>
        </div>

      </body>
    </html>
The above code contains the HTML head and body. This should give you a shell of a page, although you won't see the map show up yet.
In the head, notice the references to the Leaflet JavaScript and CSS files, both running on the CloudFlare CDN. There's also a reference to the style.css that you placed in your web folder earlier, which in some cases overrides the Leaflet stylesheet. Finally, there is a reference to the jQuery JavaScript library, which is running on Google’s CDN. jQuery is a helper library that greatly simplifies some JavaScript tasks. We’re going to use it here to make a web request to query the WMS, since there’s no easy way to do a WMS GetFeatureInfo request in Leaflet.
In the body, notice there is a div element with id "mapid" that is intended to hold our Leaflet web map. The CSS style for this element is defined in style.css and it sets the width and the height of the map in pixels. If you wanted to change the map width and height, you would modify the CSS.
When the body of the page has loaded, it runs the init() function from the JavaScript code we’ll add later. That’s why you see <body onload="init()">.
From this point on, we will not make any changes to the head or body. We will be inserting JavaScript logic in the <script> tag.
- Within the <script type="text/javascript"></script> tag, insert the following code:
var map;
function init() {
   // create map and set center and zoom level
   map = new L.map('mapid');
   map.setView([39.9526,-75.1652],13);
   . . .
}
This sets up a global variable named map that can be used throughout your JavaScript code. Then an initialization function called init() is defined, which you’ll recall is the function you set to run when the page body loads. The first thing the function does is instantiate a Leaflet map object within your mapid div. It then centers the map at 39.9526 N 75.1652 W at zoom level 13.
In this walkthrough, you will insert the remaining JavaScript inside of the init() function where you see the . . . above.
- Now you’ll add some code to bring in your Philly basemap tiles. Insert the following in the init() function of your code, directly after the line where you called map.setView().
// create tile layer and add it to map
var tiles = L.tileLayer('https://<URL of your S3 bucket>/PhillyBasemap/{z}/{x}/{y}.png');
tiles.addTo(map);
The above code creates a Leaflet tile layer that references your PhillyBasemap that you made with QGIS in Lesson 5. In the code above, you must modify the URL to use your S3 bucket name as created in the L5 walkthrough. The final URL should look something to this:
https://geog585-somestring.s3.someregion.amazonaws.com/PhillyBasemap/{z}/{x}/{y}.png
The URL to the tiles is provided in a generic format where z means zoom level number, x means column number, and y means row number. As long as you give Leaflet this tile URL structure, it will be smart enough to request the correct tiles as you pan and zoom around the map.
Notice how the tileLayer.addTo() method is used to add the layer to the map. The map object is passed in as a parameter. In some other mapping APIs like OpenLayers you call an add method on the map itself and provide the layer as a parameter.
- Add the following code immediately after the code you entered in the previous step:
// create wms layer
 var farmerMarkets = L.tileLayer.wms('http://localhost:8080/geoserver/geog585/wms', {
  layers: 'geog585:FarmersMarkets',
  format: 'image/png',
  transparent: true
});

farmerMarkets.addTo(map);

. . .
This adds the WMS layer of the farmers markets to the map. Notice how Leaflet’s wms class is used for this. You give it some properties such as the URL, layers, and image format you want (all using WMS-friendly syntax), and Leaflet takes care of formatting and sending the GetMap requests and displaying the responses as the user zooms and pans around the map.
So far, creating the map and adding the layers were pretty simple. It’s clicking the WMS and seeing a popup that turns out to be more complex. In order to do this, you have to send a WMS GetFeatureInfo request to the server. Leaflet offers no options for this, so you have to do it yourself by constructing a URL, sending it to the server, and reading the response. So how do you make a web request like this using JavaScript?
One way is by using jQuery, an open source API designed for simplifying things that JavaScript programmers have to do day in and day out. One of these tasks is sending web requests to a server while the end user is interacting with a web page (ie, clicking your map). The request is sent using a technique called AJAX (Asynchronous JavaScript and XML) which avoids a total page refresh.
With this in mind, let’s write an Identify function that we can fire off whenever someone clicks the map. This function will construct a WMS GetFeatureInfo request, send the request to the server using AJAX, and put the response into a popup.
- Add the following to your code directly after the lines you added above in the place of the . . .:
// define event handler function for click events and register it
function Identify(e)
{
  . . .
}
map.addEventListener('click', Identify);
Above is the Identify function that runs whenever you fire off a mouse event. I haven’t provided this entire function yet because it is long; however, I have inserted a … so you can see that together with the definition of this function, an “event listener” is added to the map to keep on the alert for any mouse clicks that occur. If someone clicks the map, the Identify function will be fired and a Leaflet event object [52] called ‘e’ containing some properties of the clicked point will be brought into the function.
- Replace the code in the … above with the following:
// set parameters needed for GetFeatureInfo WMS request
var sw = map.options.crs.project(map.getBounds().getSouthWest());
var ne = map.options.crs.project(map.getBounds().getNorthEast());
var BBOX = sw.x + "," + sw.y + "," + ne.x + "," + ne.y;
var WIDTH = map.getSize().x;
var HEIGHT = map.getSize().y;
. . .
Some key things we need in order to construct a GetFeatureInfo request are the bounding coordinates of the map, the width of the map in pixels, and the height of the map in pixels. The Leaflet map object provides ways of getting those properties. That’s what’s happening in the code above. The southwest and northeast corner coordinates of the map are retrieved, and these are formatted into a comma-delimited string in the syntax required by the BBOX parameter. Then the width and height are also retrieved from the Leaflet map.
- Continue filling in the Identify function by replacing the … in the code above with the following:
var X = Math.trunc(map.layerPointToContainerPoint(e.layerPoint).x);
var Y = Math.trunc(map.layerPointToContainerPoint(e.layerPoint).y);
// compose the URL for the request
var URL = 'http://localhost:8080/geoserver/geog585/wms?SERVICE=WMS&VERSION=1.3.0&REQUEST=GetFeatureInfo&LAYERS=geog585:FarmersMarkets&QUERY_LAYERS=geog585:FarmersMarkets&BBOX='+BBOX+'&FEATURE_COUNT=1&HEIGHT='+HEIGHT+'&WIDTH='+WIDTH+'&INFO_FORMAT=application%2Fjson&TILED=false&CRS=EPSG%3A3857&I='+X+'&J='+Y;
. . .
The purpose of this code is to figure out the clicked point and construct the request URL. Although the lines above seem a bit complex, they are essentially getting the row and column of the clicked pixel from the event object (named ‘e’) generated by the mouse click. A URL is then constructed for the GetFeatureInfo request, plugging in the values we derived above for the BBOX, WIDTH, HEIGHT, I, and J parameters.
Be aware that if you named your WMS something other than FarmersMarkets, put it in a workspace other than geog585, or placed it in a folder other than geog585, you will need to modify the URL in the above code.
Now let’s add some code to send this request.
- Continue filling in the Identify function by replacing the … in the code above with the following code.
//send GetFeatureInfo as asynchronous HTTP request using jQuery $.ajax
$.ajax({
    url: URL,
    dataType: "json",
    type: "GET",
    success: function(data)
    {
       if(data.features.length !== 0) {  // at least one feature returned in response
         var returnedFeature = data.features[0]; // first feature from response

         // Set up popup for clicked feature and open it
         var popup = new L.Popup({
            maxWidth: 300
         });

         popup.setContent("<b>" + returnedFeature.properties.NAME + "</b><br />" + returnedFeature.properties.ADDRESS);
         popup.setLatLng(e.latlng);
         map.openPopup(popup);
    }
  }
});
The above is a function that uses jQuery to make a GetFeatureInfo request using AJAX. Typically when you see $. in a piece of JavaScript code, it means a jQuery function is being invoked. Remember we brought in a reference to the jQuery library at the top of our page, allowing us to use these functions.
To make the web request, the AJAX function needs a number of options passed in, including the URL, the dataType, the type of request, etc. Another important thing is what to do with the response; therefore, we define a little function to handle the response data if the request was successful. First of all, this function checks if a feature came back, because someone could very feasibly click an empty area of the map and get no features in return. Any returned features are provided in an array, and the first feature in that array is referenced above using the variable returnedFeature. For simplicity here, we don’t handle cases where multiple features were returned.
The next order of business is to examine returnedFeature and construct a popup window using its properties. A new Leaflet popup balloon is created using the L.popup [45] class. It is then populated with a little piece of HTML constructed from some of the properties of returnedFeature, namely the NAME and ADDRESS fields of the selected farmers market.
The popup needs to be “anchored” to the map somewhere, therefore the mouse click event object ‘e’ is referenced again to construct the anchor point. A final line of code then opens the popup.
- Test your map by opening http://localhost:8080/geog585/markets.html [53]. It should look like the image below. If it doesn't, continue reading for some troubleshooting tips.
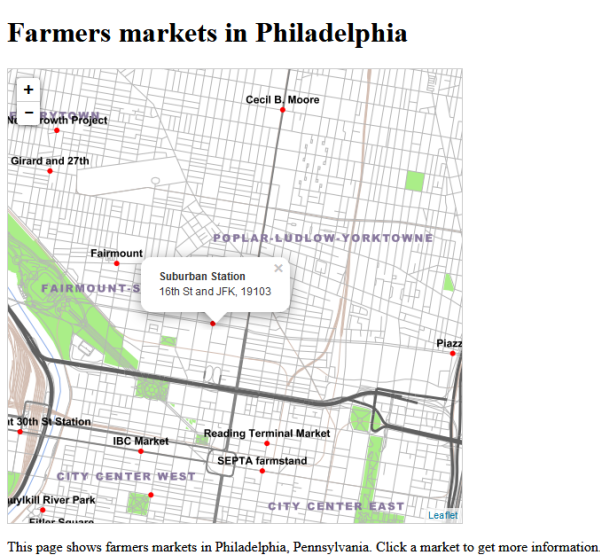
Figure 6.7 Final web page after completing the walkthrough
Troubleshooting
If you don't get the expected result at the end of the walkthrough, please verify the following:
- Make sure that you are connected to the Internet. In this course, we always reference Leaflet from a content delivery network (CDN) website rather than hosting it on our own server. All of the Leaflet logic is being pulled from the Internet in our case.
- Check that GeoServer is started. Note that you may need to stop GeoServer while making adjustments to your code, then start it when you have made your edits and want to preview your work.
- Make sure that you are opening the page in your browser via the http://localhost:8080/geog585/markets.html [53] URL and not as a local file, e.g. by double-clicking the .html file in the Windows File Explorer.
- Check that you have correctly inserted your AWS S3 bucket addres into the tile URL for the basemap as described above.
- Check that you have inserted the correct workspace and web service name in your WMS URL as described above.
- Make sure your code exactly matches the final code below other than the parts your personalized in the two previous steps.
Final code for the walkthrough
Below is the code used in this walkthrough from start to finish (but keep in mind that the URL for the basemap tiles needs to be adapted to refer to your S3 bucket). This should help you get some context of where each block should be placed. If you’re curious how the code would look in a different API, you can download an OpenLayers 3 example [54] here.
<!DOCTYPE html>
      <html>
        <head>
          <meta http-equiv="Content-Type" content="text/html; charset=utf-8">
            <title>Farmers markets in Philadelphia</title>
            <link rel="stylesheet" href="https://cdnjs.cloudflare.com/ajax/libs/leaflet/1.2.0/leaflet.css" type="text/css" crossorigin="">
            <script src="https://cdnjs.cloudflare.com/ajax/libs/leaflet/1.2.0/leaflet.js"></script>
            <script src="http://ajax.googleapis.com/ajax/libs/jquery/1.9.1/jquery.min.js"></script>
            <link rel="stylesheet" href="style.css" type="text/css">
            <script type="text/javascript">

            var map;

            function init() {
              // create map and set center and zoom level

              map = new L.map('mapid');
              map.setView([39.9526,-75.1652],13);

              // create tile layer and add it to map
              var tiles = L.tileLayer('https://<URL of your S3 bucket>/PhillyBasemap/{z}/{x}/{y}.png');
              tiles.addTo(map);

              // create wms layer
              var farmerMarkets = L.tileLayer.wms('http://localhost:8080/geoserver/geog585/wms', {
                layers: 'geog585:FarmersMarkets',
                format: 'image/png',
                transparent: true
              });

              farmerMarkets.addTo(map);

              // define event handler function for click events and register it

              function Identify(e)
              {
                // set parameters needed for GetFeatureInfo WMS request
                var sw = map.options.crs.project(map.getBounds().getSouthWest());
                var ne = map.options.crs.project(map.getBounds().getNorthEast());
                var BBOX = sw.x + "," + sw.y + "," + ne.x + "," + ne.y;
                var WIDTH = map.getSize().x;
                var HEIGHT = map.getSize().y;

                var X = Math.trunc(map.layerPointToContainerPoint(e.layerPoint).x);
                var Y = Math.trunc(map.layerPointToContainerPoint(e.layerPoint).y);

                // compose the URL for the request
                var URL = 'http://localhost:8080/geoserver/geog585/wms?SERVICE=WMS&VERSION=1.3.0&REQUEST=GetFeatureInfo&LAYERS=geog585:FarmersMarkets&QUERY_LAYERS=geog585:FarmersMarkets&BBOX='+BBOX+'&FEATURE_COUNT=1&HEIGHT='+HEIGHT+'&WIDTH='+WIDTH+'&INFO_FORMAT=application%2Fjson&TILED=false&CRS=EPSG%3A3857&I='+X+'&J='+Y;

                //send GetFeatureInfo as asynchronous HTTP request using jQuery $.ajax

                $.ajax({
                   url: URL,
                   dataType: "json",
                   type: "GET",
                   success: function(data)
                   {
                     if(data.features.length !== 0) {  // at least one feature returned in response
                       var returnedFeature = data.features[0]; // first feature from response

                       // Set up popup for clicked feature and open it
                       var popup = new L.Popup({
                         maxWidth: 300
                       });

                       popup.setContent("<b>" + returnedFeature.properties.NAME + "</b><br />" + returnedFeature.properties.ADDRESS);
                       popup.setLatLng(e.latlng);
                       map.openPopup(popup);
                    }
                  }
                 });
               }

               map.addEventListener('click', Identify);

             }

          </script>
        </head>
        <body onload="init()">
          <h1 id="title">Farmers markets in Philadelphia</h1>
          <div id="mapid">
          </div>
          <div id="docs">
              <p>This page shows farmers markets in Philadelphia, Pennsylvania. Click a market to get more information.</p>
          </div>
        </body>
      </html>
Lesson 6 assignment: Overlay your own data in Leaflet and examine real world use of a web mapping API
This week's assignment has two parts:
- The first piece of the assignment requires you to adapt the Lesson 6 walkthrough to your own data. Recall that in the Lesson 4 assignment, you served a WMS using some of your term project data. For this week's assignment, overlay this WMS on a tiled map using Leaflet. Get the popups working on the WMS as well.
The tiled map can either be the map you made in the Lesson 5 assignment, or it can be a third party hosted set of OpenStreetMap tiles.
This task will require just some minor adaptation of the walkthrough code.
The deliverables for this part of the project are A) your HTML source code file, B) a screenshot of the two maps overlayed with a popup displayed (just like the graphics in the walkthrough), and C) a short (200 - 300 word) write-up reflecting on how this part of the assignment went for you, what problems you encountered, and insights you gained from it.
- Read this GIS Stack Exchange post: How do various JavaScript mapping libraries compare? [32] Then write a short review of the bikeshare web map at https://bikesharemap.com/ [56]. Examine the source code (use "View Page Source" in your browser) and then submit an approximately 300 - 500 word evaluation describing:
- Which web mapping API was used?
- Which services/layers are brought into this map?
- What principal features/classes of the web mapping API were used? Include links to the API reference documentation for these classes.
- What is one coding technique you learned by looking at the source code of this map?
- What could be improved in this web map implementation in terms of code or additional interactive elements?
Zip these deliverables into a single folder and place them in the Lesson 6 assignment drop box on Canvas.