Walkthrough: Overlaying a WMS on a tiled map with Leaflet
The goal of this walkthrough is to get some practice overlaying different kinds of web services in Leaflet. You will first publish a WMS showing farmers' markets in Philadelphia. You will then use Leaflet to place this layer on top of the Philadelphia basemap tiles you made with QGIS in the previous lesson. You'll also add code, so that a user of your application can click any farmers market and see some more information in a popup.
Setting up the farmers' markets WMS
The first step is setting up a (passably) good-looking WMS showing farmers' markets in Philadelphia. In this application, the farmers' markets WMS will play the role of the business layer.
Setting up this WMS will be a nice review of some of the skills you learned in Lesson 4. In places where step-by-step instructions are lacking, you should be able to go back to the Lesson 4 walkthrough to remember the procedures.
- Download this shapefile of Philadelphia farmers' markets [1]. This was obtained from the City of Philadelphia via the PASDA [2] library. It's probably easiest if you extract it into your C:\data\Philadelphia folder.
- Open the GeoServer web admin page, and publish the farmers market shapefile as a layer in GeoServer using coordinate system EPSG:3857. Put it into your geog585 workspace. It should look like the following when you preview the layer.
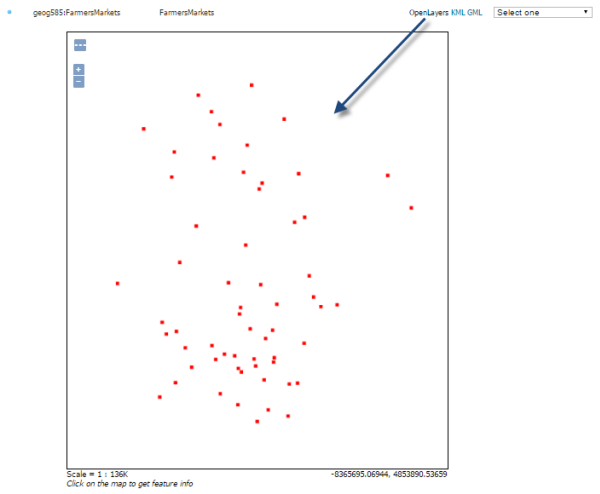 Figure 6.5
 - Using the SLD Cookbook example for Point With Styled Label [3], create an SLD named point_pointwithstyledlabel. If you don't remember how to do this, see the Lesson 4 walkthrough. You did exactly the same thing in that lesson using a polygon example.
Remember that the SLD is case-sensitive when reading the field that contains the label name. In this FarmersMarkets shapefile, the field you want to use for the label text is called NAME, in all caps, therefore, you will have to change the SLD code so that NAME is in all caps:<Label> <ogc:PropertyName>NAME</ogc:PropertyName> </Label> - Apply the point_pointwithstyledlabel SLD to your farmers market WMS so that it is the only available SLD, or at least the default. Again, see the Lesson 4 walkthrough if you're having trouble remembering how to do this.
When you have successfully applied the SLD, the WMS should look like the following when you preview the layer in GeoServer:You've now successfully prepared the WMS that you will overlay on your tiled map later in this walkthrough.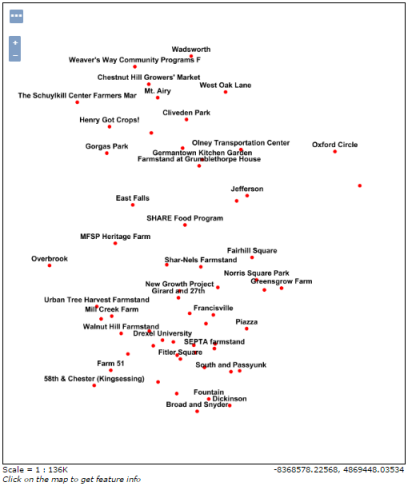 Figure 6.6
Preparing the web development environment
Now you'll make a few preparations for writing a simple Leaflet application. We’re going to host this app on the mini web server called Jetty that is installed with GeoServer. Just remember that in "the real world" you would probably get your IT staff to install an enterprise grade web server, such as Apache where you could run both GeoServer and your HTML pages. If you don't have an IT staff, you may even be lucky enough to do this yourself someday! :-)
- Stop GeoServer. (run the shutdown.bat file in the bin folder or press CTRL+C in the command shell window in which GeoServer is running than confirm with Y)
- Create a folder C:\Users\{username}\GeoServer 2.x.x\webapps\geog585 (insert your user name or adapt accordingly if you have installed GeoServer somewhere else)
- As you develop web pages, you will put all your HTML pages and stylesheets in this folder.
- Start GeoServer (run the startup.bat file in the bin folder)
As long as GeoServer is started, you should now be able to access your HTML pages through a URL such as http://localhost:8080/geog585/mypage.html [4] (where mypage.html needs to be replaced by the name of the actual html file).
Your HTML pages will often use stylesheets to define how the page should be drawn.
- Create a new text file and paste in the following code:
#mapid {
    width: 512px;
    height: 512px;
    border: 1px solid #ccc;
}

.leaflet-container {
    background: #fff;
}
The above CSS sets the size of the map container, the size and color of the map border, and the color of the background.
- Save the file in your new Jetty folder as ...\GeoServer 2.x.x\webapps\geog585\style.css. If you get an access denied error, you will have to modify the access rights of the geog585 folder so that your user has read and write access rights to the folder. Alternatively, you can try to run your text editor in Administrator mode.
- Test that your CSS is accessible by opening a browser to http://localhost:8080/geog585/style.css [5]. You should see the same CSS file.
If you get an HTTP 404 “Page not found” error and you are certain your URL is correct (or try it without the .css extension - http://localhost:8080/geog585/style [6]), then something might have gone wrong with Jetty recognizing your new geog585 folder. I have been able to work around this situation by doing a full restart of the machine and starting GeoServer again. After that, the folder was recognized.
Note that when you also put your HTML pages in this folder, you can refer to this file in your HTML code simply as style.css instead of supplying the entire URL.
- Save and close style.css.
Creating the HTML page and writing the code
Now you'll create an HTML page and insert the JavaScript code that configures the map and popups. The steps below do not provide the code linearly; you are expected to insert the code in the correct places as given in the instructions. Code is hierarchical, in the sense that some blocks run within others. It's more intuitive to describe the blocks of code rather than to give the code in its exact sequence. If you get confused about where the code is supposed to go, refer to the full example code at the end of this walkthrough page.
- Create an empty text file and save it as markets.html in your Jetty web folder (in other words, ...\GeoServer 2.x.x\webapps\geog585\).
Tip: If you are trying to edit this file later in the lesson and your text editor won't let you save it, stop GeoServer. You can start GeoServer after you have saved your edits and are ready to preview.
- Place the following code in your text file (unlike Python, indentation doesn't matter in HTML, so don't worry if the indentation doesn't come through exactly):
<!DOCTYPE html>
    <html>
      <head>
        <meta http-equiv="Content-Type" content="text/html; charset=utf-8">
        <title>Farmers markets in Philadelphia</title>
          <link rel="stylesheet" href="https://cdnjs.cloudflare.com/ajax/libs/leaflet/1.2.0/leaflet.css" type="text/css" crossorigin="">
        <script src="https://cdnjs.cloudflare.com/ajax/libs/leaflet/1.2.0/leaflet.js" crossorigin=""></script>
        <script src="http://ajax.googleapis.com/ajax/libs/jquery/1.9.1/jquery.min.js"></script>
        <link rel="stylesheet" href="style.css" type="text/css">

        <script type="text/javascript">


        </script>
      </head>
      <body onload="init()">
        <h1 id="title">Farmers markets in Philadelphia</h1>

        <div id="mapid">
        </div>

        <div id="docs">
            <p>This page shows farmers markets in Philadelphia, Pennsylvania. Click a market to get more information.</p>
        </div>

      </body>
    </html>
The above code contains the HTML head and body. This should give you a shell of a page, although you won't see the map show up yet.
In the head, notice the references to the Leaflet JavaScript and CSS files, both running on the CloudFlare CDN. There's also a reference to the style.css that you placed in your web folder earlier, which in some cases overrides the Leaflet stylesheet. Finally, there is a reference to the jQuery JavaScript library, which is running on Google’s CDN. jQuery is a helper library that greatly simplifies some JavaScript tasks. We’re going to use it here to make a web request to query the WMS, since there’s no easy way to do a WMS GetFeatureInfo request in Leaflet.
In the body, notice there is a div element with id "mapid" that is intended to hold our Leaflet web map. The CSS style for this element is defined in style.css and it sets the width and the height of the map in pixels. If you wanted to change the map width and height, you would modify the CSS.
When the body of the page has loaded, it runs the init() function from the JavaScript code we’ll add later. That’s why you see <body onload="init()">.
From this point on, we will not make any changes to the head or body. We will be inserting JavaScript logic in the <script> tag.
- Within the <script type="text/javascript"></script> tag, insert the following code:
var map;
function init() {
   // create map and set center and zoom level
   map = new L.map('mapid');
   map.setView([39.9526,-75.1652],13);
   . . .
}
This sets up a global variable named map that can be used throughout your JavaScript code. Then an initialization function called init() is defined, which you’ll recall is the function you set to run when the page body loads. The first thing the function does is instantiate a Leaflet map object within your mapid div. It then centers the map at 39.9526 N 75.1652 W at zoom level 13.
In this walkthrough, you will insert the remaining JavaScript inside of the init() function where you see the . . . above.
- Now you’ll add some code to bring in your Philly basemap tiles. Insert the following in the init() function of your code, directly after the line where you called map.setView().
// create tile layer and add it to map
var tiles = L.tileLayer('https://<URL of your S3 bucket>/PhillyBasemap/{z}/{x}/{y}.png');
tiles.addTo(map);
The above code creates a Leaflet tile layer that references your PhillyBasemap that you made with QGIS in Lesson 5. In the code above, you must modify the URL to use your S3 bucket name as created in the L5 walkthrough. The final URL should look something to this:
https://geog585-somestring.s3.someregion.amazonaws.com/PhillyBasemap/{z}/{x}/{y}.png
The URL to the tiles is provided in a generic format where z means zoom level number, x means column number, and y means row number. As long as you give Leaflet this tile URL structure, it will be smart enough to request the correct tiles as you pan and zoom around the map.
Notice how the tileLayer.addTo() method is used to add the layer to the map. The map object is passed in as a parameter. In some other mapping APIs like OpenLayers you call an add method on the map itself and provide the layer as a parameter.
- Add the following code immediately after the code you entered in the previous step:
// create wms layer
 var farmerMarkets = L.tileLayer.wms('http://localhost:8080/geoserver/geog585/wms', {
  layers: 'geog585:FarmersMarkets',
  format: 'image/png',
  transparent: true
});

farmerMarkets.addTo(map);

. . .
This adds the WMS layer of the farmers markets to the map. Notice how Leaflet’s wms class is used for this. You give it some properties such as the URL, layers, and image format you want (all using WMS-friendly syntax), and Leaflet takes care of formatting and sending the GetMap requests and displaying the responses as the user zooms and pans around the map.
So far, creating the map and adding the layers were pretty simple. It’s clicking the WMS and seeing a popup that turns out to be more complex. In order to do this, you have to send a WMS GetFeatureInfo request to the server. Leaflet offers no options for this, so you have to do it yourself by constructing a URL, sending it to the server, and reading the response. So how do you make a web request like this using JavaScript?
One way is by using jQuery, an open source API designed for simplifying things that JavaScript programmers have to do day in and day out. One of these tasks is sending web requests to a server while the end user is interacting with a web page (ie, clicking your map). The request is sent using a technique called AJAX (Asynchronous JavaScript and XML) which avoids a total page refresh.
With this in mind, let’s write an Identify function that we can fire off whenever someone clicks the map. This function will construct a WMS GetFeatureInfo request, send the request to the server using AJAX, and put the response into a popup.
- Add the following to your code directly after the lines you added above in the place of the . . .:
// define event handler function for click events and register it
function Identify(e)
{
  . . .
}
map.addEventListener('click', Identify);
Above is the Identify function that runs whenever you fire off a mouse event. I haven’t provided this entire function yet because it is long; however, I have inserted a … so you can see that together with the definition of this function, an “event listener” is added to the map to keep on the alert for any mouse clicks that occur. If someone clicks the map, the Identify function will be fired and a Leaflet event object [7] called ‘e’ containing some properties of the clicked point will be brought into the function.
- Replace the code in the … above with the following:
// set parameters needed for GetFeatureInfo WMS request
var sw = map.options.crs.project(map.getBounds().getSouthWest());
var ne = map.options.crs.project(map.getBounds().getNorthEast());
var BBOX = sw.x + "," + sw.y + "," + ne.x + "," + ne.y;
var WIDTH = map.getSize().x;
var HEIGHT = map.getSize().y;
. . .
Some key things we need in order to construct a GetFeatureInfo request are the bounding coordinates of the map, the width of the map in pixels, and the height of the map in pixels. The Leaflet map object provides ways of getting those properties. That’s what’s happening in the code above. The southwest and northeast corner coordinates of the map are retrieved, and these are formatted into a comma-delimited string in the syntax required by the BBOX parameter. Then the width and height are also retrieved from the Leaflet map.
- Continue filling in the Identify function by replacing the … in the code above with the following:
var X = Math.trunc(map.layerPointToContainerPoint(e.layerPoint).x);
var Y = Math.trunc(map.layerPointToContainerPoint(e.layerPoint).y);
// compose the URL for the request
var URL = 'http://localhost:8080/geoserver/geog585/wms?SERVICE=WMS&VERSION=1.3.0&REQUEST=GetFeatureInfo&LAYERS=geog585:FarmersMarkets&QUERY_LAYERS=geog585:FarmersMarkets&BBOX='+BBOX+'&FEATURE_COUNT=1&HEIGHT='+HEIGHT+'&WIDTH='+WIDTH+'&INFO_FORMAT=application%2Fjson&TILED=false&CRS=EPSG%3A3857&I='+X+'&J='+Y;
. . .
The purpose of this code is to figure out the clicked point and construct the request URL. Although the lines above seem a bit complex, they are essentially getting the row and column of the clicked pixel from the event object (named ‘e’) generated by the mouse click. A URL is then constructed for the GetFeatureInfo request, plugging in the values we derived above for the BBOX, WIDTH, HEIGHT, I, and J parameters.
Be aware that if you named your WMS something other than FarmersMarkets, put it in a workspace other than geog585, or placed it in a folder other than geog585, you will need to modify the URL in the above code.
Now let’s add some code to send this request.
- Continue filling in the Identify function by replacing the … in the code above with the following code.
//send GetFeatureInfo as asynchronous HTTP request using jQuery $.ajax
$.ajax({
    url: URL,
    dataType: "json",
    type: "GET",
    success: function(data)
    {
       if(data.features.length !== 0) {  // at least one feature returned in response
         var returnedFeature = data.features[0]; // first feature from response

         // Set up popup for clicked feature and open it
         var popup = new L.Popup({
            maxWidth: 300
         });

         popup.setContent("<b>" + returnedFeature.properties.NAME + "</b><br />" + returnedFeature.properties.ADDRESS);
         popup.setLatLng(e.latlng);
         map.openPopup(popup);
    }
  }
});
The above is a function that uses jQuery to make a GetFeatureInfo request using AJAX. Typically when you see $. in a piece of JavaScript code, it means a jQuery function is being invoked. Remember we brought in a reference to the jQuery library at the top of our page, allowing us to use these functions.
To make the web request, the AJAX function needs a number of options passed in, including the URL, the dataType, the type of request, etc. Another important thing is what to do with the response; therefore, we define a little function to handle the response data if the request was successful. First of all, this function checks if a feature came back, because someone could very feasibly click an empty area of the map and get no features in return. Any returned features are provided in an array, and the first feature in that array is referenced above using the variable returnedFeature. For simplicity here, we don’t handle cases where multiple features were returned.
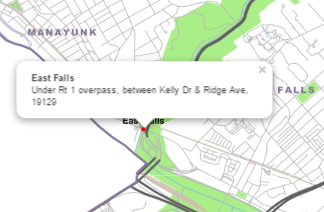
The next order of business is to examine returnedFeature and construct a popup window using its properties. A new Leaflet popup balloon is created using the L.popup [8] class. It is then populated with a little piece of HTML constructed from some of the properties of returnedFeature, namely the NAME and ADDRESS fields of the selected farmers market.
The popup needs to be “anchored” to the map somewhere, therefore the mouse click event object ‘e’ is referenced again to construct the anchor point. A final line of code then opens the popup.
- Test your map by opening http://localhost:8080/geog585/markets.html [9]. It should look like the image below. If it doesn't, continue reading for some troubleshooting tips.
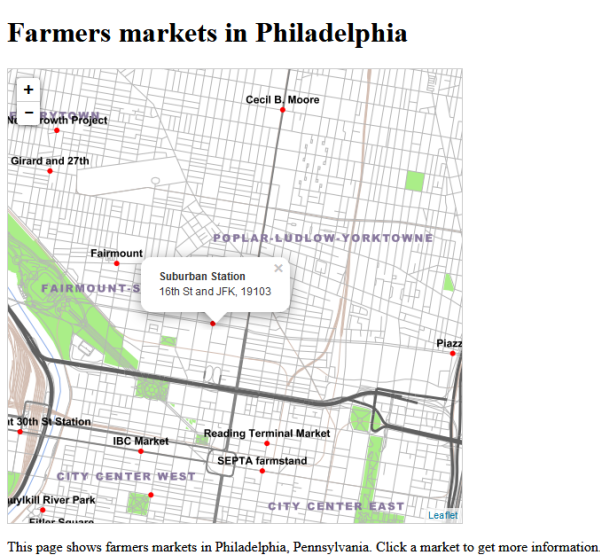
Figure 6.7 Final web page after completing the walkthrough
Troubleshooting
If you don't get the expected result at the end of the walkthrough, please verify the following:
- Make sure that you are connected to the Internet. In this course, we always reference Leaflet from a content delivery network (CDN) website rather than hosting it on our own server. All of the Leaflet logic is being pulled from the Internet in our case.
- Check that GeoServer is started. Note that you may need to stop GeoServer while making adjustments to your code, then start it when you have made your edits and want to preview your work.
- Make sure that you are opening the page in your browser via the http://localhost:8080/geog585/markets.html [9] URL and not as a local file, e.g. by double-clicking the .html file in the Windows File Explorer.
- Check that you have correctly inserted your AWS S3 bucket addres into the tile URL for the basemap as described above.
- Check that you have inserted the correct workspace and web service name in your WMS URL as described above.
- Make sure your code exactly matches the final code below other than the parts your personalized in the two previous steps.
Final code for the walkthrough
Below is the code used in this walkthrough from start to finish (but keep in mind that the URL for the basemap tiles needs to be adapted to refer to your S3 bucket). This should help you get some context of where each block should be placed. If you’re curious how the code would look in a different API, you can download an OpenLayers 3 example [10] here.
<!DOCTYPE html>
      <html>
        <head>
          <meta http-equiv="Content-Type" content="text/html; charset=utf-8">
            <title>Farmers markets in Philadelphia</title>
            <link rel="stylesheet" href="https://cdnjs.cloudflare.com/ajax/libs/leaflet/1.2.0/leaflet.css" type="text/css" crossorigin="">
            <script src="https://cdnjs.cloudflare.com/ajax/libs/leaflet/1.2.0/leaflet.js"></script>
            <script src="http://ajax.googleapis.com/ajax/libs/jquery/1.9.1/jquery.min.js"></script>
            <link rel="stylesheet" href="style.css" type="text/css">
            <script type="text/javascript">

            var map;

            function init() {
              // create map and set center and zoom level

              map = new L.map('mapid');
              map.setView([39.9526,-75.1652],13);

              // create tile layer and add it to map
              var tiles = L.tileLayer('https://<URL of your S3 bucket>/PhillyBasemap/{z}/{x}/{y}.png');
              tiles.addTo(map);

              // create wms layer
              var farmerMarkets = L.tileLayer.wms('http://localhost:8080/geoserver/geog585/wms', {
                layers: 'geog585:FarmersMarkets',
                format: 'image/png',
                transparent: true
              });

              farmerMarkets.addTo(map);

              // define event handler function for click events and register it

              function Identify(e)
              {
                // set parameters needed for GetFeatureInfo WMS request
                var sw = map.options.crs.project(map.getBounds().getSouthWest());
                var ne = map.options.crs.project(map.getBounds().getNorthEast());
                var BBOX = sw.x + "," + sw.y + "," + ne.x + "," + ne.y;
                var WIDTH = map.getSize().x;
                var HEIGHT = map.getSize().y;

                var X = Math.trunc(map.layerPointToContainerPoint(e.layerPoint).x);
                var Y = Math.trunc(map.layerPointToContainerPoint(e.layerPoint).y);

                // compose the URL for the request
                var URL = 'http://localhost:8080/geoserver/geog585/wms?SERVICE=WMS&VERSION=1.3.0&REQUEST=GetFeatureInfo&LAYERS=geog585:FarmersMarkets&QUERY_LAYERS=geog585:FarmersMarkets&BBOX='+BBOX+'&FEATURE_COUNT=1&HEIGHT='+HEIGHT+'&WIDTH='+WIDTH+'&INFO_FORMAT=application%2Fjson&TILED=false&CRS=EPSG%3A3857&I='+X+'&J='+Y;

                //send GetFeatureInfo as asynchronous HTTP request using jQuery $.ajax

                $.ajax({
                   url: URL,
                   dataType: "json",
                   type: "GET",
                   success: function(data)
                   {
                     if(data.features.length !== 0) {  // at least one feature returned in response
                       var returnedFeature = data.features[0]; // first feature from response

                       // Set up popup for clicked feature and open it
                       var popup = new L.Popup({
                         maxWidth: 300
                       });

                       popup.setContent("<b>" + returnedFeature.properties.NAME + "</b><br />" + returnedFeature.properties.ADDRESS);
                       popup.setLatLng(e.latlng);
                       map.openPopup(popup);
                    }
                  }
                 });
               }

               map.addEventListener('click', Identify);

             }

          </script>
        </head>
        <body onload="init()">
          <h1 id="title">Farmers markets in Philadelphia</h1>
          <div id="mapid">
          </div>
          <div id="docs">
              <p>This page shows farmers markets in Philadelphia, Pennsylvania. Click a market to get more information.</p>
          </div>
        </body>
      </html>