Walkthrough: Adding interactive GeoJSON layers in Leaflet
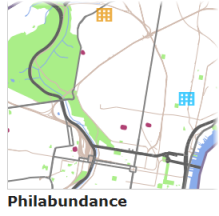
This walkthrough builds on some of the previous sections of the lesson to show how you can add interactive GeoJSON layers to your web map using Leaflet. You will build a map containing your Philadelphia basemap tiles and two GeoJSON layers on top representing urban gardens and food pantries (i.e., food banks). A user can click one of the gardens or food pantries to see the name of the feature below the map (as an alternative to using popups). The clicked feature changes color while it is selected. Hopefully, you can think of many ways to apply these pieces of functionality to the web map you're building for your term project.
Note that this is a sample dataset culled from OpenStreetMap and is not a comprehensive list of these features in Philadelphia. If you know of any other gardens or food pantries, please add them in OpenStreetMap (more about this in Chapter 9)!
Downloading the data
Before continuing, download and unzip the data for this project [1]. Copy its contents into your Jetty home folder, which should have a path such as
c:\Users\{username}\GeoServer 2.x.x\webapps\geog585\
This is the same folder where you saved your Lesson 6 walkthrough and where your local stylesheet style.css (required for this exercise) is located.
This folder contains two JavaScript files containing GeoJSON data. gardens.js holds a gardensData variable with polygon GeoJSON and pantries.js holds a pantriesData variable with point GeoJSON.
There are also two SVG (scalable vector graphics) files that will be used for symbolizing the food pantries. The yellow symbol will be for the unselected features and the blue symbol for the selected features.
There are a couple of ways that you could get this kind of data for your own applications.
- QGIS can save any vector layer as GeoJSON format.
- ogr2ogr in the GDAL library can convert shapefiles and other types to GeoJSON
In both cases you would need to either save the data as a JS file and define the GeoJSON as a variable (the approach we took here), or use an extension like Leaflet AJAX to read the data directly out of the file (beyond the scope of this course).
To get icons, all the icons available in QGIS are available on your machine in a folder named something like:
C:\Program Files\QGIS <name of your version>\apps\qgis\svg
I used the open source program Inkscape to change the color of the icon.
Setting up the HTML file
Before diving into the JavaScript code, create an empty text file and insert the following code. Then save it as lesson7.html next to all the other files you just downloaded and copied into your home folder.
<!DOCTYPE html>
  <html>
    <head>
      <meta http-equiv="Content-Type" content="text/html; charset=utf-8">
      <title>Food resources: Community gardens and food pantries</title>
      <link rel="stylesheet" href="https://cdnjs.cloudflare.com/ajax/libs/leaflet/1.2.0/leaflet.css" type="text/css" crossorigin="">
      <script src="https://cdnjs.cloudflare.com/ajax/libs/leaflet/1.2.0/leaflet.js" crossorigin=""></script>
      <script src="gardens.js"></script>
      <script src="pantries.js"></script>
      <link rel="stylesheet" href="style.css" type="text/css">

        <script type="text/javascript">

        . . .

        </script>
    </head>
      <body onload="init()">
        <h1 id="title">Food resources: Community gardens and food pantries</h1>

        <div id="mapid"></div>
        <div id="summaryLabel">
            <p>Click a garden or food pantry on the map to get more information.</p>
        </div>
      </body>
  </html>
If you open this, you should see a blank map frame surrounded by an HTML title and descriptive text. In the script and link tags, notice that we are loading in Leaflet code and stylesheets, as well as the gardens and pantries.js files.
Now let's add the Leaflet JavaScript code that creates the map and layers.
Writing the JavaScript
- Find the script tag for your JavaScript code and replace the . . . with the following lines so that you have:
var map;

function init() {
  // create map and set center and zoom level
  map = new L.map('mapid');
  map.setView([39.960,-75.210],14);

  // create and add the tile layer
  var tiles = L.tileLayer('https://<URL of your S3 bucket>/PhillyBasemap/{z}/{x}/{y}.png');
  tiles.addTo(map);

 . . .

}
The above code creates a global variable for the map and then defines the initialization function that will run when the page loads. This init() function will contain most of our JavaScript code.
The map view is set zoomed in to West Philadelphia so we can get a detailed look at food resources at a neighborhood level.
The Philadelphia basemap tiles are also added here. You must modify the URL in the code above to point at your own tiles as you had to do in the Lesson 6 walkthrough. Again the URL should look similar to this with the first part being the URL of your S3 bucket:https://geog585-somestring.s3.someregion.amazonaws.com/PhillyBasemap/{z}/{x}/{y}.png - Now we'll set up some variables for use in this init() function. Replace the . . . in the code above with the following:
var gardenLayer;
var pantryLayer;

var selection;
var selectedLayer;

. . .
Nothing is happening with these yet, but it's important that you understand their future purpose in the code:
- gardenLayer and pantryLayer will eventually be Leaflet layers that reference the GeoJSON.
- selection will reference the currently selected feature. If no feature is selected, the value of this variable will be set to null.
- selectedLayer will reference the layer that was most recently selected.
- Now we'll set up the style we'll eventually use on the garden layer. Replace the . . . in the code above with the following:
// define the styles for the garden layer (unselected and selected)
function gardenStyle(feature) {
  return {
    fillColor: "#FF00FF",
    fillOpacity: 1,
    color: '#B04173',
  };
}

function gardenSelectedStyle(feature) {
  return {
    fillColor: "#00FFFB",
    color: '#0000FF',
    fillOpacity: 1
  };
}

. . .
This is nearly identical to the code in the previous section of the lesson, so I won't explain it in detail. It just defines two different symbols for the gardens layer (a default symbol and a selected symbol).
- Now let's add a function that will tell each garden feature how to behave when it is clicked. Replace the . . . in the code above with the following:
// handle click events on garden features
function gardenOnEachFeature(feature, layer){
  layer.on({
    click: function(e) {
      if (selection) {
        resetStyles();
      }

      e.target.setStyle(gardenSelectedStyle());
      selection = e.target;
      selectedLayer = gardenLayer;

      // Insert some HTML with the feature name
      buildSummaryLabel(feature);

      L.DomEvent.stopPropagation(e); // stop click event from being propagated further
    }
  });
}

. . .
There's a lot going on here, so we'll take this a piece at a time. One of the most useful things about Leaflet is its ability to define a function for each feature stating how that feature should behave in response to certain events. In the function above, we're telling each garden feature to listen for a click event. If a garden gets clicked, a function will run with an event argument (represented by the variable e) that will help us work with the clicked feature. This code is called event handler code, because it handles the situation where a click event occurs.
In the case above, if a feature gets clicked, we take any existing feature that might be highlighted and set its style back to the default. This is accomplished in the function resetStyles() whose code we are going to add later on.
Then we take the clicked feature (e.target) and style it with the special style we set up for selected features. We also update the selection and selectedLayer variables to reference our newly clicked feature.
Finally, we build some HTML to put in the descriptive layer below the map. This code will be found in a function called buildSummaryLabel(), which we will add a little later on.
Note that a call to L.DomEvent.stopPropogation() is needed so that if someone clicks a feature, only the feature click event handler code runs, and not the map click event handler code.
- Now we've got everything we need to add the garden layer to the map. Replace the . . . in the code above with the following:
// add the gardens GeoJSON layer using the gardensData variable from gardens.js
var gardenLayer = new L.geoJSON(gardensData,{
  style: gardenStyle,
  onEachFeature: gardenOnEachFeature
});

gardenLayer.addTo(map);

. . .
Note how the above code references the gardensData variable contained in gardens.js. If we didn't have a script tag referencing gardens.js at the top of our page, the variable gardensData would be unrecognized. By using gardenStyle for the style property, we are making sure that the layer will be styled according to our previous definition. Similarly, by using the gardenOnEachFeature function defined above for the onEachFeature property, we achieve that each feature from the layer will have the click event handler function defined in gardenOnEachFeature attached.
- Now we're going to repeat the whole process with the pantries layer. Replace the . . . in the code above with the following:
// create icons for pantries (selected and unselected)
var pantriesIcon = L.icon({
  iconUrl: 'pantries.svg',
  iconSize: [20,20]
});

var selectedPantriesIcon = L.icon({
  iconUrl: 'pantries_selected.svg',
  iconSize: [20,20]
});

// handle click events on pantry features
function pantriesOnEachFeature(feature, layer){
  layer.on({
    click: function(e) {
      if (selection) {
        resetStyles();
      }

      e.target.setIcon(selectedPantriesIcon);
      selection = e.target;
      selectedLayer = pantryLayer;

      // Insert some HTML with the feature name
      buildSummaryLabel(feature);

      L.DomEvent.stopPropagation(e); // stop click event from being propagated further
    }
  });
}


// add the pantries GeoJSON layer using the pantriesData variable from pantries.js
pantryLayer = new L.geoJSON(pantriesData,{
  pointToLayer: function (feature, latlng) {
    return L.marker(latlng, {icon: pantriesIcon});
  },
  onEachFeature: pantriesOnEachFeature
  }
);

pantryLayer.addTo(map);

. . .
The only fundamental difference between this and the gardens code is the way that the style is defined for a point using an SVG icon. Notice how when the Leaflet layer is created, the pointToLayer function must be defined stating where and how to place each Leaflet marker.
- Now that all the layers are added, let's switch our focus to the map. We have to handle the case where someone clicks on the map but doesn't click on a feature. In that situation, everything should become unselected. Replace the . . . in the code above with the following:
// handle clicks on the map that didn't hit a feature
map.addEventListener('click', function(e) {
  if (selection) {
    resetStyles();
    selection = null;
    document.getElementById('summaryLabel').innerHTML = '<p>Click a garden or food pantry on the map to get more information.</p>';
  }
});

. . .
There are several ways that event handlers can be added in Leaflet. The code above uses the addEventListener method. Notice how in the above code the label below the map is also reset with the message "Click a garden or food pantry on the map to get more information."
- Now we'll add some of the functions that were used in the layer event handler code above. The first one looks to see which layer was previously selected and sets the selected feature's symbol back to the default. Replace the . . . in the code above with the following:
// function to set the old selected feature back to its original symbol. Used when the map or a feature is clicked.
function resetStyles(){
  if (selectedLayer === pantryLayer) selection.setIcon(pantriesIcon);
  else if (selectedLayer === gardenLayer) selectedLayer.resetStyle(selection);
}

. . .
Separate lines of code are needed above for the pantries and gardens layers because points represented by icons and polygons have different styling syntaxes in Leaflet.
- Finally we need the function to build the HTML string for the summary label that goes below the map. Replace the . . . in the code above with the following:
// function to build the HTML for the summary label using the selected feature's "name" property
function buildSummaryLabel(currentFeature){
  var featureName = currentFeature.properties.name || "Unnamed feature";
  document.getElementById('summaryLabel').innerHTML = '<p style="font-size:18px"><b>' + featureName + '</b></p>';
}
The above function brings in the currently selected feature and reads its "name" attribute. It then gets the HTML element with the ID of "summaryLabel" and sets its innerHTML to a carefully constructed string of HTML into which the name (represented by the variable featureName) is inserted. Note that if our gardens and pantries layers had different attribute field names (such as "PANTRYNAME" and "GARDENNAME" then we would need to add more code above to handle those cases.
- Run your page, and click some of the garden and pantry features. When you click a feature, it should turn blue, and the feature name should display below the map. When you click away from a feature (or click a different feature), the feature should return to its original color, and the feature name should be removed (or updated if you clicked a different feature).
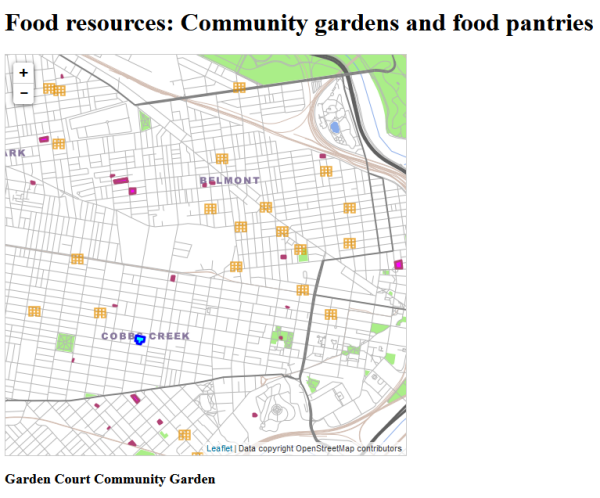 Figure 7.4
Final code for the walkthrough
If your page does not work, carefully compare your code to the full code below to make sure you have inserted everything in the right place. Also:
- Verify that you are connected to the Internet when you run the page, so that you can retrieve the Leaflet code from the CDN.
- Make sure that you have inserted the URL for your S3 bucket where the code refers to the basemap tile layer.
- Make sure that GeoServer is started (because you are running the page through its Jetty web servlet) and that you are referencing the page through a URL similar to the following: http://localhost:8080/geog585/lesson7.html [2].
An OpenLayers 3 version of the walkthrough code [3] is available for the curious. Note that the GeoJSON files must be adjusted for this version of the walkthrough to function. It must be pure GeoJSON and not contain any declared variables or JavaScript code.
<!DOCTYPE html>
  <html>
    <head>
      <meta http-equiv="Content-Type" content="text/html; charset=utf-8">
      <title>Food resources: Community gardens and food pantries</title>
      <link rel="stylesheet" href="https://cdnjs.cloudflare.com/ajax/libs/leaflet/1.2.0/leaflet.css" type="text/css" crossorigin="">
      <script src="https://cdnjs.cloudflare.com/ajax/libs/leaflet/1.2.0/leaflet.js" crossorigin=""></script>
      <script src="gardens.js"></script>
      <script src="pantries.js"></script>
      <link rel="stylesheet" href="style.css" type="text/css">

        <script type="text/javascript">
          var map;

          function init() {
          // create map and set center and zoom level
          map = new L.map('mapid');
          map.setView([39.960,-75.210],14);

          // create and add the tile layer
          var tiles = L.tileLayer('https://<URL of your S3 bucket>/PhillyBasemap/{z}/{x}/{y}.png');
          tiles.addTo(map);

          var gardenLayer;
          var pantryLayer;

          var selection;
          var selectedLayer;

          // define the styles for the garden layer (unselected and selected)
          function gardenStyle(feature) {
            return {
               fillColor: "#FF00FF",
               fillOpacity: 1,
               color: '#B04173',
            };
          }

          function gardenSelectedStyle(feature) {
             return {
               fillColor: "#00FFFB",
               color: '#0000FF',
               fillOpacity: 1
            };
          }

          // handle click events on garden features
          function gardenOnEachFeature(feature, layer){
            layer.on({
              click: function(e) {
                  if (selection) {
                    resetStyles();
                  }

                  e.target.setStyle(gardenSelectedStyle());
                  selection = e.target;
                  selectedLayer = gardenLayer;

                  // Insert some HTML with the feature name
                  buildSummaryLabel(feature);

                  L.DomEvent.stopPropagation(e); // stop click event from being propagated further
                }
            });
          }

                // add the gardens GeoJSON layer using the gardensData variable from gardens.js
                var gardenLayer = new L.geoJSON(gardensData,{
                  style: gardenStyle,
                  onEachFeature: gardenOnEachFeature
                });

                gardenLayer.addTo(map);


          // create icons for pantries (selected and unselected)
          var pantriesIcon = L.icon({
            iconUrl: 'pantries.svg',
            iconSize: [20,20]
          });

          var selectedPantriesIcon = L.icon({
            iconUrl: 'pantries_selected.svg',
            iconSize: [20,20]
          });

          // handle click events on pantry features
          function pantriesOnEachFeature(feature, layer){
            layer.on({
              click: function(e) {
                  if (selection) {
                    resetStyles();
                  }
                  e.target.setIcon(selectedPantriesIcon);
                  selection = e.target;
                  selectedLayer = pantryLayer;

                  // Insert some HTML with the feature name
                  buildSummaryLabel(feature);

                  L.DomEvent.stopPropagation(e); // stop click event from being propagated further
                }
            });
          }


          // add the pantries GeoJSON layer using the pantriesData variable from pantries.js
                pantryLayer = new L.geoJSON(pantriesData,{
                     pointToLayer: function (feature, latlng) {
                      return L.marker(latlng, {icon: pantriesIcon});
                     },
                     onEachFeature: pantriesOnEachFeature
                   }
                );

               pantryLayer.addTo(map);


          // handle clicks on the map that didn't hit a feature
          map.addEventListener('click', function(e) {
            if (selection) {
              resetStyles();
              selection = null;
              document.getElementById('summaryLabel').innerHTML = '<p>Click a garden or food pantry on the map to get more information.</p>';
            }
          });

          // function to set the old selected feature back to its original symbol. Used when the map or a feature is clicked.
          function resetStyles(){
            if (selectedLayer === pantryLayer) selection.setIcon(pantriesIcon);
            else if (selectedLayer === gardenLayer) selectedLayer.resetStyle(selection);
          }

          // function to build the HTML for the summary label using the selected feature's "name" property
          function buildSummaryLabel(currentFeature){
            var featureName = currentFeature.properties.name || "Unnamed feature";
            document.getElementById('summaryLabel').innerHTML = '<p style="font-size:18px"><b>' + featureName + '</b></p>';
          }

        }

        </script>
      </head>
      <body onload="init()">
        <h1 id="title">Food resources: Community gardens and food pantries</h1>

        <div id="mapid"></div>
        <div id="summaryLabel">
            <p>Click a garden or food pantry on the map to get more information.</p>
        </div>
      </body>
    </html>