Welcome to Geog 586: Geographic Information Analysis!
Instructor Information
Amy C. Burnicki
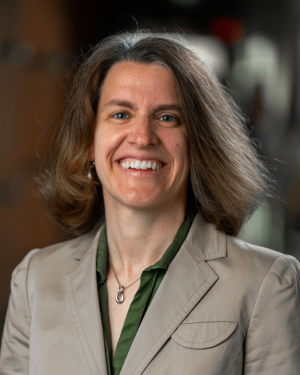
Amy Burnicki is Associate Teaching Professor in the Department of Geography and an instructor for GEOG 580: Geovisual Analytics and GEOG 586: Geographic Information Analysis. Her research applies spatial data analysis, spatial statistics, and quantitative modeling approaches in the field of Land Change Science and in transportation and environmental engineering applications. Amy’s work integrates GIScience technologies and quantitative methods to quantify and model landscape patterns, with a particular interest in the impact of error and uncertainty on land change analyses. More recently, Amy has worked on several transportation engineering projects to improve pedestrian volume estimation and describe pedestrian crossing compliance on local roadways by incorporating measures of land development intensity. In addition, Amy collaborated with environmental engineering researchers on projects examining the vulnerability of Connecticut’s water system infrastructure to a changing climate. Amy received her Ph.D. in Natural Resources & Environment from the University of Michigan and her M.S. in Statistics from Penn State.
Meet Amy Burnicki, instructor of this course (1:40 minutes)
Hello. I'm Amy Burnicki, an Associate Teaching Professor in the Department of Geography and the Online Geospatial Education Program. I'm a GI scientist interested in applying spatial data analysis, spatial statistics, and quantitative modeling approaches to investigate patterns. Early in my career my research focused on quantifying and modeling landscape change and investigating the impacts of air and uncertainty on land change analyzes. Who is Amy Burnicki More recently, I collaborated with transportation and environmental engineers on a variety of projects from modeling pedestrian crosswalk volumes, to investigating the impacts of our changing climate on water infrastructure. What ties my work together is my love for examining spatial patterns and investigating the techniques required to quantify and model them. As an instructor in the online geospatial program my goal is to illustrate the connections between GI science principles and methodologies and their practical application in solving real world challenges. Outside of work, my family and I can often be found outdoors enjoying our next Outside of work great family adventure, whether it's hiking in a forest, or up a mountain, paddling down a river, Outdoors or relaxing on the beach, we love to get out and discover new places. I also love visiting Art new cities and exploring the local art museums. Some of my favorite works of art are sculptures and paintings that manage to bring these two activities together. The online geospatial education program has fantastic students and I'm excited to work with you! See you in class.
Brandi Gaertner
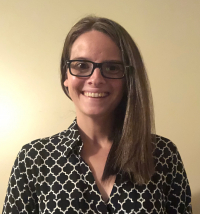
I am Dr. Brandi Gaertner, Assistant Teaching Professor of Spatial Data Science in the online Geospatial Education program. I joined the Penn State faculty in 2021. I am a climate change hydrologist and GIS analyst. My research focus is on evaluating the historical and future impacts of climate change on surface streamflow and climate variables such as precipitation and temperature. I also use remote sensing techniques, such as Normalized Difference Vegetation Index (NDVI), to study the impact of climate change on lengthened growing seasons, evapotranspiration, and hydrology
Prior to joining Penn State, I was an Assistant Professor of Environmental Science at Alderson Broaddus University in Philippi, W.V. I earned my doctorate in Forestry and Natural Resources with a focus on Climate Change Hydrology from West Virginia University in 2019. Prior to pursuing my doctorate degree, I completed an M.S. in Environmental Biology with a focus on Aquatic Ecology.
I have extensive experience and education in online teaching. I graduateed in 2022 with an M.S. in Instructional Design and Online Technology. I also have a graduate certificate in University Teaching, have received several Quality Matters certificates for Online Education, and have taught and designed over 10 online courses at previous institutions.
Meet Dr. Brandi Gaertner, instructor of GEOG 581 (0:52 seconds).
I’m Dr. Brandi Gaertner. I am a climate change hydrologist and I study the impact of climate change on growing season length, which is the amount of time that trees stay green. I have a Master of Science in Online Technology and Instructional Design and I'm also working on a Master of Education and Lifelong Learning and Adult Education. Both of these degrees have taught me the value of an open communication learning environment. With that in mind, feel free to contact me, even if it's just to say hi. I have a lot of hobbies outside of academia including running, walking, hiking and reading. I also have a daughter, Anna Marie. She was born July of 2021 and she keeps life very fun and interesting. I look forward to meeting you in the future and have a great day.
Marcela Suárez
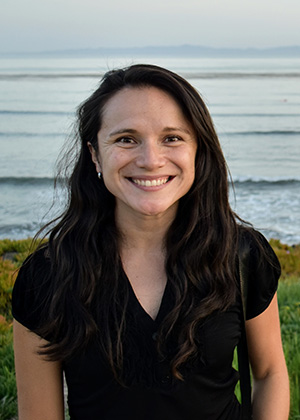
Hi, I am Marcela Suárez. I am an assistant teaching professor of spatial data science in the Department of Geography at Penn State. I teach courses on cartography, GIS, and spatial data analysis in the online geospatial education program offered by the John A. Dutton e-Education Institute.
I earned my PhD in geography from the University of California, Santa Barbara. Broadly my research interests lie at the intersection of geographic information science, cartography, and emergency management. In my research, I use spatial analysis, geovisualization, machine learning, and data mining techniques to understand how user-generated content and volunteered geographic information can be used along with other official data sources to inform how social and environmental phenomena are experienced at a local scale. My research contributes to understanding the role of information contributed by the general public in emergency management. Additionally, it informs us about the use of different spatial clustering methods, spatial aggregation techniques, and content analysis techniques to both summarize social media data and conflate them with other official data for decision making.
Prior to joining Penn State, I was a research specialist at the Center for Spatial Studies at the University of California, Santa Barbara. In the past, I also worked as a consultant for the United Nations Development Program for Adaptation to Climate Change in the Colombian Massif, and as GIS specialist for different governmental organizations in Colombia.
Meet Marcela Suárez instructor of this course (1:18 minutes)
I'm Marcela Suárez, one of the professors in the MGIS and Spatial Data Science programs. I teach courses in cartography, spatial analysis, and spatial data science. There are many reasons why I really enjoy teaching these courses and one of them is definitely that I enjoy working with the talented students we have in these programs. The second reason is that the topics in these courses are very related to my research interest. In my research, I use spatial analysis, geo-visualization, machine learning, and data mining techniques to understand how information contributed by the general public-say tweets - can be used along with official geographic data. What I like the most about working with these different types of geographic data is that they challenge us to think and learn about new methods in the GIS science. Okay, something interesting about me is that I was born and raised in Colombia. So before coming to the U.S. to complete my PhD, I worked with different organizations there as a GIS analyst and consultant. So, when I'm not working you can probably find me biking, hiking, or spending time with my family and my dog, Fiona. Okay that was a bit about me, hope to see you in one of my classes this year.
Fritz Kessler
Hi, I am Fritz Kessler. I am a teaching professor in the Department of Geography at Penn State. I teach courses on cartography, GIS, and spatial data analysis in the online geospatial education program offered by the John A. Dutton e-Education Institute. I also teach resident courses in similar topics in the Department of Geography at Penn State. Two of my noted publications include Thematic Cartography and GeoVisualization (4th edition) and Working with Map Projections: A Guide to their Selection.
All three of my degrees (BS, MS, and PhD) are in geography with a concentration on cartography. During my undergraduate schooling, I learned how to make maps using Leroy lettering, mylar, ink pens, scribing, and photomechanical reproduction. My first exposure to computer generated maps was through programming FORTRAN on mainframe computers. Most of my early years of professional cartography work (working for the USGS) were hand drafted and scribed maps that were produced photomechanically. I've hand drawn the world many many times. But, those days are gone, thankfully. By the time I began working on my MS degree, desktop mapping was becoming popular. It is during my MS that I learned how to use Aldus Freehand, a graphic illustration package for Apple computers - specifically the Macintosh 512K. During my PhD, I was introduced to command line ArcInfo and its Windows interface derivative ArcView. Now cartography is vastly different than it was 30+ years ago. It continues to be an exciting time to be a cartographer. I hope you feel the same way too.
Before coming to Penn State, I was a professor and chair at Frostburg State University where I taught courses such as Fundamentals of Cartography, Geographic Visualization, Cartometrics, Advanced Cartography, Boundary Surveying, Research Methods, and GIS.
Here is a bit of background on my professional career as a cartographer. I've worked as a cartographer for the USGS, Intergraph Corp, and R. R. Donnelley and Sons (that later on was bought by MapQuest). Most of the maps I drew for the USGS were hand-drawn. However, it was while working for the USGS that I was first introduced to the Apple Macintosh SE30 computer which created "electronic type" (type printed on sticky-back tape that would be applied to Mylar). Not having to hand letter maps or use Zip-a-Tone transfer lettering was a huge time saver. While working for Intergraph Corp. (which no longer exists in name) I was a programmer for their GIS product: MGE (coding in C). I did a ton of map production work at R.R. Donnelley and Sons (using mostly Adobe Illustrator - version 6.0 I recall which was really buggy). Here is one of the publications I worked on at Donnelley: A travel atlas published through Reader's Digest. I also worked as a map librarian for the T. R. Smith Map Library at the University of Kansas. This was a really fun job for a cartographer but it was hard to get my work done since all I wanted to do was look at the paper maps in the map drawers. One of the jobs I like the most is being a free-lance cartographer. I never know what cartographic project will come across my desk next.
Meet Fritz Kessler, instructor of GEOG 586 (1:16 minutes).
FRITZ KESSLER: Hello. I'm Professor Fritz Kessler. I'm one of the MGIS faculty that teach a variety of online courses through the MGIS program. I also teach a mix of residential courses through the geography department. Most of my course topics deal with cartography and spatial statistics. I came about to these topics of interest because of my mathematical background during my undergraduate schooling. I gravitated towards geography because I found out that cartography was inherently mathematical. And one of the topics in particular, map projections, is very mathematical, and there was a natural inkling for me to take up cartography because of that mathematical association. When I'm not doing cartography or researching cartography or teaching, I like to play the banjo. I play a lot of bluegrass bands and festivals and so forth. I also play guitar and mandolin. I look forward to meeting you in a future course. And if you have any questions or reach out to me, I'd be most welcome to hear from you. Thank you.
Amy Griffin
I am an instructor for this course as well as GEOG 583: Geospatial System Analysis and Design. I am currently a Senior Lecturer in Geography at UNSW Canberra in Australia, where I teach a range of geography and geographic information science courses. My research interests include investigating the perceptual and cognitive processes involved in map reading and applications of GIS to historical geography. Some of my recent research projects include using eye-tracking to evaluate the design of new geovisualizations and to study the visual interpretation of remotely sensed imagery, and in collaboration with several historians, a spatiotemporal analysis of Australia's involvement in the Vietnam War.