Market segmentation is a business strategy that involves dividing prospects (potential customers) into subsets or segments that have common needs, wants, desires, values, and priorities. Market segmentation enables organizations (organizations ranging from for-profit to not-for-profit) to target different categories of prospects who perceive the full value of certain products and services differently from one another.
Targeting or target marketing then entails deciding which potential customer segments the organization will focus on. Marketing segmentation always comes before targeting so an organization can be more selective marketing their products. It is assumed that by aggregating prospects into segments that have common characteristics and requirements, they will respond similarly to a marketing and selling action.
Business location analysis directly relates to other geospatial sciences and studies:
- Demographics and Geodemographics
- Psychographics (consumer behavior)
- Census data and segmentation
- Other geospatial information, e.g., physical geography, human geography, transportation networks, internet access, or infrastructure
Designing an effective Market Segmentation relates to business requirements and situation—a challenge or opportunity—which the business faces. How does the problem relate to market, location, consumers, customers, products, business operations, or supply chain distribution?
Customers have different needs and, for market segmentation to be practical, market segments should be evaluated against defined criteria or requirements. Early in my pharmaceutical sales career, a VP of Sales encouraged us to monitor our sales daily and understand the metrics used by the company to evaluate its performance. The VP added, "If something you're doing isn't measurable, it's a hobby." In the NetMBA reading, several criteria for segmenting customers, markets, or products include the following characteristics:
- Identifiable
- Accessible
- Substantial
- Unique Needs
- Durable
Elements of the segmentation may include business reporting, transforming consumers to customers, expanding current customer product choices, and reevaluating business goals. Analysts often need more data sources for marketing segmentation. Consider ideas on creating customized consumer experiences through omni-channel marketing:
- Asking questions: intelligent, pertinent, relevant
- Enrich data into useable, valuable georeferenced information
- Segmentation
- Data – location data
- Areas of interest – areas of influence
- Demographics
- Geography – relative or applicable regions of geographic relevance
- Consumer-driven commerce
- Digital economy
In Section 2.1, Moreno described applications of location data for enriching, analyzing, and visualizing georeferenced data. That’s important for an organization’s business development, marketing, and management departments. Current combinations of marketing and business principles establish market targeting as traditional, multi-channel, digital channel or omni-channel; improving a business strategic audience decision making and customer experiences.
Many economic sectors are grappling with the explosion of data from multiple sources and formats. We will examine the value of location data & location intelligence which geospatial analysis provides business decision makers, e.g., through Smartphone penetration, location infrastructure (cell towers, beacons, RFID, GPS), and the Internet of Things (IoT). Throughout the lessons, consider methods of enriching, analyzing, and visualizing location data.
Read:
- NetMBA's primer on "Market Segmentation."
- Jamie Beckland's Mashable.com post "The End of Demographics: How Marketers Are Going Deeper With Personal Data."
- Alex Andrade-Walz. 2018. Geodemographic Segmentation: The People Behind the Coordinates. Spatially. 7 Mar. 2018. Blog.
(Registered students can access the Andrade-Walz reading in Canvas on the Lesson 2 Readings page.)
Optional Reading:
- If these topics interest you, you may wish to bookmark the Center for Spatially Integrated Social Science: CSISS Classics.
- Patchwork Nation website and associated work is often cited on PBS, in the Christian Science Monitor, and by other media outlets. Patchwork Nation "divides America's 3,141 counties into 12 community types based characteristics, such as income level, racial composition, employment and religion. It also breaks the nation’s 435 congressional districts into nine categories, using the same data points and clustering techniques."
The Claritas segmentation data is sourced from third-party national online surveys collecting population, financial, insurance, technology, and energy track data. Varied audiences or customers seek different data for understanding consumer preferences, market and geographic trends, and relationships in data to demographics. Claritas produces PRIZM Premier, P$YCLE Premier, ConneXions products for commercial customers.
- PRIZM Premier provides insights on demographics, household lifestyle and media preferences, shopping behaviors, and technology usage in 68 segments, 11 LifeStage Groups, and 14 Social Groups.
- P$YCLE Premier is built for financial marketing services connecting data on financial needs and behaviors of US households.
- ConneXions is designed for the technology and telecommunications industry to relate technology behaviors of connected consumers and adoption rates of new technology.
Activity: Explore Claritas PRIZM "My Best Segments."
This lesson is an introduction to demographic segmentation. You may or may not be familiar with Nielson Claritas segment information tool from previous courses. Claritas Zip code look-up tool lets you view your neighborhood's household segments by zip code. This data includes quick facts such as: population, median age, median income, and consumer spending in addition to the information shown nationally by segments within the segmentation system.
For this lesson, we will access the ZIP code look-up page and begin an overview of Claritas' segmentation. Please scroll to the bottom of the MyBestSegments page where there is a grey box. Under the header "Tools", select "Segment Details" for information on segments or "ZIP Code Look-up."
(Note: you may have to launch the Segment Details and ZIP Code Look-up webpages using the links found inside the grey box shown in Figure 2.6 below. At times, a Stripmenu will appear for navigation so you will not have to use the links at the bottom of the page. It depends upon how you are redirected to MyBestSegments when you first launch the webpage. Additionally, if the site does not launch, try using a different browser.)
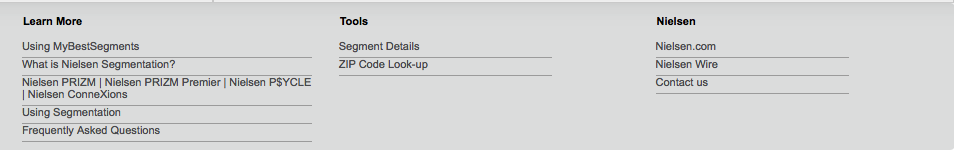
MyBestSegments Bottom Navigation Menu
- Learn More
- Using MyBestSegments
- What is Nielsen Segmentation?
- Claritas PRIZM | PSYCLE | ConneXions
- Using Segmentation
- Frequently Asked Questions
- Tools
- Segment Details
- ZIP Code Look-up
- More Info
- Nielsen.com
- Claritas360.claritas.com
You can practice by following the steps below:
- Go to MyBestSegments Zip Code Look-up.
- In Figure 2.7 below, the State College ZIP Code 16801 has been used for a sample Look-up (State College actually covers 4 ZIP Codes: 16801, 16803, 16804 & 16805).
- Now try a 5-digit ZIP code of a place with which you are familiar.
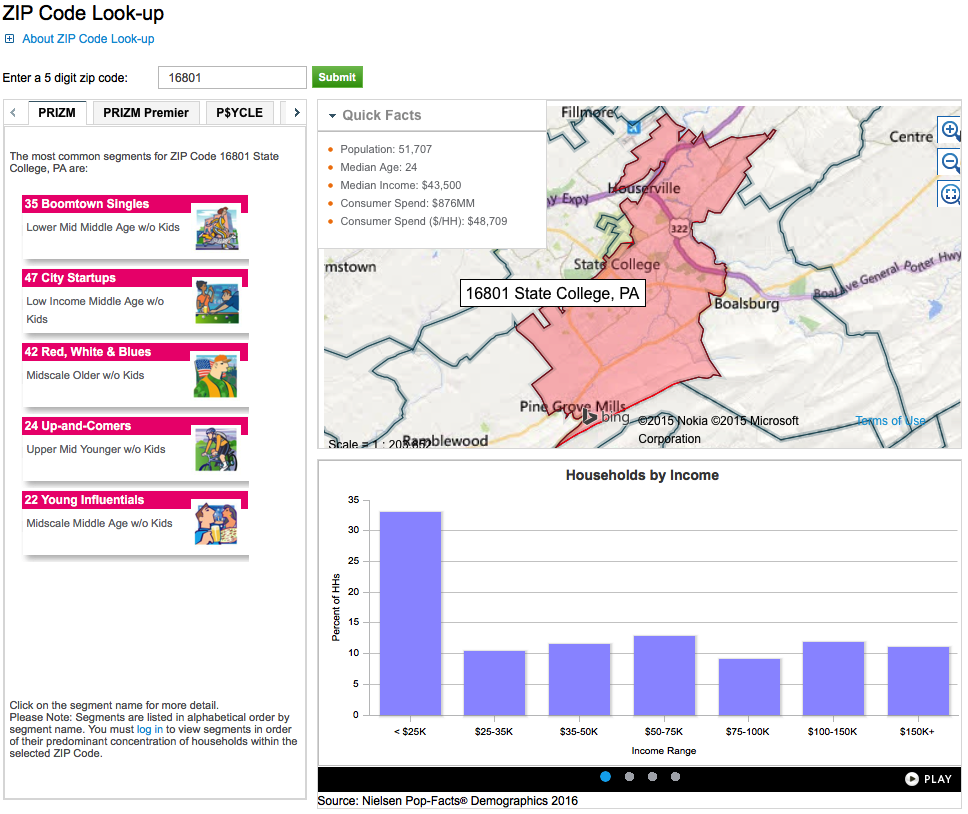
ZIP Code Lookup for 16801
- Quick Facts
- Population: 51,707
- Median Age: 24
- Median Income: 43,500
- Consumer Spend: $876MM
- Consumer Spend ($/HH): $48,709
- Common Segments for ZIP Code 16801 State College, PA
- 35 Boomtown Singles (Lower Mid Middle Age w/o Kids)
- 47 City Startups (Low Income Middle Age w/o Kids)
- 42 Red, White & Blues (Midscale Older w/o Kids)
- 24 Up-and-Comers (Upper Mid Younger w/o Kids)
- 22 Young Influentials (Midscale Middle Age w/o Kids)
- Households by income
Income Range Percent of HHs <$25K 33% $25K-35K 10% $35K-50K 12% $50K-75K 13% $75K-100K 9% $100-150K 12% $150K+ 11%
You will notice that there are some help links and tutorials in the top portion of the zip code look up page that may be beneficial for new users.
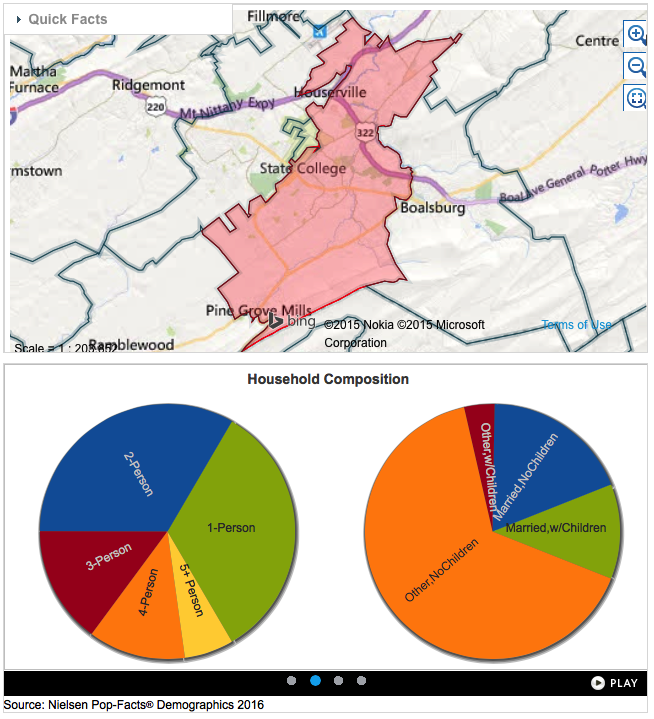
ZIP Code Data
The right side of the page (the portion that includes the map and the graphs below the map) contains information specific to the ZIP Code that was entered in the search field (see Figure 2.8). Below the map are four different graphs that display the data for the ZIP Code. These graphs can be manually scrolled from left to right by clicking on one of the four dots at the bottom of that section, or allowed to be scrolled through using the play-pause feature.
National Data Segments within the PRIZM Segmentation System
The left side of the page contains four segmentation system tabs: PRIZM, PRIZM Premier, P$ycle, and ConneXions. These tabs contain nationally based data that can be used in comparison to the local data (see Figure 2.9). Notice how the PRIZM tab data segments demographic collections which are the "most common" data segments for that particular zip code.
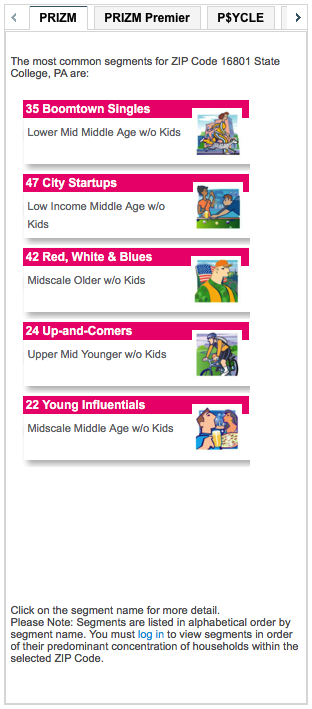
Select one of the PRIZM segment collections to view additional information. This will open a new web page with additional information. Keep in mind that the information contained in the tabs (PRIZM, P$ycle, and ConneXions) is national. You will notice a brief explanation of the segmentation with some clarification. Although there are a number of tabs, the free version of the zip code look-up site only displays data on the "snapshot" tab.
Your PRIZM Segment - Your Household
Review the segment page (Boomtown Singles, Country Squires, Traditional Times, Suburban Sprawl, etc.) within the PRIZM segmentation tab to find what segment best represents you or your household (see sample in Figure 2.10). Ask yourself the questions:
- What are the similarities and parallels between the data and how it relates to you or your neighborhood?
- What are the characteristics of the segment (that you chose) that relate to you?
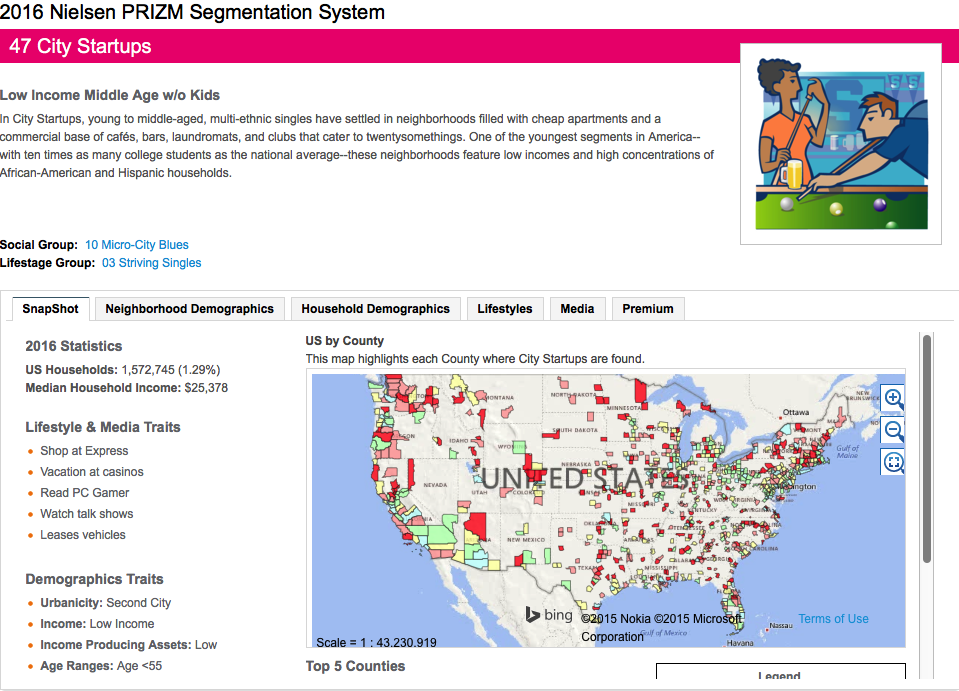
Snapshot of 47 City Startups
2016 Statistics
US Households: 1,572,745 (1.29%)
Median Household Income: $25,378
Lifestyle & Media Traits
- Shop at Express
- Vacation at casinos
- Read PC Gamer
- Watch talk shows
- Leases vehicles
Demographics Traits
- Urbanicity: Second City
- Income: Low Income
- Income Producing Assets: Low
- Age Ranges: Age <55
Social and Lifestage Groups:
Open the social group link for the segment that you have chosen. The link is located about a third of the way down on the segment page. This social group is an aggregation of multiple segments that have a common element. Consider what it is that these groups have in common to involve this segment. These groups are a coarser representation, grouping by factors that they have in common with the segment. Think about what is distinguishing the social and lifestage groups for your presentation. As we aggregate segments into a social or lifestage grouping, what patterns are we noticing that are in common?
It is also important to consider your Weiss readings and your work thus far the answer to the question, "What is different about Social and Lifestage groups? Do you see patterns, similarities, differences?"
This was a quick introduction to PRIZM. There will be additional exercises where you will be required to gather information from Claritas and PRIZM so be sure to practice with it and explore all of the features to become a little more familiar with it.
Important Note:
The "My Best Segments" search tool does NOT return all segment matches for your ZIP code. This free search tool provided by Nielsen/Claritas returns only the most common segments for each ZIP code, and these are NOT ranked--rather, they are listed alphabetically.
There could be more segments present in any given ZIP code--in coming weeks, we'll work with a different data, Esri Tapestry, for which we have full access, allowing us up to the top 20 segments. Again, for demonstration purposes here, if you don't find a segment which you feel adequately describes your household, choose one segment which you can clearly see present in your ZIP code.
Additional Help:
You may wish to refer to the Claritas 360: "Helping Companies Find Customers" Learn More. You can also search for individual segments at the "Segment Look-Up" if you need to refer back after you've closed the search tool.
Deliverable Lesson 2.3 Activity: PRIZM "My Best Segments"
Using your screen captures from above, create a Word report or presentation with images to show your results to the class. Please submit your file in Canvas to the Lesson 2.3 Drop Box Presentation. The Drop Box is set so you will be able to see all submissions.
Slide one should show your ZIP code's list of PRIZM segments OR the single segment you felt best matched. On this slide comment on:
- which segment(s) best profile(s) your household (or which is clearly present in your ZIP code);
- your perception of the accuracy of at least one demographic variable and one psychographic trait/characteristic.
Slides two and three should show the "Social" Group and "Lifestage" groups which contain your chosen segment. (You may choose to include both groups on one slide, but please comment on each, in which case you will only have two slides total.) On each of these, comment on:
- any patterns you notice in the group (across all segments);
- what is different about Social versus Lifestage groups? (What characteristics is each grouping methodology focused on?)
Due Tuesday 11:59 pm (Eastern Time)