Lesson 1: Introduction to GIS-T
Learning Outcomes
What will we learn?
By the end of Lesson 1, you should be able to:
- characterize the relationship between GIS and transportation and explain why GIS-T is such an active field;
- discuss some of the challenges and opportunities for GIS-T in the 21st century;
- list some modes of transportation and discuss the meaning and significance of modal competition, modal shift, and containerization;
- state the mission and describe some of the current initiatives of the U.S. Department of Transportation (USDOT);
- describe some of the geographic areas the Census Bureau uses to aggregate and disseminate data.
1.1 Introduction to GIS-T
Among the many areas and disciplines to which GIS has been applied, transportation has been particularly fertile ground, and the development of specialized GIS applications has been an area which has seen a lot of activity. This important interdisciplinary field is commonly referred to as GIS-T. The significance of this field is evidenced by the fact that there are two conferences devoted to it, one annual and one biennial. Each year the American Association of State Highway and Transportation Officials (AASHTO) sponsors the annual GIS for Transportation Symposium [1]. The symposium draws over 400 registrants from federal, state, and local government and the private sector. The Urban and Regional Information Systems Association (URISA) sponsors a conference called GIS in Transit [2]which is held every other year. The 10th GIS in Transit conference was held last year.
A key reason that GIS-T is so important is that transportation is a huge industry upon which many other industries depend. In 2015, the federal government spent 85 billion dollars on transportation-related initiatives. That represented 2.22% of our total federal budget for 2015. The National Priority Project (NPP) website [3] presents some interesting charts which put federal transportation spending in perspective.
Additional Learning
In their own words, the NPP “is a national non-profit, non-partisan research organization dedicated to making complex federal budget information transparent and accessible so people can prioritize and influence how their tax dollars are spent.” Their website also offers a number of very educational videos [4] if you’d like to understand our national budget, deficit, and debt.
In addition to federal dollars, there are many billions of state and local dollars spent on transportation. If you want to see how states are using transportation dollars, the Track State Dollars website [5] gives you access to data for each state.
In the U.S., federal agencies have helped to promote GIS use for transportation analysis purposes through geospatially-enabled initiatives such as the U.S. Census Bureau’s TIGER program and the Federal Highway Administration’s Highway Performance Monitoring System (HPMS). Software vendors have continually updated and improved their GIS products to include additional GIS-T functionality and tools. Today, GIS-T is an integral part of transportation operations around the world.
The natural synergy between GIS and transportation is at least in part due to the fact that transportation is inherently spatial, and while it’s true that GIS plays an important role in transportation, one can also argue that transportation plays an important role in GIS. Transportation features are frequently included on maps for context and orientation even when the fundamental purpose of the map has little or nothing to do with transportation. Take a few minutes to review this recent blog [6] from GeoSpatial World which briefly examines some important applications of GIS to transportation. In this course, we'll cover these application areas as well as many others.
1.2 Overview of the Transportation Industry
Broadly speaking, the field of transportation is concerned with the transport of people and goods. To appreciate the value that GIS brings to transportation it is necessary to develop an understanding of the various forms of transportation that exist and also the types of activities and problems which those in the field need to address.
Transportation Modes
The different ways that people and freight can be transported are referred to as transportation modes. There are many different modes of transportation, and they can be differentiated and categorized in a number of ways. At a high level, we can divide transportation into the categories of air, land, sea, and space. We could further divide the land-based transportation into road, rail, pedestrian, bike, and pipeline, although one might rightfully argue that pipelines can run under the sea. Transportation modes are not always mutually exclusive and the specific modes we talk about often depend on the situation at hand. There have been many GIS applications which have been designed for a specific mode or for a group of closely related modes.
Transportation Processes and Activities
Just as we can categorize transportation according to the many modes of transportation which exist, we can think about transportation in terms of the many processes and activities which are performed in order to manage transportation infrastructure, vehicles, and operations. Some of these processes cut across modes and others are specific to a single mode or a few modes. These processes and activities include:
- infrastructure monitoring and maintenance;
- transportation planning and transit planning;
- property acquisition and management;
- vehicle tracking and logistics;
- highway safety analysis and improvement;
- traffic monitoring, modeling, and mitigation;
- screening projects for environmental impacts;
- dissemination of travel information to the public;
- reporting data to government agencies to secure funding;
- mobile data collection;
- routing and permitting of oversize overweight vehicles.
GIS-T plays an important role in enhancing the manner in which transportation organizations accomplish these processes and activities and, in some cases, allow organizations to perform functions which would simply not be possible without spatial technologies. GIS-T applications support evaluation of different scenarios, provide objective data for decision-making purposes, and promote the visualization of conditions.
GIS-T Techniques and Tools
GIS-T utilizes many mainstream geospatial tools and methods but it also employs a number of techniques which were borne out of the specialized needs of the transportation industry. These include:
- Conflation
Conflation is a technique used to bring together adjacent or overlapping datasets which were collected at different times and have different levels of accuracy and precision. While the process of conflation in GIS is frequently applied to transportation networks, conflation can also be used to combine other types of features. - Network Analysis
A roadway network is comprised of roads and intersections. In network terminology, the intersections are referred to as nodes, and the streets which connect the nodes are called edges. GIS-T commonly employs network analysis techniques to roadway networks to solve common transportation-related problems such as finding the best route between two points or determining the service area around a specific location (i.e., the area within which someone could reach the location of interest in a defined period of time). - Linear Referencing Systems
Linear referencing systems (LRS) are used to spatially reference the location of assets (e.g., bridges), occurrences (e.g., crashes), and roadway characteristics and administrative data (e.g., speed limits) by specifying the distance along a linear feature in a roadway network. Collectively, these attributes of a roadway are referred to as events. In this course we'll only consider the application of an LRS to roadway networks, they can be used in any linear network including pipelines and hydrologic networks. - Dynamic Segmentation
Dynamic segmentation is closely linked to LRS. In dynamic segmentation, we take the roadway events which are linearly referenced along roadways and transform them on the fly into spatial features. Taken together, LRS and dynamic segmentation allow us to effectively manage and utilize the myriad of attribute information associated with roadway networks. We will explore these techniques in detail in Lesson 6.
We will learn more about these techniques in upcoming lessons.
1.3 Getting to Know a Transportation Organization
This week, you’ll take some time to get to know perhaps the most significant transportation organization in the United States, the U.S. Department of Transportation (USDOT). The USDOT (established in 1966) is a cabinet-level department within the U.S. government which employs about 55,000 people and is responsible for maintaining and advancing the nation’s transportation systems and infrastructure.
A key function of the USDOT is to develop programs which implement transportation-related statutes. One of the most important statutes the USDOT is tasked with implementing relates to the funding of surface transportation. The latest surface transportation statute is known as the Fixing America’s Surface Transportation (FAST) Act, which was signed into law by President Obama in December 2015.
The USDOT is comprised of a number of operating administrations and bureaus, each of which specializes in a specific area of transportation. Some of these divisions, along with the area of transportation they are responsible for, are listed below:
- Federal Highways Administration (FHWA)
Specializes in highway transportation - Federal Transit Administration (FTA)
Provides financial and technical assistance to public transit agencies - Federal Aviation Administration (FAA)
Regulates all aspects of civil and commercial aviation and operates a national system of air traffic control and navigation - Federal Railroad Administration (FRA)
Enforces rail safety regulations and administers railroad assistance programs - National Highway Traffic Safety Administration (NHTSA)
Specializes in reducing vehicle-related crashes
We’ll take a closer look at some of these USDOT divisions in later lessons.
Spend some time looking at the USDOT’s website [7] and try to learn some more about the organization and some of their current initiatives and activities. Also, spend some time learning about the Smart City Challenge which the USDOT kicked off in December 2015. This challenge was designed to promote innovative solutions to some of the biggest challenges our cities face and offered $50 million to the winning city, $40 million of which came from the USDOT and $10 million from a private partner. Here is a video where the USDOT provided information to city mayors across the county. (Note: the presentation doesn't begin until about 10 minutes into the recording and you may want to skip ahead to the 18-minute mark when former Transportation Secretary Anthony Foxx begins to speak).
Video: Smart Cities Webcast (25:14)
KEVIN: Good afternoon. My name is Kevin Monroe, Deputy Assistant Secretary for governmental affairs here at the US Department of Transportation. Now, I want to welcome and thank you for joining us today for a webcast on the Smart City Challenge. Secretary Foxx will be joining us shortly, but right now I'd like to take the opportunity to introduce my colleague, Mark Dowd, Deputy Assistant Secretary for Research and Technology. He will tell us more about the Smart City Challenge. Mark.
MARK: Hi, welcome. I'm going to take you through some of the details for the Smart City challenge to get you oriented as to what we're looking for. We'll be hearing from the secretary shortly. He is extremely excited about this challenge. As a former mayor, he is looking forward to hearing from his fellow mayors as to how to solve the issues that we identified in "Beyond Traffic".
Beyond Traffic, narrative identified the issues of moving people and moving goods, and so we decided that it would be good to reach out to cities and encourage them to put forward their most creative ideas on how to solve those problems using technology and innovation.
I want to take you through a little bit of the schedule. We have two phases: phase one and the most important part is the deadline coming up on February fourth. We are looking for cities to put forward their high-level, thirty-page ideas as to how to solve these issues using innovation and technology. The second phase when we down select to 5 will be we will move through the process of awarding the five finalists 100,000 dollars and selecting the finalist who will receive the 50 million dollars.
I think I'll take you through a little bit of what we're looking for. We are looking for a medium-sized city, although we accept applications from all cities. This is generally what we're looking for, from in terms of particularity. We're looking for a population between 200,000 and 850,000 using 2010 census data, a dense urban population that's typical for a medium-sized city. We're looking for leadership in the city that is committed to carrying this through for the three years of the program. There are a number of different aspects of smart cities that people talk about. We thought we'd talk a little bit about from a smart city perspective what we're looking for in the transportation sector. There are a number of technologies on the left-hand side that will feed into the solutions and then, on the right-hand side are the benefits that we're looking for. We tried to lay out our vision of what of what this would look like and we tried to do it with 12 vision elements that are identified in the notice of funding opportunity. The highest priority is the technology elements that are urban automation, connected vehicles, and sensor-based infrastructure. The second level priority is the innovative approaches to urban transportation and these include the sharing economy, Open Data, urban analytics, connected involved citizens, and smart strategic business partnerships. Lastly are the other three smart city elements that are in each architecture and standards, smart land use, and low-cost, efficient ICT.
In your thirty-page, high-level application, we're looking for certain similarities in all the applications that we lay out what we're looking for in our narrative description. The evaluation criteria which will drive a lot of the narrative that includes a lot of what we talked about earlier, which is including population size, etc.
I think is important to take us through a couple of the critical deadlines that we're looking for. The applications are due on February 4th at 3 p.m., and then once we receive the application, we'll go through a fairly rigorous procurement process to down select to the five finalists. We'll announce the finalists in March 2016. Soon thereafter, we will issue $100,000 to each of the finalists to help them get their applications in in good form to compete for the final award. The final award will be issued in June 2016 to the winning city.
I'm sure you have additional questions or concerns and we'll have various opportunities for you to interact with the department on how to solve those problems and those issues that you have. We have an in-person Smart City forum that is on December 15th here at the Department of Transportation between nine o'clock and four o'clock. We have about 350, 400 people already signed up for this in-person meeting and then following that we'll have a number of technical advisories. We'll do data, architecture, and standards on December 16th, connected vehicles and automation December 17th. We'll discuss sharing economy, user-focused mobility on December 18th, and then we'll help you navigate the smart city challenge application process we'll be out shortly with that announcement.
I'm sure you have questions. Please don't hesitate to send them to smartcitychallenge@dot.gov [8], and we will continue to update our website with additional dates and additional information at transportation.gov/smartcity.
BRYNA: Mark, thank you very much. Stay here. Hi, my name is Bryna Helfer. I'm the Deputy Assistant Secretary for Public Engagement and we just wanna, Mark, I guess I we just want to go back. We've been getting some questions about the elements, and I was wondering if you might just spend a little bit of time talking about your vision for the elements and what goes into some of these elements. If you could, that would be awesome, thanks.
MARK: Sure. So, in urban automation oftentimes when people talk about automated vehicles they talk about it in a singular, linear sense. We actually think that urban automation goes beyond just the urban, beyond the automated vehicle. The moving of goods through automation, the moving of people through automation, and how it interacts with the sharing economy, how it interacts with connected vehicles, and how it interacts with this sensor-based infrastructure that's either in the city already or is being developed by the city. So, the important part about the technology elements is that we're not looking for just another connected vehicle pilot. We're not looking for just an automation pilot. We're looking for how these different technologies work together. The innovative approaches, if you go through them, we have a very lengthy description in the notice of funding opportunity as to what they all mean. But if you look at the connected and involved citizens, it's important that we get through urban delivery and logistics, etc. Finally, the Smart City elements, the smart land use, etc., are very, are described. And those are key elements.
Wanted to introduce Secretary of Transportation now who will talk a little bit about the Smart City Challenge.
SECRETARY FOXX: Hi Everyone, thank you, Mark, and thank all of you so much for joining today's webcast. As you know, yesterday we launched our Smart City Challenge targeting mid-size cities. This is an opportunity for mayors and city leaders to define what it means to be a smart city when it comes to transportation. We're asking cities to submit proposals by February 4th, and our goal will be to narrow the proposals down to five finalists by May and announce the winner in June; the winner will then receive up to forty million dollars to implement their proposal. That's not all. As Mark has probably alluded to already, our partner in this effort, Vulcan, is offering an additional ten million dollars to the winning city. And our hope is that cities will see this as an opportunity to partner with firms like Vulcan, and other innovators that can help them re-imagine their transportation systems.
Let me just talk some about why we are doing this. First of all, we don't have a top-down transportation system in the U.S., we have a bottom-up system, and while we are grateful that Congress passed a five-year transportation bill last week, our national vision for transportation is still in some ways stuck in the 20th century when it comes to thinking about technology, innovation, and the kind of inputs that mayors and local officials think about all the time when it comes to how to integrate transportation and quality of life and, of course, protecting our environment and so many other issues. So, our department is working hard on the national level to create policies and programs and practices that help make it easier for local and state decision-makers to do these things. We're trying to reposition government so we can help you solve problems at the local level. We also want to increase our ability to rapidly absorb technology in the transportation space so we can do things that previous generations could only imagine. So, we're imagining things like connected and autonomous vehicles that practically eliminate crashes. And we're imagining this technology interacting with wired infrastructure to eliminate traffic jams as well, but we're not only imagining it happening, we're making it happen. We're moving quickly to require all new cars to be equipped with vehicle-to-vehicle technology. And, as part of this effort, we also launched a pilot program to demonstrate connected vehicles in three US cities, including New York. We're updating our policy position on autonomous vehicles and we're working to integrate unmanned aircraft into the National Airspace. We even have hired our first data chief data officer. So, we've pushed as hard as we can and will keep pushing at the national level, and now we're hoping to incentivize you at the local level to work just as hard. And, ultimately, we know that the best laboratory we have for emerging innovation and technology is where it is most needed, which is in our cities.
Another forward-looking thing we did was to look at our transportation system over the next 30 years, and this bears directly on all of you on the call. Our report "Beyond Traffic" tells us that we're gonna add seventy million more people to our population over the next thirty years, and it's also telling us that our cities will absorb most of this growth. This is part of the reason it's been said that the 20th century will not be dominated by countries, but it will, in fact, be dominated by the rise of cities and the rise of urbanization in regionalism. Along these lines, the entire world is now having a conversation about smart cities which is really a conversation about what our cities should look like in the future, and now our cities will need to show us. In this challenge, all of you will help define what a smart city is. So, rather than be prescriptive, we want you to be bold. We're asking you to develop your own unique vision, your own unique partnerships, your own unique blueprints, for building the city of the future, and we're putting the ball in your court in giving you the opportunity to demonstrate to the world what a fully integrated, forward-looking transportation network looks like. I want to say this because I know that many of you have been working on your community's vision statements and plans and land use strategies and all sorts of things. This challenge is an opportunity to bring all that together and to make progress. So to everyone joining us for this, I want to assure you that this is not only the beginning of our outreach process; we will continue making outreach happen over the next several weeks. In fact, tomorrow we'll host a smart city forum. Actually, I'm sorry, December fifteenth we will host a smart city forum, and we encourage folks to join us in person, but will also have a virtual option available as well. As I say, we'll have more webinars in the coming weeks. So, I'm looking forward to seeing the proposals that come forth. I'm also looking forward to working with you, all of you to push the boundaries of what is possible. And, with that, I'll turn it back to my team to give you more details and answer any questions you have and with that, thank you very much. It's been great to be with you.
KEVIN: Thank you Secretary Foxx and thank you, Mark Dowd. As the secretary just mentioned, I want to remind you that you can sign up online for the December 15th in-person Smart City forum here at USDOT. He did mention that there will be an online option also. Please go to www.transportation.gov/smartcity [9] that's www.transportation.gov/smartcity [9]. Ladies and gentlemen, thank you very much again for joining us today.
Video: #SmartCityPitch: Columbus (2:35)
ON SCREEN TEXT: In Columbus, we've built an unprecedented culture of collaboration. We've knocked down silos, and built up partnerships to become the Midwest's fastest-growing city. #1 in job growth #1 in population growth. Our culture of collaboration is the Columbus way. It is how $50 million becomes $140 million. We will set the pace for smart city transformation. We will connect hard-working people to jobs. We will lift a low-income community out of poverty. Give students of all ages unprecedented access to education. Give more expectant mothers access to prenatal care, and get more children to Pre-K. Through collaboration, we get things done. By sharing data, and leveraging advanced analytics, we will clear congestion and improve safety like never before. We will demonstrate how a city can leap ahead. You see, we know how to lead (fastest growing city for startup activity in 2015), to collaborate (#1 metro for job growth in the Midwest), to set a bold vision (lead the country in smart mobility), and best of all we know how to deliver results. So, let's transform Columbus. Let's build a connected, cutting edge, sustainable, smart city. Smart Columbus will move America forward. We're ready. All of us. #smartcolumbus
The winner, announced in June 2016, was Columbus, Ohio. I think you’ll agree that their winning pitch (see above) exhibited an impressive use of multimedia.
Take a look at these links to see what's happened since the award was made in June 2016:
- The USDOT published a report [11] summarizing the lessons learned thus far.
- The city of Columbus is maintaining a list of the Smart City projects [12] which are planned or underway.
- Learn how Columbus turned the $50 million award into $500 million [13] by leveraging private investment (also check out the video at the top of the page to see some of their innovative ideas).
1.4 Getting to Know Each Other
One of my goals for this course is to promote meaningful interactions between all of us as we cover topics in GIS-T over the next 10 weeks and to lay the framework for building relationships which will extend beyond the end of the course. Throughout the course, you will have the opportunity to get to know your classmates and me a little better. As a first step, you will create a video autobiography so we can begin to get to know you. In later lessons, you will spend time in one-on-one video chats with your classmates getting to know each other better.
1.5 Webinar for Next Week
Speaker
Our next webinar will be with Mr. Michael Ratcliffe. Michael is Assistant Division Chief for Geographic Standards, Criteria, Research, and Quality in the Census Bureau’s Geography Division, where he is responsible for geographic area concepts and criteria, address and geospatial data quality, and research activities. During his tenure at the Census Bureau, he has worked in both the Geography and Population Divisions, on a variety of geographic area programs, including urban and rural areas, metropolitan and micropolitan statistical areas, and other statistical geographic areas, and has led staff engaged in product development and dissemination. In addition to his work at the Census Bureau, he is an adjunct professor at George Washington University, where he teaches Population Geography. Prior to that appointment, he was an adjunct instructor at the University of Maryland-Baltimore County. Mr. Ratcliffe holds degrees in geography from the University of Oxford and the University of Maryland.
Geographic Areas Used by the Census Bureau
The Census Bureau defines many different geographic areas which can be used to organize and aggregate data. The areas the Census Bureau uses can be divided into those which are legally defined and those which are not. The Census Bureau refers to non-legally defined areas as statistical areas.
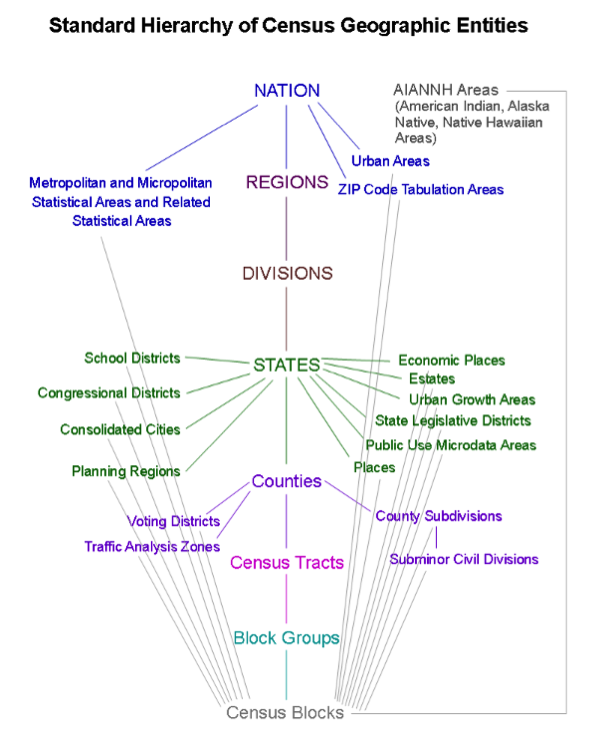
Nation
Metropolitan and Micropolitan Statistical Areas and Related Statistical Areas
Urban Areas
ZIP Code Tabulation Areas
Regions
Divisions
States
School Districts
Congressional Districts
Consolidated Cities
Planning Regions
Economic Places
Estates
Urban Growth Areas
State Legislative Districts
Public Use Microdata Areas
Places
Counties
Voting Districts
Traffic Analysis Zones
County Subdivisions
Subminor Civil Divisions
Census Tracts
Block Groups
Census Blocks
AIANNH Areas (American Indian, Alaska Native, Native Hawaiian Areas)
Metropolitan and Micropolitan Statistical Areas and Related Statistical Areas
Urban Areas
ZIP Code Tabulation Areas
School Districts
Congressional Districts
Consolidated Cities
Planning Regions
Economic Places
Estates
Urban Growth Areas
State Legislative Districts
Public Use Microdata Areas
Places
Voting Districts
Traffic Analysis Zones
County Subdivisions
Subminor Civil Divisions
1.5 Summary of Lesson 1
In this lesson you:
- briefly examined the important role GIS plays in the field of transportation and learned about the manner in which GIS-T is evolving in the 21st century. \
- learned something about transportation modes and the concepts of mode competition, mode shift, and containerization.
- spent some time learning about the role of the USDOT in the transportation industry. .
- aquainted yourself with the speaker and general topics for next week's webinar.
- took the first step in getting to know each other by creating a video autobiography which will serve to introduce you to the rest of the class.
Questions and Comments
If there is anything in the Lesson 1 materials about which you would like to ask a question or provide a comment, submit a posting to the Lesson 1 Questions and Comments discussion. Also, review others' postings to this discussion and respond if you have something to offer or if you are able to help.