Lesson 6: Linear Referencing Systems (LRS)
Learning Outcomes
What will we learn?
By the end of Lesson 6, you should be able to:
- use ArcMap’s Linear Referencing Tools to construct routes from roadway centerline features;
- calibrate the measures along a route based on actual measures made in the field;
- describe the purpose and characteristics of a Straight Line Diagram (SLD);
- create an SLD given event data along a route;
- discuss the key functions of the American Association of State Highway and Transportation Officials (AASHTO);
- discuss some emerging technologies in Intelligent Transportation Systems (ITS) and the objectives and features of traveler information systems;
6.1 Linear Referencing Systems
Last week, we explored the purpose and components of an LRS. This week, you’ll have an opportunity to solidify your understanding by completing some hands-on exercises to create routes, calibrating linear measures along a route, and using dynamic segmentation to convert event tables into event features. You’ll also see how GIS software can be used to reduce the burden associated with the creation and management of an LRS and event data.
6.2 ESRI Roads and Highways
In the past few years, ESRI has been promoting their Roads and Highways product which is designed to provide a fuller featured set of tools for transportation organizations to manage their LRS and roadway event data. A 57-minute introduction to this tool [1] was provided at the 2013 ESRI users’ conference.
Straight Line Diagrams
Transportation organizations capture and maintain a large number of linearly referenced roadway events including:
- Intersections
- Bridges
- Rail Crossings Locations
- Legal Boundaries
- Accidents
- Signs
- Speed Limits
- Average Annual Daily Traffic (AADT)
- Width of the Right of Way
- Width of the Roadway Shoulders
- Functional Class
- Curves
- Grades
- Projects
Displaying more than a few of these on a single map can begin to clutter the map and make it difficult for the user to understand.
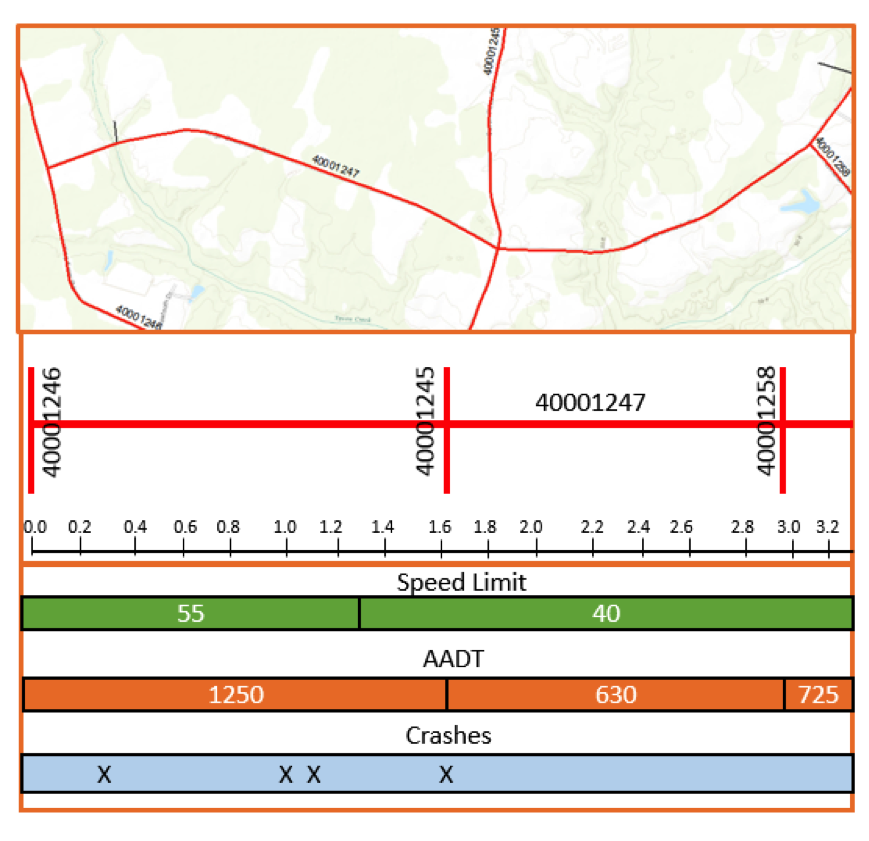
One tool which transportation organizations have used for many years to visualize road attribute information is a Straight Line Diagram (SLD). In an SLD, a roadway section of interest is presented as a straight line along with various roadway attributes or events. Often, these roadway attributes are maintained by separate groups within the transportation organization, and sometimes they are linearly referenced using different LRMs. An SLD brings many attributes together with a uniform referencing method to facilitate visualization of the data and the potential identification of relationships between different data elements.
The specific layout of SLDs varies from one organization to another. One common layout for an SLD includes three components: a map component, a schematic component, and an attribute component. The map component often appears at the top of the SLD and presents the alignment of the route of interest. The schematic component, sometimes referred to as a stick diagram, presents the route as a straight line and can incorporate roadway features such as intersections, bridges, ramp entrances, and exits and legal boundaries. The attribute component includes roadway event data presented along the same horizontal axis. Linear events such as speed limit are displayed as a series of horizontal bars with the extent of each bar corresponding to the region over which the attribute has a constant value. Point events are displayed as point symbols positioned according to their location along the route.
Historically, SLDs were manually created and assembled into books for reference across the organization. Given the effort required to generate SLDs in this manner, the books often reflected data which was somewhat dated. Today, most SLDs are created dynamically from current event data using sophisticated GIS software applications.
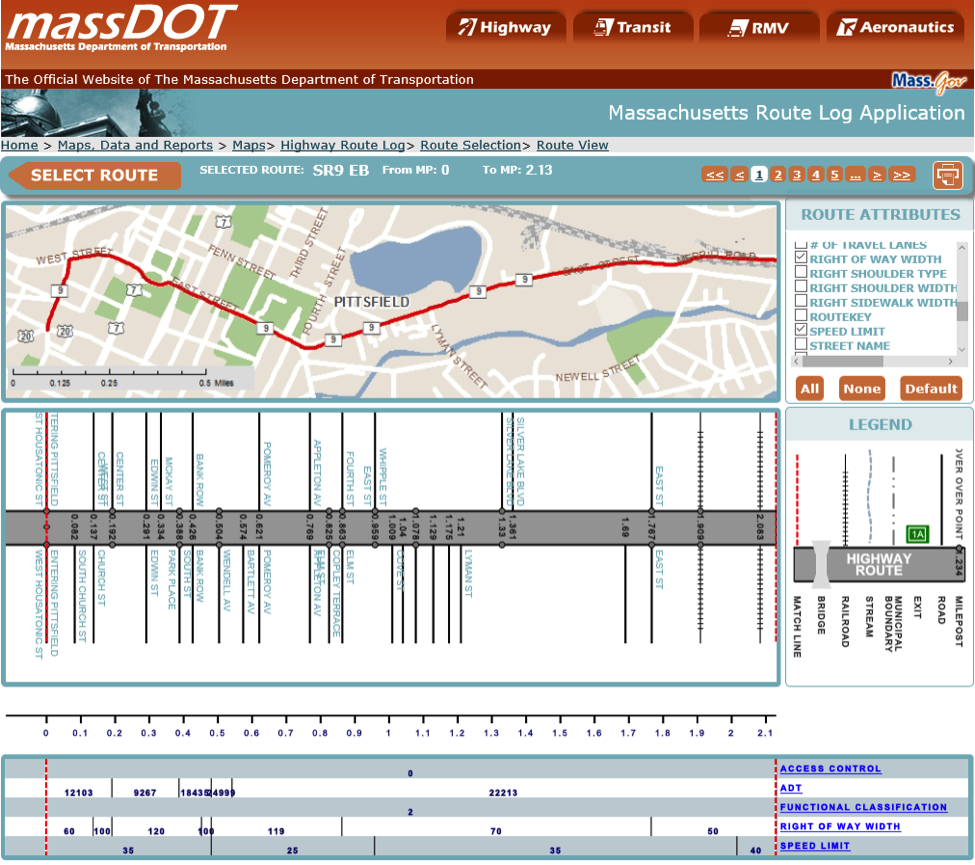
As an example, the Massachusetts Department of Transportation uses a web-based tool called Massachusetts Route Log [2] to generate Straight Line Diagrams (SLDs). Here is an example SLD generated from this application for a portion of State Route 9.
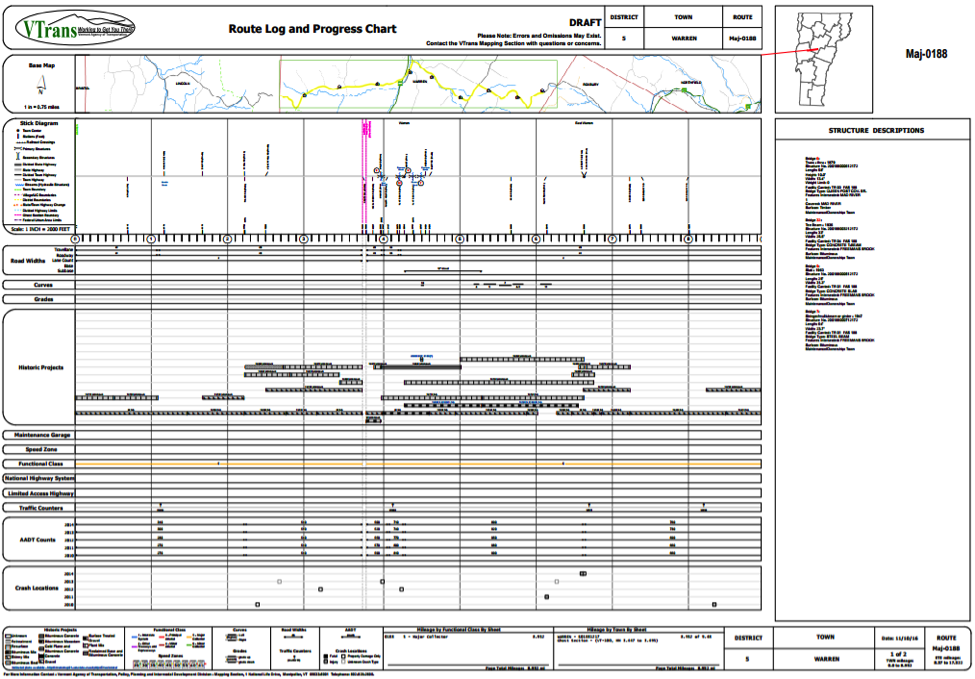
Vermont’s Agency of Transportation (VTrans) has a similar SLD tool called VTrans Routelogs [3].
6.3 Getting to Know a Transportation Organization
This week, you’ll take some time to get to know the American Association of State Highway and Transportation Officials (AASHTO). AASHTO is an association comprised of representatives from the state transportation agencies in all 50 states, the District of Columbia, and Puerto Rico. AASHTO seeks to promote transportation excellence and integration across the U.S. and to foster effective communication and cooperation between the state DOTs and the federal government. Founded over a century ago, it was originally named the American Association of State Highway Officials (AASHO). As with state DOTs, its focus has broadened over the years, and in 1973, it was renamed the American Association of State Highway and Transportation Officials (AASHTO) to reflect the fact that its scope of activities spans all modes of transportation.
AASHTO administers a variety of technical programs. A few of their more significant areas of activity are briefly discussed below.
Standards and Publications
AASHTO establishes technical standards and guidelines which are generally adhered to by the state DOTs in addition to many organizations outside the U.S. It has published many highly respected and widely used reference documents spanning a variety of transportation disciplines including the following:
- A Policy on Geometric Design of Highways and Streets (also known as “The Green Book”)
- The Highway Safety Manual (HSM)
- Standard Specifications for Transportation Materials and Methods of Sampling and Testing
- AASHTO LRFD Bridge Design Specifications.
- Manual for Assessing Safety Hardware (MASH)
AASHTOWare
AASHTO manages a program aimed at providing exceptional enterprise level software to transportation agencies. These products incorporate the experience and expertise of its member organizations and have been developed using pooled funds from state DOTs and the FHWA. The suite of software developed in this program is collectively known as AASHTOWare and its products span 5 core business areas:
- Project
- Bridge
- Safety
- Pavement
- Right of Way
An overview of the AASHTOWare program is provided in this 7-minute video [4]. AASHTO also publishes a catalog of AASHTOWare products [5]. Many of the AASHTOWare software products incorporate varying levels of spatial technology. For example, the bridge products use the Google Maps API for spatial analysis and visualization.
Research
AASHTO is very active in the area of transportation research. A substantial portion of the research AASHTO promotes is carried out by the National Cooperative Highway Research Program (NCHRP).
AASHTO Materials Reference Laboratory
The AASHTO Materials Reference Laboratory [6] (AMRL) develops protocols for testing construction materials and accredits laboratories who test these materials. Many state DOTs require laboratories to be AMRL accredited before they will do business with them.
Centers of Excellence
AASHTO also operates the following three centers of excellence, each of which is designed to provide information and expertise in a specific area of transportation:
- Center for Environmental Excellence
This center focuses on environmental considerations associated with transportation. - National Operations Center of Excellence (NOCoE)
This center focusing on topics relevant to transportation operations. - Build America Transportation Investment Center (BATIC) Institute
This center focuses on funding and financing transportation projects.
6.4 Getting to Know Each Other
There are no one-on-ones scheduled for this week.
6.5 Webinar for Next Week
Speaker
Next week, we will have a webinar with Doug Tomlinson, Chief of Traffic Operations at the Pennsylvania Department of Transportation. Doug's career has focused on various aspects of traffic engineering including work zone traffic control, traffic signals, traffic calming, incident management, ITS, and Traffic Operations. He is currently a Chief of Traffic Operations for PennDOT's Bureau of Maintenance and Operations with a focus on Planning and Operations.
Doug has worked for PennDOT since 1994. He was named ITS PA person of the year by the Pennsylvania chapter in 2013. Doug was a graduate of PennDOT's first Executive Development Academy, as well as a 2008 Graduate of the Operations Academy. Doug graduated Magna Cum Laude from the University of Pittsburgh at Johnstown in 1993 with a B.S. in Civil Engineering Technology.
Intelligent Transportation Systems
Intelligent Transportation Systems (ITS) is an exciting subfield of transportation which encompasses a broad array of technologies. The unifying goals of ITS technologies and systems are to help us use our transportation network more effectively and to allow us to make more informed decisions. One of the most active areas within ITS is in the area of Connected Vehicles and Autonomous Vehicles (CV/AV). Check out this TED talk [7] (4:06) from 2011 on Google's driverless car:
Sebastian Thrun: Google's Driverless Cars (3:59)
As a boy, I loved cars. When I turned 18, I lost my best friend to a car accident. Like this. And then I decided I'd dedicate my life to saving one million people every year. Now I haven't succeeded, so this is just a progress report, but I'm here to tell you a little bit about self-driving cars.
I saw the concept first in the DARPA Grand Challenges where the U.S. government issued a prize to build a self-driving car that could navigate a desert. And even though a hundred teams were there, these cars went nowhere. So we decided at Stanford to build a different self-driving car. We built the hardware and the software. We made it learn from us, and we set it free in the desert. And the unimaginable happened: it became the first car to ever return from a DARPA Grand Challenge, winning Stanford 2 million dollars. Yet I still hadn't saved a single life.
Since, our work has focused on building driving cars that can drive anywhere by themselves -- any street in California. We've driven 140,000 miles. Our cars have sensors by which they magically can see everything around them and make decisions about every aspect of driving. It's the perfect driving mechanism. We've driven in cities, like in San Francisco here. We've driven from San Francisco to Los Angeles on Highway 1.
We've encountered joggers, busy highways, toll booths, and this is without a person in the loop; the car just drives itself. In fact, while we drove 140,000 miles, people didn't even notice. Mountain roads, day and night, and even crooked Lombard Street in San Francisco. (Laughter) Sometimes our cars get so crazy, they even do little stunts.
(Video) Man: Oh, my God. What? Second Man: It's driving itself.
Sebastian Thrun: Now I can't get my friend Harold back to life, but I can do something for all the people who died. Do you know that driving accidents are the number one cause of death for young people? And do you realize that almost all of those are due to human error and not machine error, and can therefore be prevented by machines?
Do you realize that we could change the capacity of highways by a factor of two or three if we didn't rely on human precision on staying in the lane -- improve body position and therefore drive a little bit closer together on a little bit narrower lanes, and do away with all traffic jams on highways? Do you realize that you, TED users, spend an average of 52 minutes per day in traffic, wasting your time on your daily commute? You could regain this time. This is four billion hours wasted in this country alone. And it's 2.4 billion gallons of gasoline wasted.
Now I think there's a vision here, a new technology, and I'm really looking forward to a time when generations after us look back at us and say how ridiculous it was that humans were driving cars.
Thank you.
Video: USDOT - Connected Vehicle: The Future of Transportation (7:29)
Imagine a future where vehicles talk to one another and to critical infrastructure. This connected vehicle technology can change our transportation system as we know it by enabling safe interoperable network wireless communications among vehicles, infrastructure, and personal communications devices. Connected vehicles provide drivers with 360-degree awareness of similarly equipped vehicles within a range of approximately 300 meters. This secure system keeps personal information private and does not track your vehicle. Drivers will receive warnings that inform them of potential hazards through a visual display, seat vibration, or tone. These are only warnings. The driver remains in control of the vehicle at all times. However, the technology can also support limited automated functions in which the driver only cedes partial control of the vehicle. Warnings can help drivers respond quickly to avoid potential crashes. For example, the intersection movement assist application warns drivers when it is unsafe to enter an intersection. The do not pass application warns drivers when it is not safe to pass a slower moving vehicle. The emergency electronic brake light application notifies the driver when an out-of-sight vehicle several cars ahead is braking, and imagine the value of this blind spot warning application which lets this commercial driver virtually see what's happening in his or her blind spot. Connected vehicles can communicate with smart roadside infrastructure like rail grade crossings to alert drivers when a train is coming even if the driver cannot see or hear the approaching train.
Connected vehicles can help with weather-related traffic and safety issues too. This is especially true with conditions such as black ice, where the weather may not appear to be dangerous, but the roads are slippery. Information collected from multiple connected vehicles can help determine when a potential hazard exists such as icy roads and warn drivers before they experienced them. Road weather data from the vehicles can be sent to traffic management centers or TMCs providing detailed, real-time information to help monitor and manage transportation system performance. The centers can then take actions like adjusting traffic signals and speed limits, notifying maintenance crews, dispatching maintenance vehicles to the road, and broadcasting warnings for motorists. Motorists can get real-time road weather information from in-car displays by dialing 511 or by listening to highway radio stations. Motorists will be able to get road weather information on their personal devices before leaving home.
Connected vehicles can even help us to reduce our carbon footprint and facilitate green transportation choices. Eco lanes are similar to today's HOV lanes, but with a big difference. Motorists in these lanes agree to drive eco-friendly vehicles and drive at a speed that conserves fuel. Drivers will be alerted about the proper speed with dynamic message signs.
Connected vehicle applications can help vehicles to reduce idling and unnecessary stops by communicating with smart traffic signals. Traffic signals broadcast data about their current signal phase and timing and systems inside the vehicles use the data to determine speed advice for drivers. Drivers could then adjust their vehicle's speed to pass the next traffic signal on green or slow down to a stop in the most eco-friendly manner, thereby saving fuel, reducing emissions, and saving drivers money. Connected vehicles can enhance awareness of unexpected roadside incidents like disabled vehicles, car crashes, police activity, and first responders caring for crash victims. Incident zone warnings will alert drivers about incidents ahead and warn them to slow down and change lanes. Communications could also be sent to first responders at the scene via shoulder radios to warn them of the danger of approaching vehicles. Connected vehicle technology can help control traffic flow and reduce the resulting congestion at accident sites before it gets out of hand.
With millions of connected vehicles, our ability to share robust data with each other and with smart infrastructure will continue to improve traffic flow, enhance coordination with transit, and make our communities even more safe and livable. The connection protection application gives public transportation providers and travelers the ability to communicate two ways. The connected network gives passengers real-time transit information so they can more accurately predict whether they will make their next connection. If multiple people on a delayed bus will miss their next connection, transportation providers can adjust bus departures to enable the passengers to make their next connection. Dynamic ridesharing applications make the logistics of ridesharing, scheduling, reliability, and communication easier by connecting vehicles and handheld devices. Applications do the matching for us, authenticating users and connecting riders with drivers. The co-operative adaptive cruise control app helps drivers avoid stops and starts, which can also help conserve fuel and improve traffic flow. And the queue warning app monitors traffic data to detect stretches of slow-moving traffic and warn motorists to reduce speeds to avoid potential rear-end collisions.
Connected vehicle technology can help pedestrians, too. For example, the mobile accessible pedestrian signal system app sends an automated pedestrian call from the smartphone of a pedestrian with disabilities to the traffic controller holding the walk signal until the pedestrian has cleared the crosswalk. This application also alerts drivers of the presence of a pedestrian with disabilities at the crosswalk.
The potential benefits of a connected transportation system, one that is able to enhance safety and mobility and address environmental impacts are wide-ranging. They will be felt by every one of us, enhancing the livability of our communities and ultimately making our transportation safer and smarter. Imagine the possibilities.
Traveler Information Systems
An area of ITS which has become very popular in recent years is traveler information systems. These systems disseminate real-time information to travelers in order to allow them to make more informed choices. These systems commonly contain the following types of information:
- Traffic and road conditions
- Construction projects
- Planned events
- Camera video and images
- Incidents
- Weather information
Traveler information can be disseminated by a number of methods including via Highway Advisory Radio stations (HAR), Variable Message Signs (DMS) and 511 websites, mobile applications, and IVR systems. On July 21, 2000, the Federal Communications Commission designated a single 3 digit number (511) which could be used anywhere in the nation to obtain traveler information. Implementation of the services themselves was left to states and local agencies.
The Federal Highways Administration (FHWA) hosts a 511 Travel Information Telephone Services [8] website which shows the locations in the U.S. which provide 511 telephone services. As you can see from this site, most states in the U.S. operate a 511 information service. If you click on any location with 511 telephone services, you'll be given more information about the 511 services of that state/location. You'll notice that there is a “backdoor” number you can use to call 511 in a state even if you are not in that state. The information provided also gives the link to the corresponding 511 website if there is one.
6.6 Summary of Lesson 6
In this lesson, we explored how GIS tools can be used to help maintain an LRS and event data. We also examined dynamic segmentation, a process used to convert event data into event features, and some very useful diagrams known as Straight Line Diagrams (SLDs).
Our transportation organization of the week was AASHTO. We reviewed some of the important roles AASHTO plays in establishing policy, producing important guidance documents, conducting and promoting research, and in creating exceptional software products for a number of functional areas in transportation.
In our weekly webinar, we had the chance to interact with Bill Schuman, Sr. Vice President of Project Delivery for Transcend Spatial Solutions, and benefit from his expertise and many years of experience in the area of LRS. We also had the opportunity to interact with Derald Dudley, a geographer and computer scientist with the USDOT's Bureau of Transportation Statistics (BTS).
In preparation for next week’s webinar, we also spent some time learning about intelligent transportation systems and, in particular, traveler information systems.
Questions and Comments
If there is anything in the Lesson 6 materials about which you would like to ask a question or provide a comment, submit a posting to the Lesson 6 Questions and Comments discussion. Also, review others’ postings to this discussion and respond if you have something to offer or if you are able to help.