Lesson 7: Highway Safety
Learning Outcomes
What will we learn?
By the end of Lesson 7, you should be able to:
- explain how traffic safety analysis is moving beyond traditional approaches which have focused solely on historic crash data;
- navigate the Fatality Analysis Reporting System (FARS) and perform ad-hoc queries of the data it contains;
- use crash data extracted from FARS or other state crash data systems to visualize and analyze the data in ArcGIS;
- list some of the uses and benefits spatial technologies offer in the area of highway safety;
- describe some of the goals and objectives of the National Highway Traffic Safety Administration (NHTSA);
- submit a review of Pennsylvania's 511 Traveler Information System;
- discuss the purpose of the Highway Performance Monitoring System (HPMS) and the requirements it imposes on state DOTs;
- share something you learned about one of your classmates and/or some ideas you discussed with a classmate about the content of this week’s lesson.
7.1 Highway Safety
Highway safety is an important area of focus for state DOTs and the USDOT. There are few groups within the USDOT who are focused on improving highway safety. The first is the Office of Safety. The Office of Safety is comprised of two units. The Technologies Unit deals with safety-related highway design considerations and technologies which can be used to improve highway safety performance. The Programs Unit oversees federal and state safety programs. One of the key programs they administer is the Highway Safety Improvement Programs (HSIP). HSIP is a federal-aid program designed to provide funding to states for projects aimed at reducing fatalities and serious injuries on qualifying roadways. In 2016, the program provided about 2.2 billion dollars to the states for safety projects.
| Fiscal Year | 2016 | 2017 | 2018 | 2019 | 2020 |
|---|---|---|---|---|---|
| Estimated Funding* | $2.226 B | $2.275 B | $2.318 B | $2.360 B | $2.407 B |
Reference: FHWA Website [1] accessed 12/31/2016
To qualify for HSIP funds, a state is required to develop and maintain a Strategic Highway Safety Plan (SHSP). An SHSP is designed to guide the investment of funds to projects which have the greatest potential to reduce fatalities and serious injuries. To qualify for HSIP funds, states are also required to identify their priorities using a Data-Driven Safety Analysis (DDSA).
The second group within USDOT which is responsible for highway safety is the National Highway Traffic Safety Administration (NHTSA). NHTSA is an administration within USDOT whose mission is to reduce crash fatalities and injuries. We’ll take a close look at NHTSA later in this lesson.
State DOTs commonly collect and use crash data to identify areas of their roadway networks where there are unusually high crash rates. However, looking at crash data alone can be misleading and result in a less than optimal use of available state and federal dollars. To address this problem, AASHTO, in conjunction with the FHWA, developed the Highway Safety Manual (HSM), a document which many consider the definitive reference on highway safety. The HSM offers a comprehensive and balanced approach and set of tools which consider operations, the environment, and the cost of construction alongside safety considerations. A good overview of the HSM can be found here. [2] The approaches provided in the HSM go beyond traditional approaches to identifying priority locations for safety improvements which rely solely on crash history data.
There are two fundamental problems associated with using crash data alone. First, crashes are statistical events and as such don’t occur at regular predictable intervals. Consequently, crash data alone can sometimes lead an agency to falsely identify sections of a roadway as high risk and, conversely, sometimes overlook a risky section. The second problem of looking solely at historic crash data is that it disregards the dependence of crash frequency on traffic. As traffic levels increase on a section of the roadway due to changing travel patterns, crash rates can increase. To overcome these limitations, it is necessary to look not only at historic crash frequencies but also at expected crash frequencies based on roadway characteristics and traffic data.
Tools have been developed which implement the approaches defined in the HSM. These include AASSHTO’s Safety Analyst and FHWA’s Interactive Highway Safety Design Model (IHSDM). However, states often lack much of the data required to effectively use these tools, such as horizontal and vertical curve data. Horizontal curves are roadway curves that turn to the left or right, and vertical curves are roadway peaks/hills and valleys. For my Capstone Project, I used roadway centerline data to extract horizontal curvature data from Pennsylvania’s roadways. I gave a lightning talk on the project at Penn State in November 2016 for GIS day. My presentation was just under 10 minutes in length (embedded video below).
Host: JD are you ready?
Host: Alright! JD Kronicz will be our next speaker and he will talk about using GIS to identify and characterize horizontal curvature. JD has worked as a consultant for over 25 years serving clients in the scientific, environmental, transportation, and manufacturing industries. For the past 15 years, he’s been primarily focused on GIS software applications for transportation. He works closely with the Pennsylvania department of transportation and he also teaches in Penn States online geospatial program.
JD: Good afternoon. Today I have the pleasure of talking to you briefly about some work I did using GIS to identify the horizontal curvature in the roadways.
So, curves, as one might guess are an important feature of roadways when it comes to highway safety. Surprisingly, many state DOT’s, departments of transportation, don’t have good inventories of their roadway curves. Often if they have curvature information it’s embedded on engineering diagrams or other plans and really not in a format that is readily accessible for highway safety analysis. So, in this project I basically focused on trying to extract that information and producing an inventory of Pennsylvania’s horizontal curves from roadway centerline data which is data all state DOT’s have.
Now, it’s a priority of state DOTs to make sure that their roads are safe and to constantly try and improve safety. Generally, is what they’re trying to do is their trying to use the limited amount of safety dollars to apply to those roads that would best benefit, where they could make the biggest impact and get the biggest bang for the buck. The question is, how do they identify their priorities? And there’s really two different ways you can approach the problem.
The first, is by doing crash analysis. States all have good data on their crashes, and you can use the crash data to identify areas where there are high crashes and, in that manner, identify your priority sections of roadway. That’s a reactive approach and it may be erroneous because it could just be an anomaly, it might not represent a section of roadway that inherently has safety issues.
The other approach is to do a systemics analysis of the roadways where you’re looking at the characteristics of the roadways and your calculating the expected crash rates based on features of the road such as curvature features.
Either way once you identify the priority sections of roadway you want to improve safety on you can implement any one of many many counter measures or safety improvements. So here I’ve just shown a few and I could probably put together 100 but for example, center-line rumble strips, high friction surface treatments are just a couple.
Ok, so before I get into what approach I used, just a little bit on the geometry of the horizontal curve, this is kind of a complex figure but really all we’re interested in is 3 parameters when it comes to horizontal curves. We’re interested in the radius of the curve; we’re interested in the length of the curve and we’re interested in the central angle of the curve: the number of degrees in which the curve turns. So those are the 3 parameters we’re interested in and given any 2 of those parameters we can derive the 3rd.
So, the approach that I used was I started with roadway centerline data for Pennsylvania and I basically took each road feature and deconstructed into its ordered series of vertices which is basically what it represents and then for each pair of vertices I determined the straight line that went through those vertices and determined the baring angle, the angle between that straight line and the positive x-axis.
And then I continued to do that for each pair of ordered vertices in sequence. Basically, looking at how that baring angle changed and anytime the change in baring angle exceeded a certain threshold value I threw up a flag and said we’re in a curve. So that’s how we determined the start of the curve and continuing that process stepping through the vertices and when we get to the point where we drop below that threshold value, we know the curve ended. Any by aggregating the change in baring angle we can calculate the central angle of the curve; we can calculate the length and from those two we can derive the radius.
Again, if we had a little bit more time, we could get a little bit more detail on what the approach was but at the end of the day, by using this technique we can establish curve features that have attributes of radius, central angle, length, etc.
Now to do this sort of process manually would be extremely time consuming so I derived a, I created a program in python, implemented that as a custom toolbox in ArcGIS and named it curve detective. Essentially, it automates that algorithm I just kinda walked you through.
So, here’s an example of an output of that tool. You can see super imposed or layered on top of the roadway network we have this new curve feature class that this tool created. Each curve in red, labeled according to central angle and radius.
I then went ahead and processed, once I established it worked okay, I processed all the state roadway in Pennsylvania. So, in Pennsylvania, the state actually owns roughly 45 thousand miles of roadway. There’s a lot more roadway that’s local roads but the state actually owns and maintains about 45,000 miles of roadway. In order to process this roadway, it took the tool about 2 hours and it ultimately identified 170,000 or so horizontal curves.
Then I went ahead and I wanted to make sure that the output of the tool was legitimate, that it was accurate and precise so I went ahead and found locations that had been survey in the field and presumably had good data on the curves and then compared those engineering diagrams which is where that data is embedded to the results of the curve detective. Without getting into any great detail with you I found that the tool was very accurate and reasonably precise.
Ok, so at this point I had identified, or created an inventory of horizontal curves in Pennsylvania, and I wanted to basically see what could I learn by using the crash data we have in Pennsylvania and combining the two, just to see how crash rates differ on curves and I created a little tool on Microsoft access where I brought these two data sets together that allowed me to perform a bunch of analyses and I did conduct a number of analyses, I’ll just walk you through a couple briefly.
So in the first one I basically just looked at all the road sections in Pennsylvania that have a horizontal curve based on the output of the curve detective and I looked at the number of crashes, the crash rates on those sections of roadway and compared them to crash rates on straight sections of roadway and what I found is that one curves the crash rate is about 2.3x higher than on straight sections of roadway. I then went ahead and limited the crashes I was looking at just to crashes that involved fatalities. And when we just limit it to fatal crashes, we see that the crash rate is 2.8x times higher on the curved sections of roadway than it is on straight sections of roadway. So, not only are crashes more frequent on curves, they’re generally more serious.
I also looked at, I wanted to see the relationship between the central angle of the curve and the radius of the curve and the crash rate so I ran a series of analyses at various central angles, various radii and what I saw was there was little or no relationship between central angle and crash rate which was kind of intuitively surprising to me but there was a very strong relationship between radius and crash rate. So, as the radius of the curve got smaller, especially as it went below 1000 feet in radius the crash rate dramatically increased. So, on the vertical axis there we have crash rate, on the horizontal axis we have radius. So, you can see as the radius decreases the crash rate shoots up, each data series here corresponds to a different central angle and you can see there’s really no discernable relationship there.
So, in conclusion, this is a technique that can be implemented by any state DOT because state DOT’s all have roadway centerline data, it’s a technique that’s very rapid, it’s cost effective and it can produce a highly accurate and precise inventory of a state’s horizontal curves. In looking at the Pennsylvania crash data in conjunction with this horizontal curve data we saw that the crash rates on curved sections of roadway are a lot higher than they are on straight sections of roadway. And in addition the crashes that do occur on curves, they tend to be much more series or fatal, much more frequently than they are on straight sections of roadway and with that I will thank you for your time and if you have any questions I’d be happy to take them.
Two model frameworks have been developed to help states structure the crash and roadway data needed for highway safety analyses in a standard format. The first is the Model Minimum Uniform Crash Criteria (MMUCC [3]). MMUCC is a list of standard crash data elements and associated definitions developed by NHSTA. While the implementation of this model is voluntary, states are encouraged to adhere to the standard in collecting and compiling crash data. Similar in concept to the MMUCC, the Model Inventory of Roadway Elements MIRE [4] is a list of over 200 roadway and traffic data elements critical to safety management developed by the FHWA.
Collecting roadway data according to the MIRE model will not only benefit the state DOT in regards to traffic safety efforts, it will also help other core areas of transportation such as operations, asset management, and maintenance.
Countermeasures
Once a section of roadway has been identified for needed safety improvements, an agency needs to decide which types of countermeasures would be the most effective. There are many types of safety countermeasures that could be implemented. Here’s a list of 20 proven countermeasures [5] published by FHWA’s Office of Safety.
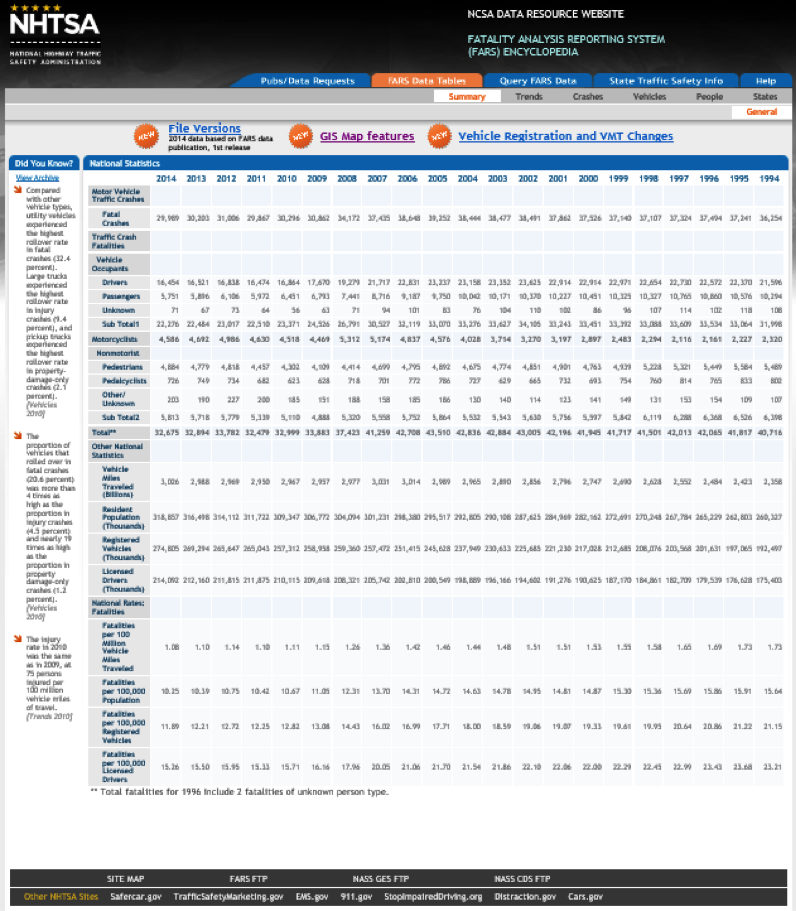
7.2 The Fatality Analysis Reporting System (FARS)
FARS [6] is a system used to collect, store and analyze fatalities on U.S. roadways. The system is administered by the National Center for Statistics and Analysis (NCSA) which is part of the National Highway Traffic Safety Administration (NHTSA). The system includes data from all 50 states, the District of Columbia, and Puerto Rico. The primary purpose of the system is to monitor the effectiveness of vehicle safety standards and highway safety programs which are implemented at the state level. Only crashes which result in at least one fatality and occur on a roadway which is open to the public are included in FARS.
Pennsylvania Crash Information Tool (PCIT)
Some states make crash data available to the public and other interested parties via a web portal. As an example, Pennsylvania makes crash information available via the Pennsylvania Crash Information Tool (PCIT) [7].
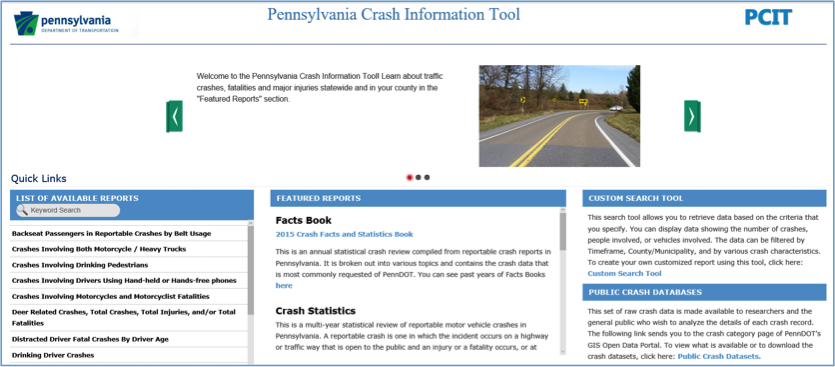
Many of the reports on this site are similar to those in FARS. PennDOT is in the process of adding mapping capabilities to the next version of PCIT scheduled for release in the spring of 2017. Similar to FARS, PennDOT also makes raw crash data available. The PCIT site simply guides users to the PennDOT’s GIS Data Portal [8] for this data.
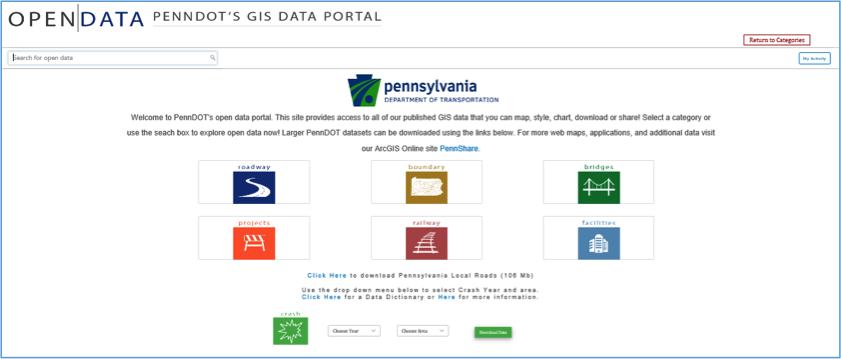
Pennsylvania crash data is available from 1997 to 2016. Differences between the FARS crash data and PennDOT’s crash data include:
- crash data from PennDOT include all reportable crashes and not just fatal crashes;
- crash data from PennDOT include many more attributes or “flags” which can be used to filter the crashes;
- PennDOT’s GIS Data Portal provides very limited querying options (year and county only) and, consequently, the burden is on the user to filter the data to meet their needs.
GIS Uses and Benefits in Highway Safety
As we learned in Lesson 6, spatial technologies are used to locate crashes and perform crash analysis to locate crash hotspots, otherwise known as crash clusters. Spatial technologies also play a critical role in expanding network screening to include roadway characteristics and traffic data in addition to historic crash data as called for in the HSM. Spatial analyses not only help in identifying priority sections of the roadway for safety improvements, but they can also be used to determine the countermeasures which are most likely to be effective and to assess their impact once they have been in place for a period of time. Finally, and perhaps most importantly, GIS plays a huge role in vehicle to vehicle communications and autonomous car technologies. These initiatives promise to have revolutionary impacts on highway safety and make the goal of 0 fatalities seem not so far-fetched.
Optional Reading
In August 2013, FHWA published a document titled Assessment of the Geographic Information Systems’ (GIS) Needs and Obstacles in Traffic Safety [9]. In the document, FHWA identified some of the challenges states face in collecting and integrating crash data in addition to some of the opportunities GIS offers to address these issues.
7.3 Getting to Know a Transportation Organization
This week, you’ll take some time to get to know the National Highway Traffic Safety Administration (NHTSA - pronounced "NITS-uh”). NHTSA is an agency within the USDOT responsible for reducing deaths, injuries, and economic losses resulting from motor vehicle crashes. The agency was created by the Highway Safety Act of 1970 to administer programs that had previously been the responsibility of the National Highway Safety Bureau.
Dr. Mark Rosekind was the NHTSA Administrator under the Obama administration. Take a look at a 37-minute presentation (below) he gave at the Original Equipment Suppliers Association [10](OESA) 2016 annual meeting. Also, spend some time reviewing NHTSA’s 2016-2020 strategic plan titled “The Road Ahead [11]”.
Video: NHTSA Administrator Dr. Mark Rosekind's presentation at OESA Annual Conference, Nov. 2, 2016 (37:36)
NHTSA Administrator Dr. Mark Rosekind's presentation at OESA Annual Conference, Nov. 2, 2016
PRESENTER: Please help me welcome Ann Wilson.
[APPLAUSE]
ANN WILSON: Good morning, everybody. And thank you, Julie. I also want to thank the board members of OESA and the entire membership for allowing me to participate in this great event today.
So let's take a look at this. Safety regulations, V to V, automated vehicles, AEB, NCAP, energy policy, cafe and emissions requirements, cybersecurity, NAFTA, new trade proposals with Asia and Europe, and IP protection. These are just some of the issues that are affecting the members of OESA as I stand before you today. These are issues that'll affect us this year and in the year to come.
Today I want to take a few minutes and focus on three of these issues. Safety, technology, and jobs. First, let's talk about safety.
Let's be very clear about this. All the suppliers gathered in this room are committed to safety. And that commitment has taken on a real sense of urgency nationwide.
We are witnessing a very troubling trend. In 2015, over 35,000 Americans lost their lives on the nation's highways. This was over a 7% increase over the previous year. But if you take a look at the National Highway Traffic Safety Administration's data for the first six months of this year, that increase continues with a 10.4% increase in fatalities for the first six months as compared to 2015.
We all know that automated vehicles will transform transportation. This is especially true when 94% of vehicle crashes are caused by human error.
For those of you who've never heard that statistic before, again, think about that. 94% of vehicle crashes are caused by human error. The promise of virtually eliminating motor vehicle crashes and expanding personal mobility to more individuals and will dramatically shift how society sees transportation.
And make no mistake about it. The members of OESA are at the forefront of this transformation. Our industry is reviewing the automated vehicle policy that was released by NHTSA in September, and we are preparing official comments for submission on November 22.
In our comments, we will be advocating for a balance that provides opportunities for suppliers to work with OEMs on innovation and not stifle it. We are heartened to see the agency create a model state plan that should go a long way in providing a federal road map rather than multiple and differing state laws.
In addition, NHTSA is also focusing on an opportunity for expanded use of the exemption interpretation process. And I know this sounds like legalese to many of you, but this could be a great benefit for emerging technologies to get needed on the road experience.
We are also anxiously awaiting the final decision by the Obama Administration to update the new car assessment program, or NCAP, to include advanced driver assistance programs. The safety benefits of these systems could be immediate because these vehicles and these technologies are on the road now. MEMA studied last year with BCG-- estimated that 10,000 lives could be saved every year if the fleet had a widespread adoption of these technologies.
So let's move, then, to technology. NHTSA last week released a document that I would encourage each of you to read. It's a cyber security best practices for modern vehicles. It is only about 25 pages long. It is actually a fairly approachable document and I would encourage you to read it.
The document states in no uncertain terms that suppliers and OEMs are required-- required to ensure the systems are free of unreasonable risk of motor vehicle safety, including those that may result due to the existence of potential cybersecurity vulnerabilities. This goes on to outline their objectives for the industry including implementation of proactive and preventive measures, real time hacking detection measures, and real time response method assessment solutions.
NHTSA expects the entire industry, particularly all manufacturers developing or integrating safety critical systems, to take part in these efforts. This is not an OEM or a tier one supplier issue only. NHTSA has made it clear that the entire industry, all suppliers, vehicle manufacturers, aftermarket and new technology providers, have a role.
Your DC team is working closely with Brian Doherty, the MEMA CTO and drafting comments to the best practices. But I would also encourage each of you, just as Julie was encouraging you before, to be involved in these discussions.
Finally, let's discuss jobs. MEMA just completed with IHS an updated economic footprint study for the United States. The results were not surprising, but they are remarkable.
Motor vehicle suppliers directly employ over 871,000 Americans. Of that number, 524,000 are jobs that are directly tied to light vehicle manufacturers.
So those of you who have been patiently listening to me discuss automated vehicles and cybersecurity and are thinking that is not what is utmost on your mind, think of those job numbers. How did they impact the US workforce?
Is it worker training? Is it new requirements? Is it job retention? Is it trade? And let's work together to address those issues.
So thank you for your attention to me. But then I want to move on to the reason why we're all here today.
This morning, I have the great honor of introducing the administrator of NHTSA, Dr. Mark Rosekind. Dr. Rosekind is going to give us the benefit of some of his thoughts on some of the issues that I've discussed and a few more, I'm sure.
And then we will have a chance to take some of your questions. And I hope you keep them coming in. We could have a good dialogue about what's to come. So please join with me in welcoming Dr. Mark Rosekind.
[APPLAUSE]
MARK ROSEKIND: Good morning. The full intro is I'm a sleep scientist by training, so when I come in for a morning session and I say good morning and I only hear three voices, either more caffeine or something else. You ready? Let's do it one more time. Good morning.
AUDIENCE: Good morning.
MARK ROSEKIND: Great. Thanks for being here. What I'm going to do is cover three things this morning. I'm going to talk about the safety challenges which Ann just did a great job, but I'm going to be even more specific about the numbers. It's the context for why NHTSA has focused on some of the specific activities we'll talk about this morning.
Second, we're going to talk about our three lanes to get to zero fatalities on our roadways. And then three, we're going to close with talking about what the opportunities are.
Before I do that, something that I always get in trouble for because I can't tell where they are is if you would just join me for a moment, I want to introduce-- we have a very senior NHTSA team that's here. Would you stand because I know you're in the room?
Thank you very much. There's Nat, Allison, and Paul Hemmersbaugh, associate administrator, our director of government affairs, and chief counsel. I say that because afterwards with questions, senior leadership at NHTSA. I hope you get a chance to engage with them, please. Thank you. I'm in trouble later.
Ann's already got us started with this, but there are some numbers that everyone at NHTSA knows, starting with this one. 35,092, the number of lives that were lost on our roadways in 2015. Everybody knows that exact number because every one of those numbers is a father, mother, brother, sister, co-worker, friend. Every one of those is an individual life that we cannot bring back.
Why this is so significant is because last year we clearly have identified an immediate crisis. So Ann mentioned this. Last year, 7.2% increase in the number of lives lost. That is the largest percent increase in 50 years that we've seen on our roadways. Just to put it in perspective, over the decade before that, we saw a 25% drop in lives lost.
What does that mean? That means last year we lost 1/3 of that progress in one year. So far, the six month estimate, which again, these numbers come from us, we're looking at a 10.4% increase for the six month number. This is immediate crisis that we have to deal with. But one of the challenges we have is also look at this as a long term challenge as well, which we will talk about.
This is the number-- Ann mentioned this. NHTSA data clearly shows when you look at the last event, the last cause right before a crash occurs, 94% of the time, it's the human. This is part of the reason there is so much excitement about the technology innovation that's going on.
Can we get to all of that 94% through technology? Unknown. But the key is, look how large that opportunity is.
And just to give some perspective on this, and you folks know it, so that leaves us 6% of the other crashes. So all of you know the headlines related to defects, recalls, et cetera. What percentage of crashes does that account for?
If human behavior, human choice, human error, is 94%, how much is related to defects and recall issues? Anybody know? 2%. Why do I tell you that?
Because that 2% sure gets the headlines, right, while the 94%, which is mostly us because we're all brilliant drivers-- it's the other folks we have to worry about. But it's the 94% that really represents the opportunity where these advanced technologies can really make a difference for us.
When you think about it, though, what's the only acceptable goal for us? It really is zero. And especially as my clock is ticking down, I get more bold and basically say, there really is morally, aspirationally, no other goal we can have. No one has a right to decide, above zero, what would be acceptable. Only zero is acceptable.
The challenge is, when are we going to get there? And what do we do to actually get there? And we're going to talk about NHTSA's three lanes in just a moment.
So one of the things that we've done over the last couple of years is basically work in these three areas. And so I'm going to go through each one of these briefly to give you a sense of the activities that are going on. And one of the ways that I'm going to end, I'll tell you now, we are in this together. And so when I say industry, it is everybody.
So Ann, and Julie, sometimes when they talk, it's like, do we-- where do we need to highlight the supplier side? You're just included, folks. There is no exception for you. You're just included. This is the entire industry and you are part of it, which is why talking about this stuff with you here is just a great opportunity.
So let's talk about proactive vehicle safety just to start with. And what I want to do is just highlight-- in the last couple of years, we've tried to make this very dramatic change. For 50 years, NHTSA and the industry has mostly been reactive, right? And that's what you see up here, is the traditional approach.
So what you're going to try and do is survive the crash, mitigate it if you can, as opposed to the proactive approach which is a transition we've made over the last couple of years, and that is basically avoid the crash altogether. Prevent it. So I'm not going to go through all of these, but the whole idea, again, don't fix the defect after the fact. Instead, you want to prevent. That's what proactive is.
So proactive vehicle safety is something that's under way. I say that because we've already seen some really great successes. Many of you are familiar with our proposals to upgrade NCAP. That started at NHTSA in 1978, and really, it's been enhanced a bit. But really what we've done is proposed the most significant upgrade to that program in almost 40 years.
One of the things we did was put an emphasis on 100% recall completion. A point we have made is that if you identify a defect but you don't get those remedies in place, you still have a problem. The safety risk will continue to exist. And part of the problem previously, of course, is that everyone said, well, 70% is the average. What do people go for? They went for the average.
And I bring this up because just two days ago, we put out a press release. Volvo commercial trucks, 16,000 vehicles with a steering column problem, extremely severe. And after about nine months with FMCSA, with NHTSA, they had 100% recall completion on those 16,000 vehicles before any negative outcomes. No bad crashes, no injuries, no fatalities, all of that done before anything bad happened.
So it can be done. And that's why, literally a press release a couple of days ago, to highlight the success there.
The other thing I just want to highlight here-- AEB, really important. Automatic emergency braking. Because what did we do? September 11 we challenged the industry and said, what can you do to try and make that a standard technology on vehicles?
This is democratizing these technology advances in safety. Rather than just have it a high priced option on our high priced cars, how do we make it standard? We announced that in September, but then in March was able to actually bring forth 20 global automakers representing 99.6% of the new market, are going to make AEB standard by 2022.
Why that's so significant is that was without a regulation. And that is most significant because regulation probably would have taken us three to four years longer. You can count the lives saved, injuries prevented, crashes prevented, by coming out with that collaborative approach rather than waiting for the regulation.
And so another point is the 18 of those global automakers have also come together for some proactive safety principles. And they've been applied already, things like 100% recall, collaborating on cybersecurity.
Let's talk about the second lane, highly automated vehicles. You really can't look at any media today and miss this, right?
So what I want to highlight here, though, is this really epitomizes the proactive approach. The top there is survive it, mitigate it. The bottom is avoid a crash altogether. And that's what we're seeing now.
One of the things that's in the policy I'm going to talk about in just a moment is we have adopted basically to say, let's have the five levels of SAE automation. They're changing recently. But there used to be a NHTSA scale, an SAE-- now it's all SAE.
But I put this up because one of the things that's critical for everybody is to realize, when folks start talking autonomous vehicles, new technology, there's all kinds of different pieces to that. That's what this is and the next slide show you.
There are five different levels of automation. And they represent not just how the human's involved, but how much the operating system, the car, is monitoring the vehicle as well as the environment.
And I put this up because one of the classic questions is, when are autonomous vehicles going to be on the road? People love to forecast this, et cetera. And one of the things I like to say is this stuff is already here.
So for example, here are nine different technologies that are already available on vehicles. I'm not going to review all these, but when you think about it, when is this technology coming? It is already here.
And what's interesting is these are just nine different ones that are available now. So again, when you say, when is autonomous driving here? Well, a level five fully autonomous that you can go to a dealer online and buy one? That's not here. And I love watching everybody predict when it will be. But we'll see how that turns out.
But I put these nine up because I also wanted to highlight, there's all kinds of other technology innovation going on, like this. A driver alcohol detection system for safety. So here's the 10th one. This has gone from research-- we've just spent some time accelerating toward deployment on this.
This basically has two sensors. One, air. So if you're 0.08, it will actually pick up alcohol content just from breathing in the vehicle. And the other is a touch sensor. So through the skin, it would actually pick up if you're 0.08, preventing that vehicle from starting.
So a lot of people who are into drunk driving that understand the issues here, think of DADS as literally the seat belt for drunk driving. So while we talk about the autonomous driving part, the other piece is huge other safety opportunities here as well.
Another thing that we're still working on and have fingers crossed to see is vehicle to vehicle communication. So a lot of people talk about automated vehicles, but connected vehicles really represents-- those two together, automated and connected, really represent the safest, most efficient, most productive, most effective for everybody system. And I put that up because you can see here, when cars can communicate and trucks can communicate with each other, the infrastructure, pedestrians, we're talking about an overall much safer system.
So one of the things, just with some of our data looking at a couple of applications with the intersection, a left turn assist, or a through the intersection detection, you're looking at non-impaired driving crashes, potentially eliminating 80% of those, just with those two applications of vehicle to vehicle. So it's not just automated, but it's connected systems as well. And now we're not just talking vehicle to vehicle, but we're talking the whole system, infrastructure as well as pedestrians, and V2X because who know what else is out there?
But that's why in this realm, and it's been mentioned, on September 20, we came out with the Federal Automated Vehicles policy. So it was in January that Secretary Fox actually announced that President Obama was proposing a $3.9 billion over 10 years to look at vehicle research.
But the other thing the secretary said was in six months, we're going to come out with a policy to address this issue. And that was really significant because up until that time, there were a few pages, if you will, about some guidance, some thoughts, et cetera. This really is a comprehensive approach to dealing with automated vehicles.
So this is the approach we have. First of all, everything we talk about, safety is always at the top of the list. So it's about safety first. That's going to be critical for any discussions you have with us, any actions we take.
The other is-- again, this is a model for proactive. So the framework that's proposed here-- people were shocked, frankly. This document's 112 pages long. What most people expected was thousands and thousands of pages of regulation. We did not take that approach.
The secretary liked to say, we're writing the Declaration of Independence, not the Constitution. So it's a framework. That's why it's only 112 pages. And it's not only the proactive part, but the ideas to facilitate innovation.
If we just prescribe, this is the way everything has to be designed, tested, deployed, that puts everybody in a box. Instead, we're looking for everybody-- and there's a 15 point safety letter everybody's probably heard about. And basically what we're doing is inviting innovation.
So when we've got five people in the front row here, we're hoping that we'll have five different approaches to those 15 items in the letter. That's how you nurture, support, and facilitate innovation rather than saying, all of you have to be in the same box.
In fact, if you think about it, people have been asking, is there a rule-making roadmap here? Well, what all of us would want is be as innovative as you can, send in those lists, show us the innovation, bring the data, and at some point, there's going to be some best practices. What's that based on? Well, that's based on one, or two, or at the top of the list, the best data that shows the greatest safety.
At some point, that best practice would probably be the basis for rule-making, would a different path to take than just coming out with rule-making that could take years and years. And that's why the bottom line I'm going to highlight, there's a lot about data in there, but nimble and flexible I put in there because I think it's pretty critical for everyone to realize-- if we took 6 to 10 years for regulation, by the time it came out, everything from a technology standpoint would be generations too late.
And so part of what's really critical here is to have nimble and flexible built into this, which is why a commitment was made to review this policy and update it on an annual basis. So these are the four elements in there. I hope you've had a chance to read it all. There's no quiz, so you don't have to worry about that.
But it's a pretty straightforward read. Vehicle performance guidance-- again, there's a 15 item safety checklist, basically, a letter that has to be sent in. What does that do?
Proactive means we actually have people looking at safety before anything gets on the road rather than our usual reactive, only looking at things afterwards, when there is a problem. There's a model state policy. What everybody talks about is a patchwork of laws and policies across the country.
We put-- just slam on the brakes here. It would just freeze everything that's going on. And so what we have is a model state policy which very much focuses on what the federal role is versus what the states role are. And we're very clear.
States actually don't have to do anything in this area. If they choose to, we identify some areas they could actually address if they wanted to do that.
The last two have to do with basically tools, authorities, and our regulatory things that we have available to us right now. So we look at the current ones, in particular, we talk about interpretations and exemptions. I want to highlight that because it can often take years to get an interpretation or exemption through the agency.
We actually made a commitment for simple, straightforward interpretations, to get those done in 60 days. Complex ones done in 90 days. Exemptions, for a simple one, potentially in six months. Why are those critical?
Means we have tools now that you could use fairly quickly to get stuff on the road for different kinds of field operational tests. Collect the data to show whether your innovation is really going to make a difference or not.
And then the final section is looking at, what's the future hold? Again, for 50 years we've been reactive. If we want to look to the future, what are 12 different things that we might be able to use? And just to be clear, we don't actually propose anything. We just identified 12 that need discussion so we can figure out what the future will need for us to get these accelerated onto the roadways.
So here's another number that is really important. We actually did a study looking at the last 50 years of 14 technologies that are out there. And seat belts are at the top, airbags are number two. 613,501 lives have been saved by technology.
We know technology can make a difference. And we know it can save lives. This is what our excitement is about.
Now, is that the only thing we need to be focused on? Absolutely not. And that's why this last lane has to do with us a human, that 94%.
And NHTSA's already been involved in this tremendously. We have a huge number of programs focused on our behavior. These are national programs that hopefully all of you are familiar with.
What's clear, though, is that we have to wonder, what are we going to do? Well, it ends up we actually published something that talks about the strategies at work. There are about 120 strategies in here. And we know what actually works.
So for the immediate crisis, the rise that we see going on now, we know that there are strategies that will work. But is that the only thing we can do? That's this guy, right? If we keep doing the same thing but expect a different outcome, they call that insanity. Thank you, I heard you. You're really there.
So we have an immediate crisis, we can do the stuff we know that works but if we keep doing that, we're never going to get to zero. And so that's why September 20 we announced the autonomous vehicles policy. And then on October 5 we actually talked about a new Road to Zero coalition.
And it has two specific goals. First is the immediate near-term. Let's apply all the stuff we know that works. But we're also identifying specific money, specific support for innovation. Where to identify the gaps where stuff can be improved or new things can be applied to deal with the immediate increase in fatalities that we're seeing?
But really, the longer term challenge is going to be addressed by the second bullet there. And that is, we have a group that's coming together to create a 30 year scenario based plan on how to get to zero.
They're sweet and started with zero as a goal. We have vision zero toward zero, a lot of different programs focused on this at states, at city level. What has been missing, really, is putting all of those together and having the long term plan.
People are just counting lives lost, crashes, year by year. We need a 30 year plan. And it starts with a scenario that says you wake up in 30 years and no one lost their life on our roadways. And then you look at the milestones to get you there.
So that's why this effort is really very different. Deal with the immediate crisis. It'll take about 12 months or so, at least, to come up with that 30 year plan to figure out how we get to zero.
That's being done with three different agencies within DOT. This has never happened before. So it's not only NHTSA, but it's the Federal Highway Administration, Federal Motor Carrier Safety Administration.
So the three surface modes at DOT have come together. We are partnering with the National Safety Council to do this. And I mention that because while those groups are the coordinators for all of this, we already have 75 organizations participating. This is all inclusive.
So whether it's used in individual company, OESA as an organization, everyone needs to participate. Everyone needs to take part in this. The only way we get it to zero is if all of us are participating and take responsibility.
Last two slides. First, this one. For the last two years, NHTSA's really been going through a very significant transformation. The first thing at the top there is we've had three specific things we've focused on just strategically. That is, fix the things have been broken, and I would say that's both within NHTSA but within the industry that we can. We're talking about a pivot to proactive. And I've been giving you all kinds of examples through this discussion.
And the other is, for all of us, we have to create and then own the future. We can't just wait for all of these things to happen to us. And so these three strategic approaches have been what NHTSA's actually actively been pursuing over the last two years.
And what you see below that are 12 concrete examples of things that have been accomplished and initiated over the last two years. I put at the top there the Federal Autonomous Vehicles policy and the Road to Zero. Because those two, to me, are the capstone of the last two years.
They epitomized what proactive means. And for all the work we can do in Road to Zero, autonomous and new technology innovations will be a critical element for us to get there faster than if we just do the stuff that we've been doing for a long time.
So this just gives you an example of some of the very concrete things that NHTSA's been doing. But that's why I said the last slide-- with these three lanes, one of the things I've been highlighting to everybody, there is a moment going on with people not just focused on proactive but the actions that need to be taken for all of us to be able to really reach zero lives lost on our roadways.
So I think for everyone, and this is what I started with, our suppliers, different tiers, different than the OEM-- we're in this together, folks. There are things in the AV policy that apply to you. Everyone who rides their bike, walks, which is everyone here, is in a vehicle, whether it's commercially or your own, everyone is invested in this. This is your life we're talking about, and your family, and your co-workers.
So we are in this moment right now for everyone to figure out how you're going to travel, in one lane, in all three lanes. My bottom line is, though, that this is a responsibility we all share. 35,092 should be completely unacceptable to all of us.
100% of those are preventable lives lost. And we cannot bring them back. It is tragic. That is the equivalent of a 747 crashing every week for a year.
And the increase last year, five more jumbo jets went down. If that happened in the United States in one week, that would be headlines for three months. If it happened a second week, we would shut the aviation system down until we figured out what was going on.
And yet we accept not only that high number, but increasing numbers like it's OK. It's part of the risk. It's part of the cost of getting the mobility we have today. It should not be.
And we are in a moment where we can make not just a big difference in that, but go beyond safety to mobility and sustainability with all of the opportunities in front of us.
So please join us. Please join with your colleagues. This is a path that we can only attain if we do this together. Thanks very much. I'm going to look forward to speaking with Julie and Ann. Thank you.
[APPLAUSE]
[MUSIC PLAYING]
PRESENTER: Great, thank you so much. Thank you for being here. We appreciate your candor and speaking to this audience of suppliers. It's so key.
I need to start with a question. It rose to the top very rapidly in terms of the questions as we have them coming in. And it deals with Tesla.
And the question is, really, with the Tesla death that unfortunately occurred with their beta system software, Tesla instructed the drivers of their vehicles to simply turn off that software. The question is, if it was a more traditional OE, it would have probably been a recall. Why the difference? And what was your thought process when you saw that occur?
MARK ROSEKIND: I think we're going to get to the next question really quickly because NHTSA actually has an investigation into that right now, which is why I can't comment on that in any way. But I think that gives you an indication-- as soon as we heard about that, we gathered information and initiated investigation. So that's going on right now to determine specifics from a NHTSA perspective.
PRESENTER: OK. The next question that we have is really-- I thought it was very insightful. If you had two more years with NHTSA, what would your priorities be?
MARK ROSEKIND: Great question. So why that's so interesting personally is because I finished five years at the NTSB, came to NHTSA knowing that I only had two years. So I warned everybody, we got to sprint. And I don't mind telling you the calendar we're looking at. We are, like, running through the tape through January.
And I'm saying that because why that's so interesting is I think there have been a lot of times where I come up against something and say, you know, if you had four years, you'd be putting that not just on the list. You'd be going after it.
So I think there are-- my highlight would be that I think what I showed, our 12 things. A lot of those are initiated. But it's delivering long term on them. And if we had four years, we'd be doing that a lot more solidifying way.
So one of the things I-- story I tell is when I met the secretary about this position, he said, Mark, in two years we're not going to fix it all. We're not going to get it all done. But we could put some big markers down. Set the path. So I think part of what would be done was making sure those markers were deep and we were following them to the safety goals that we've established.
PRESENTER: And so Ann, how does that-- those goals, if you will, the markers that have been set down-- how does that line up with what you see as suppliers' priorities for the coming years?
ANN WILSON: Well, I think a couple of things. As I look around the audience, there's a lot of you I interact with on a lot of basis and you interact with other folks on the DC staff and with other people in your teams, too.
But there's a whole bunch of you who are very involved in the safety process and fuel efficiency who don't interact with Dr. Rosekind's team, don't interact with us, and we need to change that. So, I think that's one piece of it.
I do think we have been-- and I know you've heard this from me before-- want to make sure that suppliers are fully involved as you develop these policies and guidelines because suppliers have a unique position on them and I think it's important for us to do that. But that's incumbent on both us and on the agency. It's not just on the agency, but it's incumbent on us to bring information and data and our viewpoints to the agency. So, I would think that would be my first one for two years.
MARK ROSEKIND: Can I comment?
PRESENTER: Yes.
ANN WILSON: Please.
MARK ROSEKIND: If you didn't get the message, this opportunity is for everybody. Ann and I have talked about this a lot. Anyone who's sitting there thinking, well, but that doesn't apply to me, wrong.
Everybody, whether you think or not that this is specifically in your lane, the reality is, whether it's personal or business, you have a role in this. And the only way we're going to get to zero is through all doing this together. And so the opportunity part is for everybody. And anyone who sits back and says it doesn't touch them is wrong.
You got to participate in some way. And the other thing, thanks for mentioning that-- because the policy that's out is still in a 60 day comment period. So you can actually put comments into the docket. By November 22 it closes and we have a November 10 meeting that just got announced, it's on our website, that's going to actually look at two things.
One is overall comments so you can come and make a few minute testimony, basically, about the overall policy. And the second part is we're looking for information about creating a template for that safety letter. So November 10, same thing. You could come and give us input of what you actually think belongs in that safety letter. And we're doing those on the 10th so we can do that before we close the 22nd comments.
And one more thing. When you read the policy you will see we actually have 23 next steps that are outlined in there. So this is not a, make the comment and you're done. This is nimble, flexible. There'll be many other opportunities which is, take advantage of it.
PRESENTER: We have a number of questions that have come up with regard to the increase in fatalities. The question as to, what do you think is causing that? How do we stop people from texting? So what do you think the causes are? And if it's texting or being on your phone or distracted that way, what's the thought process at NHTSA behind that?
MARK ROSEKIND: I think we've been looking at two pieces of it. One is, if you look at the data in more detail, you realize that vehicle miles traveled has gone way up.
And some of that is good because what it represents is higher employment, younger people getting out there, better weather. I mean, I saw this data. It's like, better weath-- yeah, people are out. They've got more disposable income. And about half of the increase could potentially be due to that.
The other half, unfortunately, are all the problems we already know that exist. So things like distraction, drowsy driving, speeding, drunk driving-- drug driving is becoming much more of a significant issue. All of those things that we know are classic. Basically, when you put people on the road, they're at risk for all of these things we already know and they just take more lives and create more crashes.
ANN WILSON: So Julie, can I say one thing?
PRESENTER: Please.
ANN WILSON: MEMA worked with many of the companies here, and many of the companies here have worked individually on a lot of the technology that's currently on the road. And we've worked very closely with Dr. Rosekind and his staff on this.
And this is one reason why-- I know I went through in my five minutes very quickly, but why the new car assessment program is so important. We really think it's critical for us to get information into consumers' hands so that when they're purchasing a vehicle they-- you've got the AEB but you've got blind spot detection. There's other kinds of technologies that are out there that maybe can't get to the root cause of some of these accidents but can help prevent some of them.
So I encourage those of you to watch this as it progresses, watch NHTSA's views, DOT's views on this, and watch our views on this, because we think that this is a very important-- the idea of an automated vehicle is really tantalizing. But there are concrete steps that we really think that we can take together now.
PRESENTER: I have one last question here and then I'll offer you some time for closing comments if you have any. But this question I thought was very interesting. Are we seeing an increase in traffic deaths related at all to age, either aging at the more senior or the younger side of it?
MARK ROSEKIND: I didn't pay you to say that. Because it actually ends up-- tomorrow we have an older driving event in Washington looking specifically at this issue. Because there have been a lot of claims about that. But as a scientist, I'm always like, claims and hypotheses are one thing. Data, something different.
So tomorrow we're actually going to be looking at not only what does the data tell us, but what are the new, innovative things we could do to address that special group? It ends up-- folks that are older have, like, a five times higher risk. And that's just because anatomy and physiology is different. Their body reacts differently in a crash. And so we're going to be looking at that tomorrow, actually.
PRESENTER: Any comments that you'd like to make as we close?
MARK ROSEKIND: I think I would just close with-- the slide about NHTSA's transformation is really to share the opportunity with everyone that our couple of years have been focused on such a significant shift from 50 years of being reactive to trying to get proactive. Let's avoid crashes and all the problems.
That's pretty major. It's going to be a pretty significant culture change for everybody. And you can't do that just in two years. That's why you need everybody involved. And what I'm hoping is that what NHTSA's done is work with folks, all the industry, and safety advocates, and everyone else, you can think of, to get those markers down.
PRESENTER: Ladies and gentlemen, please help me thank both Ann and Dr. Rosekind. Thank you for all your candor.
[APPLAUSE]
| Strategic Goal | Strategic Objectives |
|---|---|
| Safety |
|
| Proactive Vehicle Safety |
|
| Automated Vehicles |
|
| Human Choices |
|
| Organizational Excellence |
|
Credit: THE ROAD AHEAD, National Highway Traffic Safety Administration Strategic Plan 2016—2020 (USDOT, NHTSA October 2016)
A few of NHTSA’s areas of focus are briefly described below:
Vehicle Safety Ratings and Recalls
NHTSA plays a large role in accepting and tracking vehicle safety complaints which can ultimately lead to safety recalls. They also administer the New Car Assessment Program (NCAP) which assesses and scores vehicle models using a 5-star safety rating. Safety rating and recall information [13] is compiled and made available to consumers. Using this information, consumers can quickly determine how specific vehicles perform in front-end, side, and rear-end collisions in addition to rollovers. NHTSA also compiles safety information on car seats, tires, and other equipment.
Data-Driven Approaches to Crime and Traffic Safety (DDACTS)
DDACTS is a model which NHTSA developed in association with the Department of Justice (DOJ). It uses the temporal and spatial analysis of crash and crime data to identify the optimal deployment of highly visible law enforcement personnel and vehicles. Detailed information about the model is available in the DDACTS Operational Guidelines [14].
National 911 Program
The purpose of the National 911 Program [15] is to promote and coordinate 911 services across the U.S. NHTSA is currently promoting and rolling out the Next Generation of 911 (NG911) which will modernize 911 systems based on advances in technology which have occurred since 911 was first put in place 50 years ago.
Office of Vehicle Safety Research
The Office of Vehicle Safety Research is a NHTSA Office that develops and implements research programs designed to reduce crashes, fatalities, and injuries. Some of their research activities can be found here [16].
National Center for Statistics and Analysis (NCSA)
The NCSA [17] is an office within NHTSA which provides analytical and statistical support to the agency through data collection, crash investigations, and data analysis. One of NCSA’s responsibilities is to maintain and enhance FARS. They also produce many useful and interesting publications summarizing information gathered by NHTSA [18].
7.4 Getting to Know Each Other
This week, you’ll have a one-on-one chat with one of your classmates (or me) as per the schedule you were provided in Week 1. The discussion should be at least 30 minutes in length. If it’s the first time you’ve chatted with each other, spend the majority of time getting to know each other. Otherwise, focus on discussing the lesson content.
7.5 Webinar for Next Week
Next week, we'll hear from 2 speakers.
Speaker #1
Our first speaker will be Mr. Jeff Roecker. Jeff graduated from Penn State with a degree in Geography and joined PennDOT in 2008. Jeff plays a lead role in the Department's Crash Data Analysis and Retrieval Tool (CDART), and he is the project manager for PennDOT's Strategic Highway Safety Plan (SHSP).
Crash Data Collection
FHWA requires all states to maintain a database of crashes in order to support the analysis of crash locations. There is variation from state to state on how they define reportable crashes, how they collect the information and how readily they share the information. Many states publish annual summaries of crash data for the prior year and also provide trending information for various crash statistics. The Pennsylvania Department of Transportation (PennDOT) publishes an annual report entitled Crash Facts and Statistics. The 2016 version of this publication can be found here [19].
Crash data is important to state DOTs for a number of reasons. First, without this data, an agency doesn’t know if things are improving. Second, this data can offer clues to where safety improvement or countermeasures are most needed. Crash patterns can also be used to help law enforcement design initiatives associated with seat belt usage and checkpoints for impaired drivers.
Law enforcement officials are generally responsible for reporting crashes. In Pennsylvania, the Commonwealth of Pennsylvania Police Officers Crash Report Manual provides law enforcement agencies instructions on reporting crash data including definitions of which types of crashes are reportable to PennDOT. The police use a multipage form (AA 500 [20]) to report crash data. The form captures extensive information about the crash including the location, all vehicles and individuals involved in the crash, the number and nature of any injuries, weather and road conditions at the time of the crash, a diagram of the crash, and statements from any witnesses. PennDOT also provides a detailed reference document known as Pub 153 [21] to help police officers complete the form correctly.
PennDOT also has a web-based system called the Crash Reporting System (CRS) which provides an electronic alternative to submitting crash data. A user’s guide for the system can be found here [22]. CRS is also used by PennDOT to review and validate all data which is automatically retrieved from paper forms which are received from law enforcement agencies. Any meaningful analysis of crash data requires that the data is accurate and complete.
Crash Analysis
State DOTs use crash data to identify locations where there are unusually high crash rates and also to determine measures which will likely lower these crash rates. One of the most useful types of crash analysis, which is used by many state DOTs, is a spatial technique known as cluster or hot spot determination. This type of determination is done using GIS software by stepping along each route and identifying sections of roadway which meet the definition of a crash cluster based on established parameter settings for the analysis.
In Pennsylvania, crash data submitted by law enforcement agencies electronically via CRS or the AA500 paper form, are processed and stored in a system known as the Crash Data Access and Retrieval Tool (CDART). CDART is a geospatial application which allows PennDOT to perform a variety of crash analyses including crash cluster analyses. It performs two basic types of crash cluster analysis. The first is a standard cluster analysis where each road is considered separately. The second is an intersection-based cluster which examines the number of crashes which occur on all associated roads within a certain distance of the point of intersection. One of the other interesting analyses CDART performs is a “before and after” analysis which compares crash frequencies for a section of roadway before and after a safety improvement was implemented to determine its effectiveness. For each of the analyses CDART performs, the system allows the user to generate tabular or map-based outputs. CDART is an internal tool to PennDOT and is not available for public use.
On May 30, 2013, Sharon Hawkins of the Arkansas DOT gave a 42-minute presentation on some of the GIS tools [23] they use to locate and analyze crashes (located below). The presentation was part of the FHWA GIS in Transportation webinar series. The webinar provides an excellent perspective on the importance of GIS in collecting and analyzing crash data. Many states have gone through a similar evolution and set of problems in their efforts to manage and utilize crash data to improve highway safety.
Video: GIS Tools Used to Locate & Analyze Crashes (42:28)
SHARON HAWKINS: [AUDIO OUT] and we have about 16,400 plus miles of state highway. We're the 12th largest state highway system in the nation. And then just a little bit on the topography of Arkansas. A lot a mountainous regions, rolling hills, and a nice flat delta region. A lot of different terrain as far as where we're building our roads, and a lot of different terrain to analyze when we're looking at our crash data. So I want to do a few statistics about our crash data before I go into the tools that we're using.
So here's a chart showing the total number of crashes in the state, and total roads versus just the state highway system for the past 10 years. And you guys can see, about 60% of all crashes in Arkansas occur on our state highway system. 70% of all crashes in the state-- total crashes-- occur in our urban areas. And then 70% of all crashes that happen in the state that have a fatality involved occur in our rural areas. And 2/3 of those are roadway departure related.
There were 550 crash fatalities in Arkansas last year. This next chart kind of gives a comparison on how our fatality rate versus the national fatality rate. And you guys can see, we're just a little bit above what the national fatality rate is. All this being said, with our crash location tool, it's very important for our new initiative towards zero deaths to make sure that we have all the spatial information that we need in order to make our routes safer for our traveling public.
So I'm going to go over kind of past to present-- the different kind of tools that we've used in the past to locate our crashes. And then I'll be introducing our new tool that we're going to use. So we've been progressively implementing new methods over the years. And so for the next few slides, I'm just going to show what we've done from the 1970s through 2011, before the implementation of our new tool.
So in the 1970s, the department was tasked with locating and maintaining all the locations for crash events on the state highway system in Arkansas, and just on the state highway system. So for this purpose, the department decided to record each crash event with that event's county, route, section, and log mile location so they could be found and studied on the highway system, since the system uses the same county, route, section, and log mile set up. And we live by the log mile here at the Arkansas Highway Department.
The department partnered with the state police and local county and city law enforcement to make sure that they could locate each crash with its needed attributes, including an accurate log mile of where the crash event occurred. So we were relying on other law enforcement-- law enforcement that weren't familiar-- very familiar, anyway-- with the log mile system to get a log mile for us.
So this slide shows one of the earliest tools that we would use, which is our county, route, and section map. It only shows the state highway system on the map. Of course, it has the beginning and ending log mile for each segment of highway, and it has a log mile for all the bridges on the map.
So we were asking them to give us an accurate log mile for a crash location based on these maps. You guys can imagine how difficult that was for them. But there was a backup. And we also-- here at the department-- we had crash locator positions. And they had to locate-- relocate-- all those crashes that happened on the state highway system.
So next, we also had our tabular road inventory information in these big books that they were able to flip through. And for each route, wherever it intersected another state highway system, of course, there was a log mile listed, and then events that happened on the route. So a number of lane changes, ADT changes. There were log miles listed for that.
As you guys can see from the picture, very difficult to understand. Our crash locators here at the department could hardly understand it, so it was very difficult for us to think that other law enforcement were going to be able to understand it also. So once again, every crash had to be relocated here at the department, even though we were getting a log mile from our law enforcement.
So we also provided static printed maps, and our workers here would write in the log mile wherever there was an intersection with another route. So we would take these maps. We would hang them up with the city so they would have a static map on their wall to look at to better locate a log mile. But you know, those maps could be out of date, you know, as early as the next day. There's always system changes on the highways. So this is not a very efficient way to get it done.
So next, we offered that we could make these maps-- we didn't have to handwrite anymore. We could use MicroStation. And we could put log miles in where routes intersected the state highway system so they could have a better feel of what log miles were available for them to choose from to report the crash location. Once again, maps could be out of date very quickly. And even though these were available digitally, most cities still relied on their printed versions that were hanging up on their wall.
So in 2004, we realized the power of our linear referencing system and how it could help our crash locators here at the department locate exact log miles of where crashes occurred digitally in our GIS software. So we set up the program with our CAD maps. And we had our linear referencing system on top of those CAD maps so they could see intersecting routes with our state highway system.
They could hover along using a tool called LRS Precision Location. As they hovered along the state routes, they could get an exact route section and log mile of where their point was. Very helpful for our crash locators here at the department. But we couldn't share this tool with law enforcement, because they didn't have the software, and not the knowledge, either, of the linear referencing system.
So still, we were in a continuous cycle of us having to relocate all crashes that happened on the state highway system to make sure we were getting an accurate log mile. And we were lucky. Our Arkansas Geographic Information Office had gotten with the counties, and they had developed a 911 center line routing system for the state.
So thank goodness we had a whole state network that was attributed with road names and such so we could utilize that with our linear referencing system, and they would be able to see the routes, their attributes, their names, to still better identify a crash location. But once again, that was a tool that we could only use here at the department, and other law enforcement just couldn't get to it.
So we also tried, during that time, GPS units. We bought 50 GPS units, sent them out with the state police. We wanted to do a trial period. Maybe they can use these GPS units, take a reading at the crash scene, get a lat/long for that crash, get it into the system. And then we would have a latitude/longitude that then we could convert to log mile for our report. So we tried this for about three months. We gathered the data.
I've heard this from many other states-- when we got the data back and mapped it, a lot of those dots landed in the state police parking lot, or they had moved to the side of the road, so-- in other parking lots where they were. It just wasn't convenient. It wasn't going to work. Not necessarily the law enforcement's fault. They didn't realize how important this was to us to make sure that we had these correct locations. And there was minimal training when we did give them those GPS units.
OK. So just a little bit about our linear referencing system, which was a major player in the tool that I'll be introducing in just a minute. So as I said before, over 16,000 miles of state highways on our highway system-- 12th largest in the nation. And also included on our linear referencing system, over 15,000 miles of other routes eligible for federal aid. So what you're looking at here on the screen is pretty much our functional class system-- so all routes eligible for federal aid. It's what we have currently on our linear referencing system.
So our linear referencing system sure works like most other DOTs. We assign the route with the county route, section, and beginning and ending log mile. The concatenation of the county, route, and section and the log mile information is its unique value, or its primary key field. And then we can map different things from around the department that also have that same primary information, such as job status, information from our road inventory, and of course, crashes.
So updating the LRS, 177 changes were made just in 2012 on the state highway system. We have removed routes, added routes, relocated routes, and often a lot of relogged routes throughout the year. We keep a live version of our linear referencing system open to everybody here, but we also keep archived copies. We started archiving our linear referencing system in the year 2000.
So we can always go backwards to see what the system looked like back then, which is helpful. We just received the 2011 statewide crash data, so we can't use current linear referencing system to locate on. We're still locating crashes that happened in 2012, so we do have to keep these archived copies to make sure that we're locating in the correct year that the events occurred.
OK. So let's look at one of our typical crash reports that we get here at the highway department. It happened on the state system that we have to relocate. Of course, all the information here. You see a little narrative about where the crash happened and a little diagram. This particular crash says it happened on US Highway 82 in Columbia County, section 3b, log mile 2.20. So we're going to relocate this crash and see how the law enforcement did out in the field.
OK. So from the narrative, we see where the red circle is in the middle of the map, that this is approximately where that crash happened. But they said it happened at log mile 2.20, but this route only goes to log mile 1.65. So couldn't have happened. So we're going to have to relocate this. OK. So after our locators got a hold of it, we relocated it to say, now it happened on Highway 79, section 1, at log mile 18.26.
Those are going to be sent back to our state police. The location is going to be re-entered into the database for the correct crash location. So once again, that's a prime example of how difficult it is for our law enforcement to give us the correct log mile. So back in February of 2011, one of our county offices-- Polk County Sheriff's Office called. We just had a big snowstorm. We were still waiting for the snow to go away.
And they said, hey, we need that map that we're supposed to use to locate crashes by log mile on the state system. Can you tell me where that is? So we directed him to the route and section map that they've used. And he said, hey, is there an easier way? And that very day, we sat down, and we came up with an easier way. And we don't blame them for asking.
In this instance, here's a route. It's about 19 miles long. There's no log miles in between for them to guess, so they have to use the little section lines to kind of guess where that log mile could be. And they have 52 different fields of information per crash to enter in. A log mile's not necessarily on their radar as the most important field. So a lot of human error. And then with our locators having to relocate all those crashes, sometimes we weren't getting those locations in in time to really do some real-time analysis with our data.
So, making it easier-- so what we did is we took our linear referencing system that included all routes eligible for federal aid around the state, and we asked our GIS platform-- we asked GeoMedia to put a point every 100 feet along the linear referencing system. So when it did that, each point was populated with the county, the route, the section, and the exact log mile of that point.
So then we say, OK. Well, let's make this a little bit better. Let's attach some of our road inventory data to those points also. So now, with county, route, and section, and the exact log mile of that point, was other information that was going to be very useful to the law enforcement to fill into their reports, also.
Well, then we took the points and we said, hey, let's shove these out to a KML file for display in Google Earth. So we did that through our program. And as you can see from the screen, in the red, we have what's on the state system. In the blue dots, we have other routes eligible for federal aid, or the rest of our functional class system. And you're able to click on those dots in Google Earth and see the exact information that was generated in our GIS platform.
Of course, these are KML files. We can email them out to anybody. You can email them out to family members. They would be able to see. So we started emailing these out to our state police for them to be able to give us a more accurate log mile of where their crash events occurred. And it's just worked out wonderfully.
We also included our city limits, as you guys can see in the top left of your screen. There is a field they had to fill out that say whether or not it's in the city or out of the city. And if it's out of the city, they have to measure how far out of the city it's out of. So we have our city limits available to them. Instead of just being able to locate on main lane, they can now see the log miles on frontage roads and on ramps.
And of course, they have Google Street View available in here to be able to help them better locate where they are in the field. And of course, this allows them-- if they have connections, they can locate right there in their vehicle at the scene of the crash. If there's no time, they can always come back to the office and, of course, use this tool also to locate the incident.
In this case, this is a pretty long bridge that we have here in the state-- the 430 bridge. The beginning log mile of the bridge with 9.87, if you guys can see in the graph on the corner of the screen. So we had a lot of accidents that happened at 9.87 on that bridge.
But as you guys can see, every 100 feet along that bridge, there's a lot of dots. It's almost two miles long. So they're able to give us a more accurate, better log mile when they're out in the field. Not only are the law enforcement outside of the Highway Department using this, but also our crash locators are taking advantage of this tool and now using it to locate those crashes.
So how can everyone use this tool? We can email out the KMLs to everybody. We have FTP sites that's open to the public. Anybody can download those KML files. We also have all these points, or dots, every 100 feet available on Arkansas' GIS clearinghouse called GeoStor. In addition to that, our Arkansas Geographic Information Office offer this data available on ArcGIS Online.
So we have all of our dots in there. There's a link that anyone can click on and go in there and see the same exact information that was offered in the KML files. And also, ArcGIS Online can be used in their smartphones, also. So if they don't have their laptop open, or a good connection, they can also use their smartphones to be able to see that information.
So the use of the LRS location tools, or our new crash location tool, the training and outreach to law enforcement agencies started in June of 2011, so just three months after we came up with the methodology. All of the state police agencies are using this, which account for 25% of all crashes statewide, or about 40% of crashes on our highway system are being located using this tool. And we constantly reach out to counties and cities. Right now, it's just a volunteer basis for local law enforcement to use it. But we have about 42 of those agencies that have started to utilize it, and we've gotten very positive feedback.
So once we have the data, our better locations that we have. Of course, numerous planning studies are done in order to figure out, hey, do we need a passing lane here? Do we need more lanes here? Maybe a turning lane here to make things safer. Maybe some rumble strips.
And then we can also run all kinds of queries, as far as types of crashes, to be able to look for areas that might need to be paid attention to for more safety initiatives to take place. As far as safety initiatives, having this data, having these locations in a more exact location for us, we've been able to prove that different things, such as cable median barriers, need to be installed in more areas around the state. Rumble strips need to be installed, especially on some of our two-lane rural highways where run off the road crashes were very prevalent.
And then we have one more tool that we started using. It's called Intergraph's Incident Analyst. It's been able to help us identify clusters and locations-- areas-- that we really need to pay attention to that we haven't been able to find as quickly without this software. So case in point, this is a study we did in Jacksonville, Arkansas. We had to make a map for our administration so they could see the clusters of crashes that happened in Jacksonville.
The map on the left, you guys can see all the clusters of crashes-- the yellow dots there. This map took about four hours for us to put together. A lot of these crashes happened at the same exact log mile, so the dots are just right on top of each other in our GIS platform. So we exported it out to our CAD. We took those dots. We moved them around so we could produce those clusters.
So once again, about four hours. But with Incident Analyst's hot spot analysis tool in our GIS platform, it took about two minutes for it to generate this hotspot map for us. You guys can see that the two maps compare very well with the clusters. On the right hand side, the hot spots in the red are showing where those clusters are that you guys can see on the map on the left in the yellow.
And then there's also a incident count tool. You can count incidents within any boundary area. So in this case, we're using county. But you can also do cities. We do a lot of House and Senate districts if our legislators want to know where most of the accidents are happening within their jurisdictions.
And there's also a repeat incident tool that we use to run-- this is on a statewide basis, but we can run it on any sized project area in the state. But it lets us know quickly where repeat incidents happen over and over again at the same log mile location so we can really focus on those areas and do some study analysis to find out if there are some safety issues within those areas.
They do have a tool in there also called Change Over Time. It kind of plays a little movie for you, what happens with these incidents. I just did January through June for this. It's in PowerPoint, but once again, imagine it's a movie. When I flip to February, keep in mind that we had a pretty big snow storm this year, so a lot of crashes happened that month.
And there's also temporal reporting. It makes nice charts for us to be able to show where the majority of the crashes happened. So at the top, you see month of the year, in the middle, day of the week, and then on the bottom, time of day-- crashes that happened. And this helps us put together nice figures, especially for public involvement.
We used this at a public involvement meeting. We did hotspots of the crashes. On this particular study segment, we wanted the public to know that we know that there are a concentration of crashes that happen in this area, and it's under study, and we have plans in place to rectify that. And also, we had our temporal reporting on top of that figure.
OK. In the future, a methodology will be in place by June 2013 to include all public roads in our linear referencing system. So from our about 30,000 miles that we have available now in our linear referencing system, approximately 110,000 miles will be included in there. You can see from the figure, in the red, this is about how much we have to add-- about 74,000 miles we're going to have to add for our linear referencing system.
But when that's done-- and we guesstimate in approximately five years-- we'll be able to locate all crashes in the state, not just on our federal aid system, which, the safety initiatives-- there's nothing like having more data to do analysis with to find out what needs to happen.
Of course, the dual carriageway system will be put in place along with that linear referencing system. So each divided highway will have two centerlines, and road inventory will include complete data for log direction and anti-log direction. Right now, we can only map on our linear referencing system based on one centerline. But you guys know, FHWA has asked us to do dual carriageway along with an all public roads linear referencing system.
And in 2014, the Highway Department, along with the Arkansas State Police, will start implementing eCrash, which was developed by the Center for Advanced Public Safety, or CAPS, at the University of Alabama for a paperless, electronic submission of crash reports. eCrash will have an actually map click tool that our law enforcement will be able to use in their vehicles. They'll be able to click on a location. It will give a latitude and longitude of that crash. But they are going to be using our points-- every 100 feet points-- within the map click tool, also, for log mile information.
OK. And this is just to illustrate we're just skimming the surface of what we can do, and look at all the potential that's ahead of us, especially when we get our all public roads linear referencing system in. OK. And contact information right here. For more information on Intergraph's GeoMedia, or Incident Analyst, James O. Brown from Intergraph's. And then more information on eCrash, there's a link on there for you to look at also. And then I'm happy to answer any questions.
Thanks, Sharon. I'm going to go ahead and open up the lines for question and answer.
[BEEPING]
PRESENTER 2: This conference is now in question and answer mode. To alert the speaker that you have a question, press 1, then 0. Each question will be asked in the order it was received.
[BEEPING]
MARK: So you should have heard some instructions. If you've got a question on the phone line, just press 1 and then 0. You can also enter in questions into our chat pod, especially if you're listening through the computer. Let me just quickly see if we've got questions on the phone. No, we don't have any questions on the phone right now. But let me see.
So Sharon, you mentioned that one of the issues that you had rolling out different-- the first couple attempts at something like this, the training seemed to be-- play a role, or trying to understand how the users, especially the state police, were going to try to enter in the information. It sounds like that what you have now, it was much easier. But are there still issues you're running into in terms of getting the--
SHARON HAWKINS: [INAUDIBLE].
MARK: --location information?
SHARON HAWKINS: Well, it's true right now, when they click on one of those dots and see the information they have to enter in their report, they do still have to enter that in by looking at what they see in the crash location tool and Google Earth, and typing it in. So there's a lot of human error in there. But aside from that, we've been constantly checking the locations that have come from this new crash location tool.
And the department's made a decision that as long as they use this tool, which there's a checkmark they can check to say they used the tool, we don't have to relocate those crashes anymore, which means, for us, that we're getting our data-- our crash data-- instead of a year and a half later, we expect to see our crash data eight months after the year ends, instead of a year and a half later. And then we hope in the future, it just comes on faster.
MARK: Mm-hmm, mm-hmm. Because I know a lot of states are-- that's one of the issues, is trying to either make it easier for the-- especially the state police. They're involved in entering a lot of this information-- making it easier for them to somehow put that in.
SHARON HAWKINS: Right. And that's why we're looking forward to eCrash with the map click tool. It's a paperless system. When they click, a lot of our road inventory information, and of course, that log mile information, will automatically be entered into the report through the eCrash system.
MARK: Mm-hmm. Looks like we have a question. A user that uses ArcMap, they want to know--
SHARON HAWKINS: Right. so-- yeah. We do have ArcMap here at the Highway Department. But GeoMedia is our GIS platform. So I hope maybe that somebody else that's on the conference would be able to answer that question. I know that ArcMap has the capability for hot spotting, but I am not quite sure exactly where that is.
MARK: How did you learn about the Incident Analyst product? How did you find out about that?
SHARON HAWKINS: Intergraph, actually, was advertising it. A lot of-- like a crime location tool where incidents happen over and over again. And then they worked with Ohio data, and they kind of started advertising it as a hotspot tool for crash analysis. So when we saw the presentation, we knew that it could be a good tool for us to be able to take advantage of for hot spotting.
MARK: Mm-hmm. Let me just quickly check on the phone lines to see if we've got any questions.
AUDIENCE: [INAUDIBLE]
AUDIENCE: [INAUDIBLE]
MARK: Hello?
AUDIENCE: Hello?
MARK: You've got questions? Yeah. What's your name?
AUDIENCE: This is David Lawler with TDOT.
MARK: OK. What's your question?
AUDIENCE: I think that we had seen that, too, that Intergraph started with, was maybe about a year-- two years ago.
SHARON HAWKINS: Right.
AUDIENCE: It looked good. They've come up with another tool that we built inside of what we call our [INAUDIBLE] system. And after that data is collected, it goes into a repository at the Department of Safety. Then we extract the data and put it into what we call our [INAUDIBLE] side over here in TDOT where we put all of our crash data. And that includes location data-- the county, route, log mile, et cetera.
And they came up with an automatic-- it's an automatic updater inside of our [INAUDIBLE]. And it looks for all the electronic reports that's inside the [INAUDIBLE] database at the Department of Safety. And it extracts those and pulls them over. Now, if there's a tolerance problem, or the officer can't get the right location out in the field, and we've got-- [INAUDIBLE] got a MAP-IT tool that was built by IBMS-- the vendor was. And it's probably about what you're using, too.
We've got a-- where the officer's sitting there, and he can take a Google Map and find the location. He can go up and click on the spot where the wreck is, and then draw it back to where his car is sitting. And we've got a pretty good accuracy rate with that. Now, all the troopers have got them, and now it's starting to go out into the other agencies.
SHARON HAWKINS: Into the local agencies?
AUDIENCE: Yes, the counties and the cities. We are getting fairly good with the cities. They're getting better all the time. We're just about-- I think about 80% electronic now. Do you remember, Ken? It's close to 80--
AUDIENCE: Yeah.
AUDIENCE: --about 80% electronic. We've still got some paper stuff that has to be handled in a different way. But we're happy with the tool. It looks good. And we also have a contract with Intergraph, too. So that door is always open there for them to come up with that, too. Right now, it's depending on the GPS stuff coming off the electronic reports out in the field. And it seems to be working pretty good. It's fast.
SHARON HAWKINS: Yeah. I'm very pleased with Google. Thank goodness it's free, or--
AUDIENCE: Amen.
SHARON HAWKINS: --the tool might not exist. But very happy with it. I see another question up here, Mark. What accuracy level are you shooting for? Plus or minus 50 feet with our crashes. Yes, that would be wonderful. In fact, our accuracy level-- we did a point every 100 feet.
Our accuracy level before this tool started-- with our law enforcement, we were sometimes finding up to a half mile it can be off, which, you know, things change on the system very frequently. So that just was not going to do for us. So yes, plus or minus 50 feet is wonderful. But we're finding that we're getting our crashes very nearly where they exactly happened.
MARK: Again, if you've got questions, on the computer, you can put them into our chat pod. I just want to make a quick plug, too. I think back in 2011, Tennessee was actually one of a couple of states that participated in a peer exchange that we did on GIS and highway safety. And we've got a summary report on our website.
The website, if you look on the lower left corner of your screen, is gis.fhwa.dot.gov. And if you go to there, and if you click on Resources, and then click on Reports, you'll scroll down, you should see a link to a report that looks at what several states have done-- Massachusetts, Washington, Ohio, Maine, Tennessee, Illinois, and Minnesota.
Sounds like it might be worthwhile to kind of do a follow up case study report or peer exchange and see where states are nowadays. And I think I'd definitely include the work that you're doing, Sharon. Let me just check to see if we've got any other questions on the phone. OK. Well, we don't have any other questions on the phone line right now. Let me-- I'm just going to click it back to your contact info, Sharon. Were there any-- I don't know, last--
SHARON HAWKINS: Well, I know that the PowerPoint is going to be available to download from the participants. So I just wanted to let everybody know I had a lot of graphics in here, but at the bottom of each slide in the PowerPoint, I wrote down very particular notes about what each slide is showing--
MARK: Mm-hmm.
SHARON HAWKINS: --if they'd like to download that.
MARK: Yeah, actually--
SHARON HAWKINS: And then, we're--
MARK: Go ahead.
SHARON HAWKINS: I was just going to say, we're available anytime to answer questions. Once again, I don't think it matters what GIS platform you have. This tool was very-- it's a very easy methodology to put together. But if anybody has any questions, please feel free to contact us.
MARK: To download the file, you should be able to see a file download window. If you click on the file name and then click on the Save to my Computer button, you should be able to download a copy of this presentation. It looks like people have started answering some of our poll questions. And again, this helps us give some ideas of what kinds of webcasts everyone would be interested in participating in.
Also, if you've got ideas for a case study report, or a peer exchange, or something that we need to highlight in a better fashion, just let me know. My email address is on the lower left corner. I want to thank Sharon Hawkins again for agreeing to do this presentation. Like she mentioned-- I guess, Sharon, you did this presentation back at GIST? Is that correct?
SHARON HAWKINS: Yes, sir. Yes.
MARK: Yeah. So there were several-- lot of good presentations that were done there. And that's one of the things that we try to do, is-- especially for people who weren't able to make it out to this year's symposium, which was in Boise, Idaho. We try to get some of those presentations and make them available as webcasts. Like we've mentioned earlier, the presentation's going to be available to download. We're also recording this, so we'll send a link out to a recording of this presentation.
Let me see. One last check for questions on the phone. OK. Well, I think we're all set, then. Sharon's contact info is on the screen. Thank you, Sharon, again. And thank you to everyone for calling in, logging in, and participating. Please feel free to fill in the questions, answer the questions as best you can. And I want to wish everyone a good day. Thank you very much.
SHARON HAWKINS: Thank you, Mark.
MARK: Thank you, Sharon.
Speaker #2
Our second speaker will be Mr. Jeremy Freeland. Jeremy is a Transportation Planning Manager in the Transportation Planning Division of PennDOT’s Bureau of Planning and Research. He is responsible for coordinating and overseeing all of PennDOT’s traffic collection efforts, both manual and automated. He is also responsible for assembling PennDOT’s annual Highway Performance Monitoring System (HPMS) submittal to the Federal Highway Administration (FHWA). Jeremy has been with PennDOT for 13 years. He earned a geography degree from Shippensburg University in 2003.
Highway Performance Monitoring System (HPMS)
FHWA is responsible for collecting sufficient highway characteristics and performance data in order to support their own needs as well as those of the USDOT and Congress. HPMS is a national information system which was created to fulfill this need. Initially developed in 1978 as a replacement of biennial roadway condition studies which began in 1965, one of the primary purposes of HPMS is still to provide Congress with a biennial assessment of U.S. roads for use in estimating future highway investment needs. Here is a link to the 2015 Status of the Nation's Highways, Bridges, and Transit: Conditions & Performance [24]. HPMS is also used for a multitude of other purposes, not the least of which is apportioning Federal-aid highway monies to the states.
The specific data collection and reporting requirements state DOTs need to comply with are defined in the HPMS Field Manual [25]. FHWA also provides software to submit, validate, and analyze state HPMS data. This software is web-based and is only available to authorized users (typically those staff at a state DOT with responsibilities for reporting HPMS data). The guide for the latest version of this software (i.e., version 8.0) is provided here. [26]
Traffic Data
One of the most important types of data collected for HPMS is traffic data. Of the 70 or so HPMS data elements states are required to report, about a dozen are traffic elements. FHWA’s 2016 Traffic Monitoring Guide [27] is a document designed to help states put together a traffic monitoring program.
7.6 Summary of Lesson 7
In this lesson, you learned about traffic safety and the efforts of state DOTs to make our highways safer. You also took a close look at federally reported crash data (i.e., FARS) in addition to an example of crash data which is collected at the state level.
Our transportation organization of the week was NHTSA, an administration with USDOT focused on reducing fatalities and serious injuries on America’s roadways. You had the opportunity to explore some of their specific activities and programs.
In our weekly webinar, we had the opportunity to interact with Doug Tomlinson, an expert in ITS.
In preparation for next week’s webinar, you learned a little about how crash data is collected in the field. You also took a look at HPMS and about the types of traffic data states need to collect in addition to the methods and tools they use to collect it.
Finally, you had the opportunity to get to know one of your classmates a little better and share some of your ideas and questions about this week’s lesson materials.
Questions and Comments
If there is anything in the Lesson 7 materials about which you would like to ask a question or provide a comment, submit a posting to the Lesson 7 Questions and Comments discussion. Also, review others’ postings to this discussion and respond if you have something to offer or if you are able to help.