Lesson 5: Network Analysis
Learning Outcomes
What will we learn?
By the end of Lesson 5, you should be able to:
- list the common types of problems that network analysis can be used to solve;
- use ESRI’s Network Analyst extension to perform a variety of network analyses;
- list some of the key functions state DOTs serve and discuss how their roles have changed over time;
- provide an example of how spatial technologies are used within a specific state DOT;
- discuss the nature of a Linear Referencing Systems (LRS) and dynamic segmentation and explain why these techniques are important in managing the geometry and diverse set of attribute information associated with transportation networks;
- share something you learned about one of your classmates and/or some ideas you discussed with a classmate about the content of this week’s lesson.
5.1 Network Analysis
Network analysis can be used to solve many different transportation problems that would be very challenging to solve otherwise. A prerequisite to performing network analysis is that you have a network model. In ESRI’s terms, this is a network dataset. We walked through an exercise to construct a network dataset in the last lesson. Of course, it is not a requirement of network analysis that you construct your own network model. There are a number of commercially available network models you can use instead.
The types of problems which network analysis can be used to solve are quite varied. One common characteristic of the algorithms that power each is that they involve determining the cost of one or more routes through the network. The cost is most commonly based on time or distance, but you can define a cost attribute any way you want. For example, you might score each edge in the network based on its scenic value. You could then create a cost parameter based on the scenic score and use the solver to find the most scenic route.
ESRI provides 6 out-of-the-box network analyses as a part of Network Analyst. ESRI terms these network analyses “solvers.” The solvers are listed below along with a brief description of each:
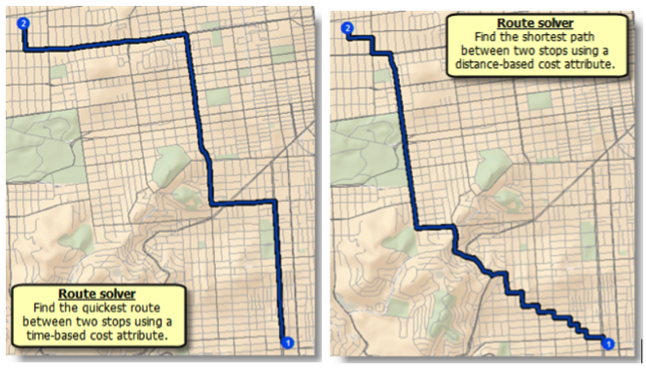
Route Solver
The route solver determines the best route between two or more points. Most of us use this network analysis on a regular basis. Whenever you use Google Maps or a comparable service to get directions from one location to another the service is conducting a network analysis to determine the best, typically fastest, route. This solver can route any number of points according to a specified order (i.e., the traveling salesman problem) or the most efficient order.
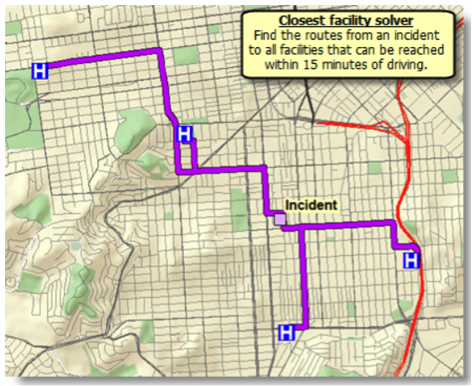
Closest Facility Solver
This solver is used to determine the closest facility to a given location. The term "facility" can be a bit misleading. For example, this solver could be used to determine the closest ambulance to an accident scene. In this case, using ESRI’s terminology, the ambulances would be considered facilities.
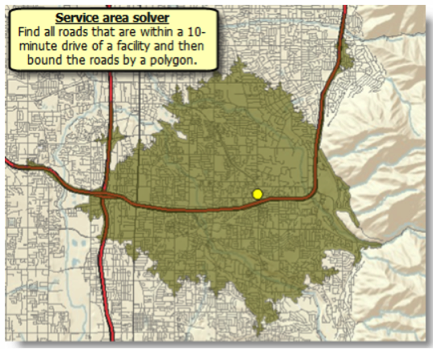
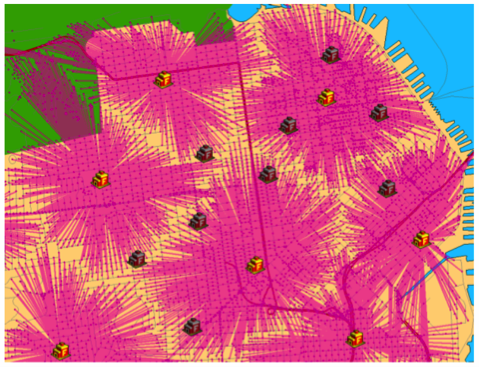
Service Area Solver
The geographic region which can reach a designated facility in a certain period of time (or vice versa) is termed a service area. To determine the bounds of this area, you can use the Service Area Solver.
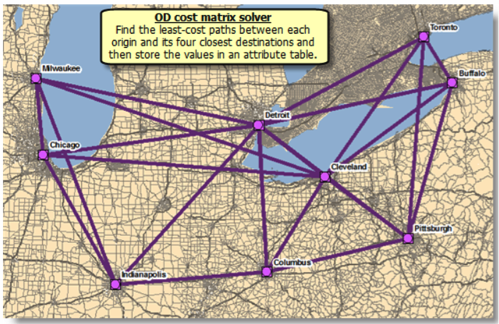
Origin-Destination (OD) Cost Matrix Solver
The OD cost matrix solver is generally used to determine the distances of the fastest routes between a set of origins and a set of destinations. Although the path between each origin and destination is often represented as a straight line, the route which corresponds to the time and distance costs between each pair of locations follows the street network.
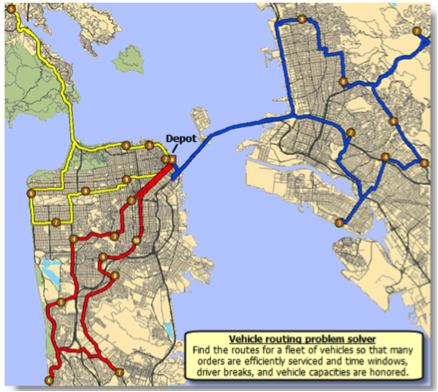
Vehicle Routing Solver
The vehicle routing solver is typically used to determine the most efficient routes for a fleet of vehicles tasked with servicing a series of stops.
Location-Allocation Solver
The location-allocation solver can be used to determine how effectively a facility site is servicing locations which have a need for its services. As such, it can be used to select the best location for a facility from a series of candidate locations.
5.2 Getting to Know a Transportation Organization
This week, we’ll take some time to explore state Departments of Transportation (DOTs). All 50 states have a department of transportation, and while there are many similarities between them, they can differ in both how they are organized and in the specific functions they perform. A convenient set of links for all 50 state DOTs [2] is maintained by FHWA.
The origins of most state DOTs trace back to the early 1900s. At that time, they were commonly named State Highway Departments and, as the name implies, their focus was almost exclusively on highways. In the 100 or so years since then, their roles have evolved, and the responsibilities have increased dramatically. Today, state DOTs typically operate or oversee all modes of transportation within the state, and the scope of their functional responsibilities have grown from engineering and construction to include planning, safety, assessment, and mitigation of project impacts on the environment and community resources, driver’s licensing and vehicle registration, permitting, and providing technical support and oversight for local roads. A good summary of the roles and responsibilities of a state DOT is provided in Chapter 2 [3] of the National Cooperative Highway Research Program’s (NCHRP) Report No. 750 titled “Strategic Issues Facing Transportation, Volume 5: Preparing State Transportation Agencies for an Uncertain Energy Future [4] (2014).”
Given the extensive number of functions a state DOT is responsible for performing, there are a tremendous number of opportunities for applying spatial technologies, some of which we have looked at already (FHWA maintains a searchable compilation of state GIS-T projects [5]). Consequently, state DOTs have a substantial need for GIS expertise, although the degree to which these needs are outsourced varies. GIS expertise within the DOT is often housed in their planning or information technology organizations. AASHTO maintains a list of GIS-T contacts [6] for each state.
5.3 Getting to Know Each Other
There are no one-on-ones scheduled for this week.
5.4 Webinar for Next Week
Next week, we'll hear from 2 speakers.
Speaker #1
Our first speaker will be Mr. Bill Schuman. Bill is the Sr. Vice President of Project Delivery for Transcend Spatial Solutions. His responsibilities include project manager oversight; providing subject matter expertise for road inventory, asset management, linear referencing systems (LRS), and road data models; business operations; and guiding the company’s strategic direction. He has over 28 years of transportation and GIS experience. He is a recognized LRS and transportation data expert and has worked with state and local governments on IT strategic plans, spatially enabled database and data warehousing projects, LRS design and implementation projects, and many custom data maintenance and data presentation applications.
Bill holds a B.S. in Civil Engineering from the University of Wyoming and is a GIS Professional.
Linear Referencing Systems (LRSs)
Transportation agencies capture a wide variety of information about their roadways in addition to information about assets or occurrences along their roadways. Some of these attributes relate to a specific location (e.g., crashes) while other attributes relate to a section of roadway (e.g., speed limit). Collectively, these point or linear attributes are referred to as events.
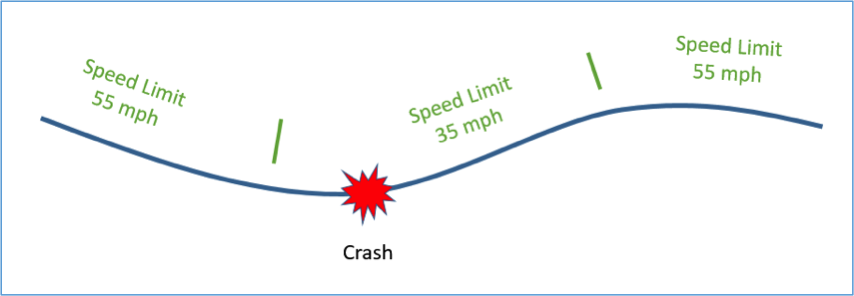
The large number of events which need to be associated with the geometry of the roadway creates a challenge due to the fact that they often change values at different locations. For example, the locations where speed limit changes occur generally doesn’t correspond to the points where changes in pavement type, the number of lanes, or the condition of the roadway occur.
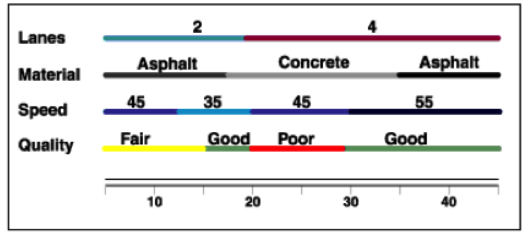
Consequently, if we were to attempt to segment the roadway in such a way to ensure all attributes were constant over the length of each segment, we would wind up with a highly segmented roadway. Alternatively, if we were to create a separate linear feature class for each roadway attribute, we would have a large number of feature classes that would need to be maintained. One solution to this problem is to separate the events data from the route geometry and maintain them in separate tables which relate to the route geometry according to the route name and a linear measure (for point events) or pair of measures (for linear events) which indicate the location of the event along the route.
There are many different ways one can locate an event along a route. For example, an event could be located according to its distance along the route in miles from the county line. Alternatively, the distance could be measured from the beginning of the route or some other established marker or datum. These different approaches are referred to as Linear Referencing Methods (LRMs).
Given the relationship between the events in the events table and the route features, GIS software can dynamically create feature classes for any specific event or combination of events. This process is known as dynamic segmentation. The standard set of geoprocessing tools can then be applied to these dynamically generated features just as they can be applied to a persistent feature class.
The entire system which an organization uses to allow for the separation of event data and dynamic generation of feature classes is known as a Linear Referencing System (LRS). LRSs have been used extensively with road networks, but they are applicable to other types of linear networks as well, including pipelines and hydrologic networks.
Speaker #2
Our second speaker will be Mr. Derald Dudley. Derald is a geographer and computer scientist in the Office of Spatial Analysis and Visualization (OSAV) which is part of the USDOT's Bureau of Transportation Statistics (BTS). He also chairs the Federal Geographic Data Committee (FGDC) Transportation Subcommittee.
BTS and the National Transportation Atlas Database (NTAD)
In April 1994, then-President Bill Clinton signed Executive Order 12906 titled “Coordinating Geographic Data Acquisition and Access: The National Spatial Data Infrastructure.” Since then, the FGDC together with their partner organizations have developed and revised a strategic plan to advance the National Spatial Data Infrastructure (NSDI). The most current version of the plan can be found here. [8] The USDOT’s Bureau of Transportation Statistics (BTS) [9] is responsible for overseeing the transportation components of the NSDI through the National Transportation Atlas Database (NTAD) [10]. Take some time to familiarize yourself with BTS and the NTAD. Also, take a look at the following datasets included in the NTAD: Highway Performance Monitoring System (HPMS) and the National Highway Planning Network (NHPN). Finally, read about the National Transit Map [11] which also generates datasets included in the NTAD.
5.5 Summary of Lesson 5
In this lesson, we learned about network analysis and the broad set of transportation problems it can be used to address. We examined how network analysis is implemented in ESRI's Network Analyst extension to ArcMap and examined the 6 categories of network analysis or solvers which it provides. In addition, you had the chance to get some hands-on experience with a few of the solvers. You will have additional opportunities to apply these tools in upcoming lessons as well.
Our transportation organizations of the week were state DOTs. We reviewed some the key functions these organizations perform and looked at how their roles have changed over the past century. You also explored a state DOT of your choice and became familiar with an example of how they use spatial technologies.
In our weekly webinar, we had the chance to interact with Frank DeSendi, the Manager of PennDOT's Geographic Information Division, and review how PennDOT utilizes spatial technology to help them identify potential impacts a transportation project could have on the environment. We also had the opportunity to interact with Greg Ulp, a senior project manager who was the technical architect for MPMS-IQ, a GIS application used by PennDOT to disseminate project information to the public and other interested parties.
In preparation for next week's webinar, we learned a bit about LRSs and dynamic segmentation, important topics in GIS-T which we will cover in more detail in next week's lesson. We also learned about the National Transit Atlas Database (NTAD) and some of the important datasets it contains.
Questions and Comments
If there is anything in the Lesson 5 materials about which you would like to ask a question or provide a comment, submit a posting to the Lesson 5 Questions and Comments discussion. Also, review others' postings to this discussion and respond if you have something to offer or if you are able to help.