Lesson 8: Traffic
Learning Outcome
What will we learn?
By the end of Lesson 8, you should be able to:
- list the different devices which are used to collect traffic count data;
- describe some of the primary uses of traffic count data;
- use a roadway video log system to monitor roadway assets;
- describe some of the work being done by Volpe, The National Transportation Systems Center;
- discuss some of the congestion pricing strategies that have been implemented around the world and list some of the outcomes which have been observed.
8.1 Traffic
There are two types of traffic data that state DOTs use. The first is live traffic data, and it is generally used to measure and address congestion. Often, live traffic data is measured by monitoring vehicle speeds. There are a number of companies that collect speed data by enlisting fleets of vehicles to share their location data. These companies sell the data to state DOTs and others interested in real-time traffic. One such company is INRIX.
The other type of traffic data that state DOTs use is traffic count data. There are a variety of devices which are commonly employed to obtain traffic counts. A few of the more common devices are described below:
- Automatic Traffic Recorder (ATR)
ATRs are permanent traffic counting devices which operate 24/7/365 and are installed below the road surface. ATRs capture traffic volume, but do not differentiate between vehicle types. - Continuous Automatic Vehicle Classification (CAVC)
CAVCs are also permanent traffic counting devices which operate 24/7/365 and are installed below the road surface. In addition to counting vehicles, these devices classify vehicles into the 13 categories which FHWA requires (see Figure 1). - Weigh-in-Motion (WIM)
Like ATRs and CAVCs, WIMs are also permanent traffic counting devices which operate 24/7/365 and are installed below the road surface. In addition to counting and classifying vehicles, WIMs also capture truck weights. - Short-Term In-Pavement (STIP)
STIPs are semi-permanent traffic counting devices much like ATRs. These devices are typically only used to collect counts once a year for a 24-hour period. - Portable Short-Term Counter
These are temporary traffic counting devices which make use of pneumatic tubing which is laid across the road. Different configurations can be used to achieve simple traffic counts or vehicle classification counts. The majority of traffic counts are performed using these devices.
The computers which capture, store, and transmit ATR, CAVC and WIM data back to a central location are typically housed in secure enclosures which are positioned alongside the roadway and are equipped with a permanent power source. STIP sites are not equipped with permanent computers and power. Instead, portable units are used to complete the period counts at these locations.
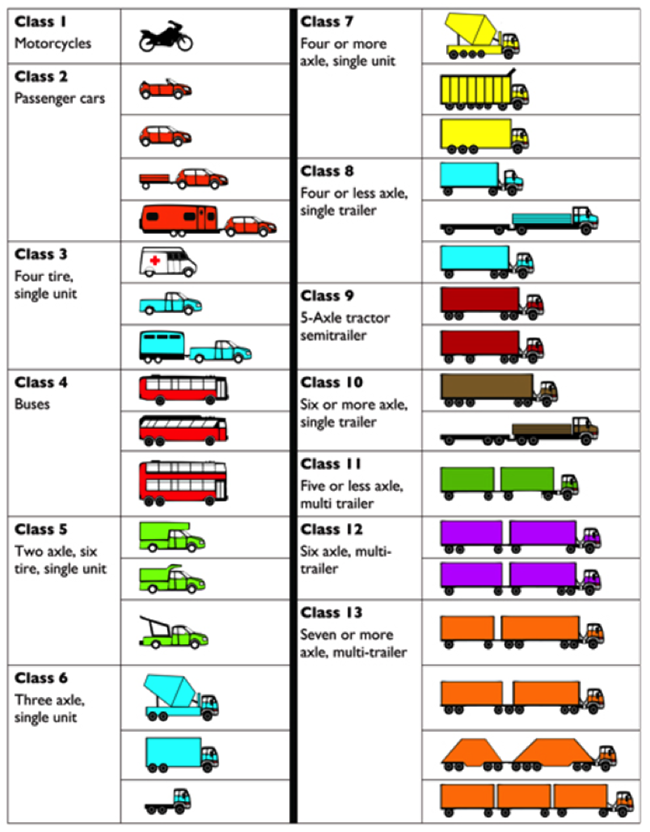
Class 1: Motorcycles
Class 2: Passenger cars
Class 3: Four tire, single unit
Class 4: Buses
Class 5: Two axle, six tire, single unit
Class 6: Three axle, single unit
Class 7: Four or more axle, single unit
Class 8: Four or less axle, single trailer
Class 9: 5-Axle tractor semitrailer
Class 10: Six or more axle, single trailer
Class 11: Five or less axle, multi trailer
Class 12: Six axle, multi-trailler
Class 13: Seven or more axle multi-trailer
Watch This
Watch the first 4 minutes of the Traffic Counting Training Video [1] below which was developed by PennDOT to train traffic count technicians.
Welcome to an overview of PennDOT's traffic counter training. As a traffic field technician, you'll be playing an important role for the Pennsylvania Department of Transportation. PennDOT's traffic monitoring system collects, analyzes, and maintains highway traffic data on over 40,000 miles of roads in Pennsylvania.
Specifically, you will help us collect information on traffic volume and vehicle classification throughout the state. With your assistance, over 10,000 traffic counts are taken annually in Pennsylvania. After all traffic data is collected in the field, it is submitted to PennDOT's central office where it is processed and used to make important decisions about highway design; safety and planning; for research to improve congestion management; to help design and install traffic control systems; to track statistics to help make air quality conformity determinations; to provide information for economic development; and for required federal reporting.
To assist with the collection of this data, traffic field technicians use five types of counting devices. Of these five types, three of them are permanent traffic sites that record information 24 hours a day, 7 days a week, 365 days a year.
The most sophisticated of these permanent devices are Weigh In Motion sensors or WIMs. These sites collect axle weight information as well as vehicle classification information.
The second type of device is the Continuous Automatic Vehicle Classifier or CAVC. These sites collect vehicle classification information.
The third type is the Automatic Traffic Recorder or ATR which collects traffic volume data. The permanent sites have a power source and collect traffic data through magnetic loop sensors, piezos, and/or Kistler sensors that are embedded in the road surface. A modem automatically transfers the data directly to the PennDOT central office daily.
The fourth type of counting device is a semi-permanent counting device commonly referred to as a STIP or Short-Term In Pavement site. The STIP is much like the ATR except that there is no counter in the roadside cabinet. A field technician installs the counter on a predetermined schedule, usually one time a year for a 24-hour period. The counter is then retrieved and the data downloaded and processed.
The fifth type of counting device is a Portable Short-Term Counter. A portable short-term counter installation is a count that is set for a 24-hour period. This type of traffic data collection device provides the majority of the traffic counts taken as part of our statewide count program. A portable short-term traffic counting device collects the data using pneumatic rubber tubing laid across a roadway and attached to a portable counter that has been secured along the side of the road. Tires passing over the road tube register axle counts. The installation of one road tube registers volume counts while a 2 road tube installation produces a vehicle classification count.
The following diagram shows typical setup configurations for portable short-term traffic volume and classification counts: center turn lane class count; center turn lane volume count; divided highway class count; divided highway volume count; two-lane class count; two-lane volume count.
The locations of PennDOT’s permanent traffic counters are presented in a series of district and county maps [2]. Below each map is a table identifying the county, route, segment, and offset of each device. You’ll use this information in Assignment 8-1.
The Value of Traffic Data
Traffic data has a wide variety of uses, a few of the most significant of which are listed here:
HPMS Reporting
One of the most significant uses is to comply with federal HPMS reporting requirements. As was covered last week, states need to report HPMS data to the FHWA each year. HPMS reporting is particularly important to state DOTs since the apportionment of federal funding is based on it.
Highway Safety Improvement Programs (HSIP)
HSIP is a federal aid program aimed at reducing traffic fatalities and major injuries. FHWA requires the project selection process to be data-driven. Traffic data is required to determine crash rates and, consequently, it plays an important role in selecting eligible HSIP projects.
Highway Design
Traffic count data is considered in the design of new roads and the rehabilitation and enhancements of existing roads.
Congestion Management
While real-time congestion management approaches typically use live traffic data based on vehicle speeds, traffic count data can be used to assess congestion and the prospective benefits of ITS technologies.
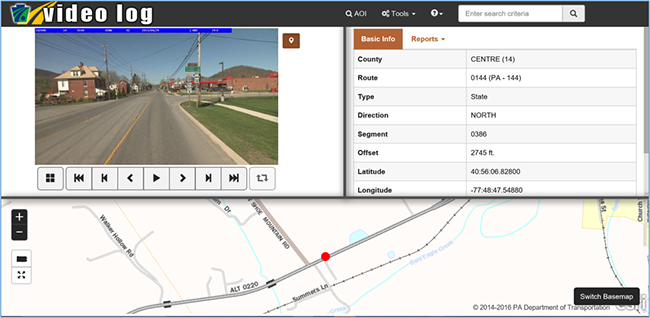
Roadway Video Logging
Many state DOTs acquire roadway video from specially equipped vehicles which drive all the state-owned roadways. The video data is then made available via a software application which allows users to go on a “virtual drive.” A few examples are Oregon Department of Transportation’s (ODOT) Digital Video Log (DVL) [3] system and PennDOT’s Video Log [4] application. There are many uses of roadway video systems, not the least of which is that they can serve as a means to monitor and maintain roadways and roadway assets, which is both safer and less expensive than an actual visit. The traffic group in PennDOT, for example, uses Video Log to scope out new locations for conducting counts.
8.2 Getting to Know a Transportation Organization
This week, you’ll take some time getting to know Volpe, The National Transportation Systems Center. Volpe, which is part of the USDOT, is located in Cambridge, Massachusetts and was founded in 1970. It provides a variety of engineering and scientific services to the public and private clients it services and is fully funded by the project work it performs. Its mission is to promote innovative ideas in order to improve the US transportation system. An overview of Volpe’s activities is provided here [5].
Congestion Pricing
Congestion pricing represents a variety of approaches which are aimed at shifting traffic away from a congested section of roadway by implementing pricing surcharges during peak periods to shift some traffic to off times, alternate roadways or alternative modes. In 2007 – 2008, the USDOT invested over a billion dollars to implement congestion-reducing strategies in six US cities. For two of the cities, Volpe was asked to conduct surveys to better understand how congestion pricing affects travel choices. A summary of Volpe’s findings is here [6].
To promote the use of congestion pricing, the FHWA published a primer series on the topic [7], the first of which provided a high-level overview of the concept.
8.3 Getting to Know Each Other
There are no one-on-ones scheduled this week.
8.4 Webinar for Next Week
Speaker
Our speaker will be Mr. Rodney Bunner. Rodney is a Geospatial Technology Specialist who, over the past twenty years, has worked as a consultant to local, regional, state, and federal agencies in developing spatially-enabled and GIS-T applications. He has contributed to the development of a variety of software products and tools within different government sectors including:
- Public Transportation agency support for planning and operations;
- Metropolitan/Regional Planning Organization support for multi-modal transportation planning including travel demand modeling and market assessments;
- State Department of Transportation highway asset management and linear referencing including interactive straight-line diagramming;
- Department of Defense (DOD) facility operations and asset management.
As a public-sector consultant, Rodney’s professional objective has been to develop software applications which streamline the technically challenging and time-consuming data integration, data development, and analytical processes required to fulfill specific government business needs and workflows. To this end, over the past thirteen years, he has been the lead developer for the Florida Department of Transportation’s (FDOT) TBEST Transit Planning software. TBEST provides public transportation agencies with business-specific data, analytics, and reporting tools to address everyday service and strategic planning tasks. Rodney supports numerous agencies throughout the U.S. in implementing and utilizing TBEST.
Rodney is currently the President of ServiceEdge Solutions, a technology company primarily focused on the development of geospatial applications for Transportation. He is a 1991 graduate of West Virginia University with a B.A. in Geography and a 1996 graduate of Shippensburg University of Pennsylvania with a M.S. in Environmental Studies. He currently resides in the Tampa, Florida area with his wife and two children.
Title VI Considerations for Public Transportation Providers
Title VI of the Civil Rights Act of 1964 is intended to ensure people are not discriminated against on the basis of race, color, or national origin in programs which utilize federal funding. Title VI, and the regulations which FTA has put in place to implement it, place specific requirements on transit providers, especially those who provide fixed route services.
Transit Boardings Estimation and Simulation Tool (TBEST)
TBEST is a tool developed by the Florida Department of Transportation (FDOT) to help organizations analyze existing fixed route transit service and potential service changes which are being considered. CUTR has played a big role in the development of the software and also in providing support to agencies who want to use it. A CUTR webinar (57:16) on TBEST can be found here [8]. I provide this link for your reference but watching it is optional. The main speaker in the webinar is Rodney Bunner, next week’s speaker. Consequently, Rodney will likely cover much of the same material in our webinar with him next week. This tool is a very powerful tool and you are able to download and install it for free if you would like. However, you do not need to install it to complete the course requirements.
8.5 Summary of Lesson 8
In this lesson, you learned about the different ways traffic data is collected and used. You also had the opportunity to review PennDOT’s Video Log application and use it to locate some permanent traffic counting devices.
Our transportation organization of the week was Volpe, The National Transportation Systems Center. You learned about some of the initiatives in which Volpe is engaged. In particular, you explored the concept of congestion pricing and reviewed some applications of these strategies including the manner in which they affect driver behavior and their overall effectiveness in mitigating congestion.
In our weekly webinar, you had the chance to interact with two transportation professionals. Mr. Jeff Roecker spoke about some of the tools and approaches PennDOT uses to improve highway safety and Mr. Jeremy Freeland spoke about HPMS reporting and the roles that spatial tools play in the implementation of a statewide traffic count program.
Finally, in preparation for next week’s webinar, you learned about a transit planning tool called TBEST and you reviewed some requirements that transit agencies need to meet which are based on Title VI of the Civil Rights Act of 1964.
Questions and Comments
If there is anything in the Lesson 8 materials about which you would like to ask a question or provide a comment, submit a posting to the Lesson 8 Questions and Comments discussion. Also, review others’ postings to this discussion and respond if you have something to offer or if you are able to help.