Lesson 9: Transit
Learning Outcomes
What will we learn?
By the end of Lesson 9, you should be able to:
- describe the nature of DRT services and the primary populations they are intended to serve;
- list some of the technologies providers use to help them manage DRT services;
- characterize the most common types of DRT fare structures;
- discuss some of the characteristics of fixed route transit and explain the structure and function of GTFS data;
- describe some of the functions and accomplishments of the Federal Transit Administration (FTA);
- share something you learned about one of your classmates and/or some ideas you discussed with a classmate about the content of this week’s lesson.
9.1 Transit
Transit organizations typically offer two distinctly different types of service: Demand Responsive Transportation (DRT) and fixed route transportation. Fixed route transportation operates according to prescribed routes and schedules whereas DRT does not. In this lesson, we will look at both of these types of transit.
Demand Responsive Transportation (DRT)
DRT is generally designed to provide curb to curb or door to door service for individuals who have special transportation needs such as seniors and persons with disabilities. The availability of DRT services can vary significantly from state to state and even county to county based on funding availability. DRT differs from taxi service in two fundamental ways:
- To use DRT, a rider must make an advance reservation (generally, at least 24 hours in advance).
- DRT is a shared-ride type service where multiple riders can be serviced at the same time, and a rider is generally not taken directly from their point of origin to their point of destination. Consequently, DRT trips can have substantially longer ride time than taxi trips.
DRT services are generally designed to serve rural areas where fixed route transit is not practical due to low ridership and also to complement fixed route services for those who live near a fixed route but are unable to use it due to physical or cognitive limitations.
ADA Complementary Paratransit
The Americans with Disabilities Act (ADA) of 1990 prohibits discrimination against persons with disabilities in a number of areas including public transportation. The FTA has defined a series of requirements public transit providers need to meet to comply with the ADA. These requirements are found in Title 49 Part 37 of the Code of Federal Regulations (CFR). In these regulations, the FTA requires fixed route providers to provide DRT service, comparable to the level of service provided to individuals who are able to utilize fixed route services, to persons with disabilities. DRT services designed to address the needs of persons with disabilities is known as paratransit service. Specifically, bus or rail fixed route providers are required to offer paratransit services to individuals who are unable to use the fixed route service due to physical and/or cognitive limitations, who live within ¾ of a mile of a fixed route and are traveling to a destination which is also within ¾ of a mile of a fixed route. This requirement is challenging and costly for transit providers to fulfill. It applies to all providers, and not just those who are receiving federal funding. It is also an unfunded mandate in that FTA does not provide grant monies to transit agencies to help offset the cost of compliance. You’ll complete an assignment next week to evaluate the eligibility of a series of trips for complementary paratransit service.
Technologies for DRT Services
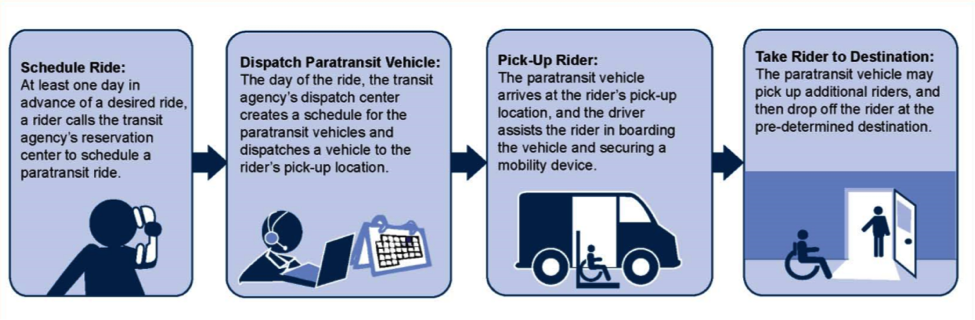
Providing DRT services in a way which is both cost effective and customer friendly is a very challenging task. The number of riders requesting service can vary substantially from day to day as can the trip origins and destinations. Service requests are initiated by riders through a call to a Customer Service Representative (CSR). Reservations typically need to be made at least 24 hours before service. Generally, the day before services are delivered, schedulers need to determine how to accommodate all of the reservations for the day with a limited number of vehicles and drivers. Further, the schedulers need to ensure a wide variety of constraints are met, including promised pickup time, required drop off times (e.g., for medical appointments) and total ride time. On the day of service, dispatchers work with the drivers to ensure all trips are successfully completed. Drivers follow a trip manifest which defines which stops they will visit and the order in which they will visit them. Drivers also need to track a variety of data elements at each stop including arrival and departure times, the passengers boarding and alighting at each stop, the vehicle odometer reading, and the amount of money collected from each passenger.
For all but the smallest providers, it would be very difficult to manage DRT service without technology. The most important technology which providers use is DRT software. Most DRT software assists the providers with all of the key tasks associated with delivering and reporting on the service. Many systems incorporate Automatic Vehicle Location (AVL) technology, which allows the dispatcher to monitor the location of all of their vehicles. This can be extremely useful in terms of ensuring drivers stay on task and follow the manifest. Some of the more sophisticated packages can do automated scheduling. These systems determine the best vehicle for a given trip reservation. DRT scheduling is very complex, owing to the large number of variables involved, many of which are related to human behavior, and as a result, even software that can do automated scheduling cannot produce good schedules without significant scheduler oversight.
Interactive Voice Response (IVR) technology is also playing an increasingly important role in DRT operations. Typically, systems which incorporate IVR will configure the system to automatically call riders the night before a scheduled trip to remind them of the trip and give them an opportunity to cancel the trip. Systems will also generally automatically call the riders when the vehicle is approaching their location. These calls, known as imminent arrival calls, are valuable for both the provider and riders. Providers benefit because the calls ensure riders will be ready, and riders benefit since the calls give them a clear idea of when to be ready and eliminate the need for them to wait outside for a prolonged period. IVR plays a significant role in reducing “No-Shows” where the driver gets to a location to pick up a rider and the rider is not there. No-shows add additional costs to a service which is already expensive to provide.
Many providers give their drivers Mobile Digital Computers (MDC) which serve a variety of functions. More and more DRT software vendors are shifting to tablet technology instead of using proprietary hardware. MDCs provide additional communications with dispatch via canned or ad hoc text messages. The MDCs also generally present the trip manifest information to the driver in an electronic form and tell the driver their next stop location, how well they are adhering to the schedule, how many passengers should be boarding and alighting at each stop, and how much money they should collect from each person. The driver also uses the MDC to capture the information they need to collect such as the stop arrival time, the passengers who boarded and who alighted the vehicle at the stop, how much they collected from each rider, and what time they departed from the stop. MDCs can also be configured to provide the driver with turn-by-turn directions and eliminate the need for a separate GPS device.
Fare Structures
Transit agencies use a number of different methodologies to establish a fare structure for their DRT services. The three most common are listed below:
Flat – In a flat fare structure, as the name implies, the cost of the trip is the same regardless of origin and destination, assuming both are within the agency’s service area.
Zone-Based – In a zone-based fare structure, the agency divides its service area into zones. The zones are generally comprised of a series of concentric circles or a rectangular grid which blankets the service area. Fares are then established for each origin and destination zone.
Mileage-Based – In a mileage-based fare structure, the agency develops a series of mileage-based tiers and associates a fare with each. The mileage associated with each trip depends only on the origin and destination and not on other pickups or drop-offs the driver may have performed while the passenger is in the vehicle. Consider the following example:
Ellen makes a reservation to go to the senior center on Monday at 10 am. On Friday afternoon, the agency’s scheduler is working with their paratransit software to finalize the driver manifests (i.e., schedules) for Monday morning. This process involves determining the most efficient way to deliver the service while at the same time observing customer service policies such as ensuring all riders get to their appointments on time and do not exceed the maximum onboard time established by the agency. On Monday morning, the drivers depart the transit agency and begin to execute the manifests (i.e., schedules) that have been prepared for them. The driver assigned to pick up Ellen arrives at her house to pick her up at 8:45 am. The driver then drives to Allen’s house to pick him up and on to Sue’s house to pick her up. He then drives to the VA hospital to drop off Allen and to Walmart to drop off Sue. Finally, he drives to the senior center and drops Ellen off at 9:50 am.
The driver may have visited many stops while Ellen was on the vehicle, but the mileage used for fare determination is based only on the route from her origin to her destination. When an agency uses a mileage-based fare structure, they can base the mileage on the fastest route from the origin to destination or the shortest distance route from the origin to destination.
9.2 Fixed Route Transit
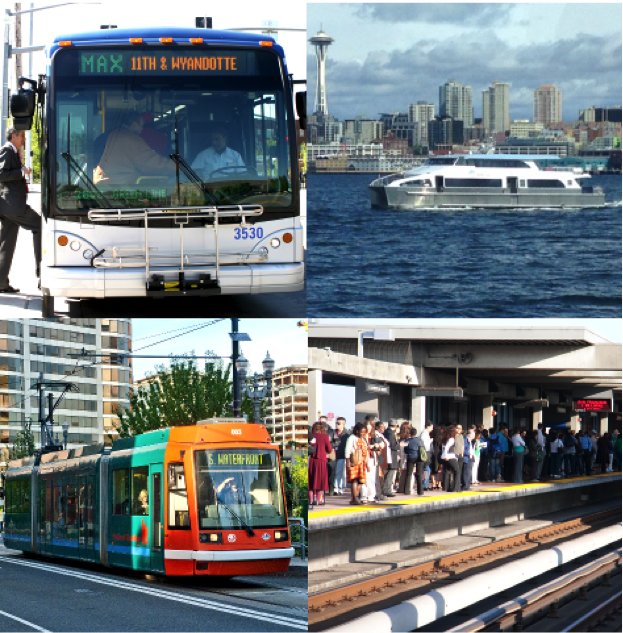
Fixed route transit services can be defined as services which operate on predefined routes according to a set schedule. The services can be divided into a number of more specific modes including:
- Local Bus
- Commuter Bus
- Express Bus
- Bus Rapid Transit
- Light Rail
- Subway
- Ferry Boat
Routes and Patterns
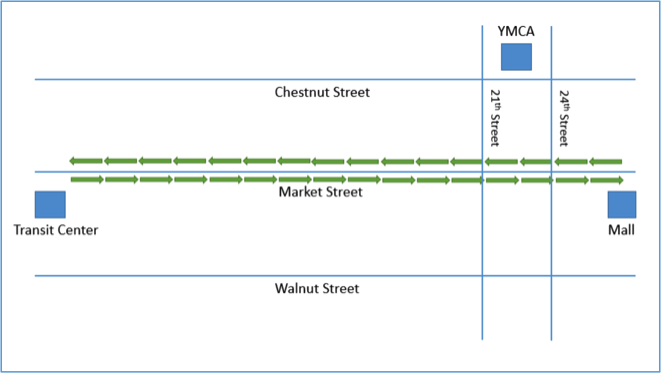
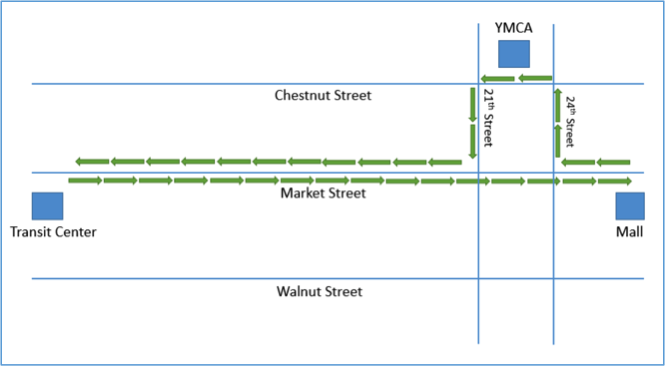
Fixed route buses operate on designated routes according to a published schedule. One can think of routes as generalized paths buses follow. For example, Route 1 may be structured to provide service along Market Street. It may begin at a transit center where riders can transfer from one route to another or even to a different mode such as light rail or subway and travel along Market Street until it reaches some terminal point at which time it returns along Market Street to the transit center. The specific path each route traverses can depend on the time of the day, the day of the week, and even the time of year (e.g., summer service). Each distinct path associated with a route is called a pattern. As an example, Figure 9.2 and Figure 9.3 show two patterns for the same route. The route generally follows Pattern 1, but at times during the day when the YMCA is busiest, it follows a somewhat different pattern.
Trips, Headway, Interlining, and Vehicle Blocks
When one uses the term trip in regards to DRT, it generally refers to the transport of a rider from their point of origin to their desired destination. In fixed route, the term trip has a different meaning. Over the course of a day, service along a route will generally be offered a number of times. For example, service along Market Street, in the above example, may occur at a frequency of twice an hour from 9 am to 4:30 pm, with a bus leaving the transit center every 30 minutes. In the world of fixed route, a trip corresponds to a bus completely traversing the route one time. The period of time between each trip is called the headway. In this example then, there are 16 trips and the headway is 30 minutes. If it takes more than 30 minutes to complete a single trip, then it will take multiple buses to provide service along Market Street. Sometimes a bus will operate a single route the entire day, and sometimes a bus will service multiple routes. When a bus completes a trip on one route and then begins a trip on a second route, it is referred to as interlining. A bus's schedule for an entire day is called a block. For example, Bus 2a may operate on Route 1 from 9 am to 12:30 pm, at which time it is used on Route 2 from 1 pm to 5 pm. The block for Bus 2a would be the sequential set of trips it completes over the course of the day on Routes 1 and 2.
Stops, Time Points, and On-Time Performance
A stop is a designated location along a route where riders can get on or get off the bus. The bus is obligated to stop at certain stops known as time points. These are stops that appear on the bus schedule. Generally, a transit agency will have a policy that a bus should not depart a time point before the scheduled time. How well a transit provider adheres to its published schedule is referred to as its on-time performance. It is important for transit providers to adhere to their schedules since riders depend on transit to get to their destinations on time. There are also stops along a route which are not time points. The bus will only stop at these stops if a rider is waiting at the stop or if a rider wishes to alight the vehicle at the stop. In addition to defined stops, some providers accommodate flag stops. A flag stop is an arbitrary location along the route where a rider wishes to board or alight the bus. The rider needs to flag the bus down in order to board or alert the driver they wish to alight the bus at that location.
Runs and Run Cutting
Sometimes, a single driver will operate on the same bus and route all day long. At others times, the driver may operate on a number of buses and/or routes over the course of the day. The collection of trips a driver performs over the course of their shift is known as a run. Just as a block represents a bus's schedule for the day, a run represents the driver's schedule for the day. Matching drivers with the pieces of work a transit provider needs to staff is known as run cutting. Run cutting can be a complex process at least in part because drivers and other staff often belong to a union, and the labor agreements which have been negotiated can have many different rules which need to be followed.
Fixed Route Technologies
Fixed route providers use a large number of technologies to manage operations and provide good customer service. The most significant of these technologies are described briefly below:
Fare Collection
There are a variety of fare collection technologies which fixed route providers use to collect and securely store fares. Some fare boxes are able to assist the driver in verifying that cash-paying riders provided the correct fare. Registering fare boxes are able to count coins and bills, but they cannot differentiate between different denominations of bills. For example, a registering farebox can’t tell the difference between a one dollar bill and a twenty dollar bill. Validating fare boxes can do everything a registering fare box can do and, in addition, can differentiate between different denominations of bills. Registering and validating fareboxes also generally allow the drivers to keep track of the types of passengers who are boarding (e.g., seniors, persons with disabilities, children, etc.). For providers who have relatively low ridership, it is difficult to justify the cost of registering or validating fare boxes. For these types of providers, a vault style fare box is often the most logical choice. A vault style fare box does not count cash payments. Instead, the upper compartment is generally transparent which allows the driver to confirm the correct fare was provided before it is dropped into the lower compartment. Many providers are moving toward providing more flexible payment options. Touch cards are a convenient type of fare media which are growing in popularity. Riders can generally add additional value to these cards using a ticketing machine or via the web.
Computer Aided Dispatch / Automatic Vehicle Location (CAD/AVL)
Many transit organizations who operate a fixed route bus service use CAD/AVL. CAD/AVL systems consist of onboard hardware to track the buses, and software which helps the dispatchers to manage service as it is occurring and resolve issues as they arise. CAD/AVL allows the dispatcher to see where all the agency's vehicles are on a map and to quickly determine which are on schedule and which are ahead of schedule or behind schedule.
Automatic Passenger Counters (APC)
APCs are simple devices which are mounted by each door and count the number of passengers boarding and alighting the bus. While there are different types of APCs on the market, the most common employ a series of infrared beams. Each time the beams are broken, the system counts it as either a boarding or alighting. During busy times, the devices can miss a passenger here and there. The devices can also have a hard time with children, especially if they are carried onto the bus. The data collected via APCs can be used to determine the current onboard passenger count, a piece of information that is sometimes made available to the riding public along with other real-time bus information. Transit agencies sometimes also use APC data to fulfill part of their reporting NTD requirements to the FTA but, in order to do so, they need to demonstrate that their APCs meet certain accuracy requirements. You'll learn about NTD reporting later in this lesson.
Automated Announcement Systems (AAS)
In order to comply with ADA requirements, fixed route vehicles are generally equipped with an AAS which provides both audible announcements and visual announcements about upcoming stops and points of interest. These systems are generally triggered based on the vehicle's position as it approaches a designated location. Most systems utilize geofences to determine when an onboard announcement should be made.
Vehicle Surveillance
Most fixed route vehicles are equipped with camera systems which record activities on the bus as well as outside the bus. It is common for a bus to have 6 separate audio and video streams with some of the larger articulated buses being equipped with 8 separate streams. The video from these buses is stored in onboard DVRs and can be streamed by dispatch if needed. The DVR capacities are generally sufficient to store a few weeks of video before overwriting. The systems are configured to automatically flag sections of video in the event the system senses any unusual forces due to a collision or abrupt deceleration or turn. The driver can also press a button to manually flag a section of the video. When the system flags a section of the video, it preserves a window of time which brackets the triggering event for later review. Flagged sections of video are often wirelessly downloaded when the bus returns to the depot. Vehicle surveillance systems are extremely useful for identifying undesirable driver behaviors and incidents onboard the bus, as well as helping to determine the cause of any bus-related accidents. Local police are also sometimes interested in this video if they believe it may be of use in solving or prosecuting a case.
Real Time Passenger Information
Real time passenger information systems have become extremely popular in recent years. These systems make real-time bus information available to riders via web applications, smartphone applications, and dynamic message boards which are sometimes located as transit centers or other high traffic stops. In Lessons 8 and 9, we looked at an example of one which CATA uses called MyStop.
Rider Alerts
Transit providers often offer rider alert systems to notify users about disruptions in services or to provide other types of notifications. Riders can typically sign up for alerts related to specific routes and/or system-wide alerts.
Scheduling Software
Developing and adjusting routes, patterns, stops, trips, and blocks can be challenging especially for larger transit providers. Scheduling software is designed to assist agencies in this regard. Scheduling software also often incorporates some functions to assist with run cutting as well.
Vehicle Health Monitoring
Many buses come equipped with vehicle diagnostics that can transmit various vehicle health information back to the transit agency. This technology helps to ensure problems are taken care of before they lead to vehicle breakdown. Some vehicle health systems integrate with maintenance management systems and can automatically schedule vehicles for preventative maintenance.
Trip Planning/Google Transit
Many fixed route providers offer trip planning services to their riders. These services are generally web-based and allow the rider to indicate their origin, destination, and desired date and time of departure or date and time of arrival. The trip planning service then presents options which define a combination of walking and fixed route options that best meet their needs. The options may involve one or more transfers between fixed route vehicles. The most popular fixed route trip planning service is Google Transit. The idea for what has become Google Transit was first spawned by TriMet, a transit agency which services Portland, Oregon. TriMet approached MapQuest, Yahoo, and Google to see if they would be interested in incorporating transit data into their map products, but only Google replied. The Google Transit Trip Planner launched on December 7, 2005. Google transit incorporates stops, routes, schedule, and fare information for a provider’s bus, subway, rail, and/or light rail service. The service is automatically available as a free service via Google Maps in any area where one or more local transit providers publish their data to Google.
For most of the first year, TriMet was the only operator available on Google Maps. In September 2006, five more cities got on board: Eugene, OR; Honolulu, HI; Pittsburgh, PA; Seattle, WA; and Tampa, FL. Today, Google Transit spans many hundreds of cities [1].
In order for transit providers to submit their fixed route information to Google in a consistent way, a data specification was required. The specification which was developed for this purpose is discussed in the next section. As mentioned above, Google Transit is a free service to transit agencies and to the public who can perform trip planning in Google Maps. However, if you wish to tie into the capabilities programmatically to incorporate the power of Google Transit (or more generally Google Maps) into your own software application, there are often associated fees you need to consider. A popular and robust alternative open source trip planning system is Open Trip Planner [2].
General Transit Feed Specification (GTFS)
The specification which was developed to allow transit agencies to publish their fixed route data to Google Transit is known as GTFS. Originally it stood for the Google Transit Feed Specification, but in 2010, Google changed the name to the General Transit Feed Specification given its growing status as the default specification for transit data. GTFS is an open data standard which represents fixed-route schedule, route, and bus stop data in a series of 13 comma-delimited text files compressed into a ZIP file. Each of the 13 text files contains a series of fields or attributes about a component of the fixed route service. Some of the files and fields are optional (see Table 1).
| Required | Optional |
|---|---|
| Agency.txt | Calendar_dates.txt |
| Stops.txt | Fare_attributes.txt |
| Routes.txt | Fare_rules.txt |
| Trips.txt | Shapes.txt |
| Stop_times.txt | Frequencies.txt |
| Calendar.txt | Transfers.txt |
| Feed_info.txt |
Click for description of each table [3] along with the meaning of each field.
The primary use of GTFS data is to publish fixed route schedule data to Google Transit so that riders can perform trip planning. However, there are many other potential uses for GTFS data. For example, transit planning software systems such as TBEST commonly allow users to upload route, stop, and schedule data in GTFS format. In the past few years, Google has created a new specification based on GTFS which incorporates real-time information in addition to the static schedule data. The new specification is known as GTFS Real Time [4] and is starting to gain some traction among transit agencies, but is not yet widely used.
In Assignment 9-2 you’ll have a chance to work with GTFS data from a transit agency in Tampa, Florida. Specifically, you’ll use the route geometry contained in the shapes.txt component of the GTFS data to establish the zone for ADA complementary paratransit.
The following assignment is optional. You do not need to complete this assignment to fulfill the requirements of the course. TBEST is a powerful tool for transit planning and is available for free. If you have an interest in the tool, this assignment will help you to get some hands-on experience using it.
Optional Assignment
In this assignment, you’ll get a chance to get some hands-on experience with TBEST as you explore some of its many features. Prior to doing this assignment, you will need to download and install TBEST Version 4.4 for ArcGIS 10.5. As part of Assignment 8.6, you reviewed some tutorial videos which are available to help users learn how to use the features TBEST offers. In preparation for this assignment, watch the tutorial videos on scenarios, network tools, TBEST reporting, and the attribute search tool. TBEST also has a comprehensive users' guide [5]available from both the website and the help menu within TBEST. Complete the following activities.
- Open TBEST.
- Download Socio-Economic data, GTFS Data, and a transit system logo.
- Under the File menu, select “Downloads”, select “Download Socio-Economic Support Data...”, and finally select “Florida 2014 Population 2014 Employment 2015 Parcel”, and click “Download”.
- Download the latest GTFS file [6]for HART.
- Download the transit system logo [7]for HART.
- Create a new transit system.
- For this assignment, you’ll model Hillsborough Area Regional Transit (HART) which services Tampa in Hillsborough County.
- In the TBEST explorer window, right click “Transit Systems” and select “New System”.
- You will be prompted to select the source socioeconomic data. The only option you have is the data you downloaded in step 2. Select it and click “Ok”.
- On the “New Transit System” dialog, enter HART as the transit system name.
- Select Hillsborough County as the extent.
- Leave the remaining settings alone and click “Ok”.
- It will likely take 60-90 minutes to compile the socioeconomic data and parcel data for Hillsborough County, Florida.
- Create a new TBEST Scenario.
- In the TBEST explorer window, expand the HART transit system you created in step 5.
- Right click “Scenarios,” and select “Create a New Scenario…”
- Name the new scenario “2017 Base Conditions”.
- Select “TBEST Land Use Model 2016” as the scenario model (it is the only option).
- Enter “2017” as the Forecast Year.
- Select an average annual wage for Hillsborough County and enter it as the mean annual wage for the scenario.
- Enter “2” as the annual growth rate.
- Click “Ok” to create the new scenario.
- Create HART’s Fixed Route Network.
- You’ll create HART’s fixed route network by importing their latest GTFS data file. As an alternative, you could manually create the network in TBEST, but that would be time-consuming.
- In the TBEST explorer window, right click on the “2017 Base Conditions” scenario and select “Import Routes from GTFS”.
- On the TBEST GTFS Network Import dialog, select the GTFS.zip file downloaded in step 2b as the source GTFS zip file.
- Select the top three checkboxes (i.e., Weekday, Saturday, and Sunday) to select all service periods.
- Click “Load Routes” to load all routes.
- Check “Select All” in the lower left corner of the dialog to select all routes.
- Click the “Import” button to begin importing the network.
- You will be prompted for confirmations 2 times. Click “Ok” to both.
- Once the network has been successfully imported (it should take about 10 minutes), you can exit the GTFS Network Import screen.
- Exploring HART’s Fixed Route Network.
- Right mouse click on the newly created “2017 Base Conditions” scenario and select “Open Scenario”.
- Grab a screenshot of the resulting map showing HART’s routes. (5 points)
- In the routes window, expand Route 1 – Florida Avenue.
- Expand the Northbound Patterns.
- Double click Pattern 40317.
- TBEST automatically highlights the pattern and associated stops on the map.
- In addition, the segments and stops are automatically populated in their respective windows.
- Grab a screenshot of the entire TBEST window with Pattern 40317 selected. (2 points)
- TBEST has powerful search capabilities which allow you to find and select a group of stops, segments, or routes based on attribute filters. The search tool is available on the main TBEST toolbar (binoculars) or via the Scenario menu.
- Open the search tool and search for stops associated with express routes.
- To do so, select “Stops” as the Category, “Route Type” as the attribute, “Equal To” as the Operator (i.e., “Is”), and “Express” as the Value.
- Click “Add to Search Criteria” to add the filter.
- Click “Apply” perform the search.
- Grab a screenshot of the map showing the express route stops selected. (3 points)
- Group selecting routes, segments, and stops in this manner is useful for mass adjusting attributes for alternative scenario modeling. For example, you could use the stop calculator to adjust the headway of all currently selected stops to 20% less than each stop’s current headway setting.
- Set Socio-Economic Growth Rates and Base Fares.
- Under the Scenario menu, select the “Set Socio-Economic Growth” submenu, and finally “Enter Growth Rates”, to bring up the “Socio-Economic Data Growth Rates” dialog.
- Enter 2% in total population. By default, this rate will be used for the other factors as well.
- Click “Set Growth Rates” to apply the rates and close the dialog.
- To establish the base fares, open the System Fare Levels Dialog ($ Icon on the main TBEST toolbar, or select “System Level Fares” from the “Scenario” menu).
- Base fares are set according to the route type. All of HART routes are of one of three types: Circular, Radial, and Express.
- In the dialog enter $6 for the express routes and $4 for the circulator and radial routes.
- Click “Ok” to apply the fares and close the dialog.
- Running the Model.
- You are now ready to run the model. To do so, right-click the “2017 Base Conditions” scenario in the TBEST explorer window and select “Execute Model Run”.
- On the “Scenario Model Run” dialog, you will use the default settings and click “Run”.
- You will be asked to confirm the run and whether you want to save changes to the scenario. Click “Yes” to both.
- It will take about 20 minutes to run the model.
- Examining Model Results.
- On the “Scenario” menu, select “Model Reports” and then “Scenario Summary Tool”.
- Select the HART transit system and the “2017 Base Conditions” scenario.
- Leave the default “Summary Span and Time Period” settings as is, and click “Show Report”.
- Explore the results presented here.
- Examine the performance measures “Boardings Per Service Hour” and “Boardings Per Stop Visit”.
- Which route has the highest “Boardings Per Service Hour”? (2 points)
- Generate a chart showing these 2 performance measures for the HART express routes and a handful of the non-express routes (Hint: You can use the TBEST search tool to identify express routes).
- Examine how the relationship between these 2 performance measures in general differs between express routes and other routes (e.g., “Boardings Per Service Hour” are high and “Boardings Per Stop Visit” are low).
- Grab a screenshot of the chart. Identify the routes which are express routes. Describe any difference in relationship you observe. How might you account for your observations? (3 points)
- Title VI Analysis
- To run a Title VI Analysis, you need to have all scenarios closed. You can close any open scenarios by clicking “Close Scenario” on the main TBEST toolbar.
- Right mouse click on Title VI Analysis in the TBEST explorer window and select “New Title VI Analysis”.
- Name the new analysis “Route 1 Title VI Analysis”.
- Select “HART” as the transit system.
- Select “2017 Base Conditions” as the scenario.
- Leave the buffer distance as 0.25 miles and click “Next”.
- Leave the service area setting as Hillsborough County and click “Next”.
- On the Poverty Levels screen, adjust the poverty incomes to reflect the 2017 values [8]from the Department of Health and Human Services and, once done, click “Next”.
- On the “Route Selection” screen select Route 1 and click “Next”. (Note: we are running just 1 route for this exercise, so the analysis will complete faster.)
- Upload the transit system logo for HART and click “Next”.
- Click “Next” on the “Jurisdictional and Rex Route Input” screen.
- The Major Roads screen already has the correct shapefile selected. For states other than Florida, you would need to download the correct TIGER road data. Click “Next”.
- Click “Finish” on the “Title VI Setup Screen”.
- Click “Yes” on the confirmation screen.
- After a few minutes, the Title VI Analysis will finish, and the “Title VI Analysis Console” appears. On the left side of the console, there is a variety of maps, and on the right side, there are a series of reports. Maps open in ArcMap.
- Spend a few minutes exploring the variety of output. Grab a screenshot of 1 map and 1 report you find interesting and briefly describe each. (5 points)
9.3 Getting to Know a Transportation Organization
This week, you’ll take some time to get to know the Federal Transit Administration (FTA). The FTA is the administration within the USDOT which focuses on providing financial and technical support to public transportation agencies across the United States. The FTA was created in 1970 by President Lyndon Johnson, although, back then, it was known as the Urban Mass Transportation Administration (UMTA).
This short video (12:45) summarizes some of FTA’s accomplishments over the past 8 years and provides examples of how it has directed federal funds.
ON SCREEN TEXT: Together a look back at the last 8 years. (Countdown begins:) 2016, 2015, 2014, 2013, 2012, 2011, 2010, 2009, 2008. With growing congestion...[TRAFFIC NOISES] and aging infrastructure [CREAKING BRIDGE]...with an economy in freefall [IMAGES OF NEWSPAPER HEADLINES ON FINANCIAL CRISIS]
January 20, 2009. "Starting today, we must pick ourselves up, dust ourselves off, and begin again the work of remaking America." [IMAGES OF FORMER PRESIDENT OBAMA'S INAUGURATION}
BARACK OBAMA: For everywhere we look, there is work to be done. The state of our economy calls for action, bold and swift, and we will act -- not only to create new jobs, but to lay a new foundation for growth. We will build the roads and bridges, the electric grids and digital lines that feed our commerce and bind us together.
ON SCREEN TEXT: Together we answered the call. To meet growing demand, to replace again infrastructure, to get our economy moving again, President Obama and Congress acted.
BARACK OBAMA: Building a world-class transportation system is part of what made us a economic superpower. There are private construction companies all across America just waiting to get to work. There's a bridge that needs repair between Ohio and Kentucky that's on one of the busiest trucking routes in North America. Public transit project in Houston that will help to clear up one of the worst areas of traffic in the country.
ON SCREEN TEXT: The American Reinvestment and Recovery Act (ARRA). Over the next four years, USDOT awarded 1,072 ARRA grants totaling $8.8 billion, creating or saving 10,322 jobs. Transportation Investment Generating Economic Recovery (TIGER) grants: Also, in 2009, Congress passed legislation establishing the TIGER program. TIGER grants have provided $5.1 billion to 421 projects, helping build multi-modal, road, rail, transit, and port projects and rebuilding communities.
Dilworth Plaza, Philadelphia, PA. A $15 million TIGER grant transformed a deteriorated plaza at City Hall and helped create a new, accessible gateway for local and regional transit.
Kansas City, MO Streetcar. A $20 million TIGER grant helped generate $1 billion investment in KC's downtown. Kansas City Streetcar opening, May 2016.
East Liberty Transit Center, a $15 million TIGER grant renovated an aging bus station and consolidated unsafe loading points along Pittsburgh streets. East Liberty Transit Center, Pittsburgh, PA, October 2015.
Denver Union Station, a $388 million TIGER grant helped renovate a station that anchors a bustling downtown and spun off new development. Denver Union Station Renovation March 2014.
LYNX Lymmo BRT, a $13 million TIGER grant enabled this new line, which connects to other transit modes and revitalizes Orlando's urban core. LYNX Lymmo BRT Groundbreaking, Orlando May 2015.
In 2010, transit ridership reached 10 billion, its highest level since the 1950s.
Capital Investment Grants: new starts, small starts, core capacity. Since 2008, FTA has funded 37 Capital Investment Grant projects totaling $12.6 billion. Since 2008, CIG projects have resulted in 296 miles of rail & 158 miles of Bus Rapid Transit.
Other FTA grant programs. Since 2010, FTA has awarded close to $3 billion to 601 competitively funded bus projects. That funding led to the purchase of more than 53,000 buses since 2009. FTA has also funded the purchase of over 27,000 other transit vehicles, such as paratransit vans: GO Transit- Durham, NC, Capital Metro - Austin, TX, Niagara Frontier - Buffalo, NY, KCATA - Kansas City, MO, CATS - Charlotte, NC, Free Ride Transit - Breckenridge, CO.
Since 2009, FTA has awarded close to $286 million for tribal transit: Los Alamos, NM, Muscogee Creek Nation, Mississippi Band of Choctaw Indians.
Since 2013, FTA has funded 44 Passenger Ferry grants totaling $119 million: Channel Cat - Quad Cities, Iowa, Staten Island Ferry, NYC DOT, Kind County Ferry - Sound Transit. But America requirements have contributed to a strong U.S. manufacturing sector and supported American jobs. Together we helped rebuild our economy, meet growing demand for transit, and begin to fix our aging infrastructure. Together we faced emerging challenges. Together we're making the transit, the safest form of transportation, safer. MAP-21 and the FAST Act gave FTA new and enhanced authority to help keep public transit safe and reliable. Since 2012, with your input, FTA has issued: 3 final safety rules, 3 proposed safety rules, 7 safety advisories, and is working to strengthen state safety oversight.
Natural Disasters and Climate Change. In 2012, Hurricane Sandy struck the East Coast. Since 2013, FTA has awarded $10.2 billion in grants focused on Sandy recovery and resiliency. Extreme weather events highlight the dangers of climate change. Together, FTA and our transit partners are developing strategies to prepare for and adapt to climate change.
The transportation industry as a whole is a major contributor of carbon pollution, but public transportation can help. FTA's Low and No-Emission Program aims to improve air quality and reduce climate change through new bus technology. Since 2012, FTA has funded 37 Low - and No-Emission Grants totaling $132.5 million.
Declining Infrastructure. In 2013, the transit industry's deferred maintenance and replacement needs was estimated at $86 billion and it keeps growing. Transit Asset Management Final Rule July 2016. TAM provides a strategic approach to improve & maintain transit capital assets and requires providers to create plans to address their maintenance needs.
"When the rungs on the ladder of opportunity grow farther and farther apart, it undermines the very essence of America" - President Obama
"Transportation is about more than getting from on point to another, it's about getting from where you are to a better life." - Transportation Secretary Anthony Foxx
As part of DOT's Ladders of Opportunity bus program, DOT awarded $26 million to Detroit. The city bought 50 buses easing overcrowding, reducing wait times, and providing more reliable service, particularly in lower income areas. Together we've built ladders of opportunity.
Since passage of the Americans with Disabilities Act in 1990, transit has become more accessible. Thanks to transit providers, 99.8% of buses are accessible. All rail stations built since 1990 are accessible. In addition, 671 of 680 key stations in our nation's oldest rail systems are accessible.
Since 2012, FTA has issued three civil rights Circulars helping the industry provide more equitable service.
Since 2013, FTA has funded 21 Transit-Oriented Development Grants totaling $19 million. Together, we're using well-planned TOD to create more desirable places to live, work, and visit.
FTA's Rides to Wellness initiative improves access and reduces healthcare costs through partnerships between health care and transit industries. New in 2016, Rides to Wellness Grants awarded $7.3 million to 19 projects.
Together we've helped communities across the country:
- Twin Cities Central Corridor Light Rail; $474 million CIG funding.
- Pocatello Regional Transit Center; Bannock County, Idaho; $1.4 million Bus Grant
- Metrolink Commuter Rail, Perris Valley, CA; $75 million CIG funding
- Dallas Area Rapid Transit's 24-mile Green Line Light Rail; $700 million CIG funding
- Austin Metro Rapid BRT; $38 million CIG funding
- SunRail Commuter Rail, Central Florida; $93.4 million CIG funding
- Utah TRAX Light Rail, Salt Lake City; $460 million CIG/ARRA funding
- LA Metro Rail System, $4.1 million CIG funding
- CT FasTrak, Hartford, Connecticut; $275 million CIG funding
- VelociRFTA BRT, Roaring Fork Valley, Colorado; $25 million CIG funding
- TriMet Orange Line light rail extension/Tilikum Crossing, Portland, Oregon; $745 million CIG funding
Together, we are embracing the future. The FAST Act was the first long-term infrastructure funding bill since 2005. While it provides certainty for transit systems, we still need a stable funding source for the future. Technological innovation is bringing us the chance to solve old problems in new ways. FTA's Mobility on Demand program will provide $8 million for innovative integrated multimodal solutions.
At FTA, we're proud of all that we've accomplished...Together:
- State Safety Workshop, July 2016
- Birmingham, AL TIGER announcement September 2015
- ADA Event, Washington, DC August 2015
- Metrolink Commuter Rail Extension, December 2016
- Denver Light Rail to DIA Opening, April 2016
- WMATA New Rail Car Announcement May 2015
- SEPTA Wayne Junction Commuter Rail Opening, April 2015
- Veterans Transportation and Community Living Initiative Grant Announcement, Albuquerque, NM
- Cleveland Cedar-University Rapid Station Opening, August 2015
- El Paso Northgate Transfer Center Opening, September 2013
- Jacksonville, FL First Coast Flyer BRT Groundbreaking, November 2014
- Bethesda, MD ADA Event August 2015
9.4 Getting to Know Each Other
This week, you’ll have a one-on-one chat with one of your classmates as per the schedule you were provided in Week 1. The discussion should be at least 30 minutes in length. If it’s the first time you’ve chatted with each other, spend the majority of time getting to know each other. Otherwise, focus on discussing the lesson content.
9.5 Webinar for Next Week
Public transit organizations provide important services which alleviate congestion and which offer mobility to those who have no other transportation options. While they all have some common objectives and challenges, transit organizations are each unique, based largely on differences in the communities they serve and in the political landscape they operate under at both the state and local level. Next week, we'll hear from 2 speakers who represent two separate transit organizations.
Speaker #1
Our first speaker will be Dr. Minhua Wang. Dr. Wang has over 25 years' experience in IT and GIS, has served multiple positions in government agencies, software development companies, and consulting firms. Dr. Wang has developed expertise and reputations in the areas of GIS for transportation or (GIS-T), Public Transit, and transportation software development and implementation. His experiences in the transportation GIS field include data modeling, enterprise architecture design, system integration, application development, asset management, and GIS technology implementation. Dr. Wang currently serves as GIS Manager in the Washington Metropolitan Area Transit Authority (WMATA). He has overall responsibility for administrative, technical and managerial tasks necessary for the development and operation of Metro’s enterprise Geographic Information System. He has involved considerable interaction, cooperation and collaboration with managers throughout Metro, and officials of other public agencies and regional partners in the design, development, and implementation of the geographic information system and related products to meet various needs and functions. Prior to WMATA, Dr. Wang served as Project Manager at DC Department of Transportation (DDOT), Group Leader at CitiLabs (a Transportation Planning Software company), Enterprise Architect at KCI Technology Inc., and Technical Architect/Director of Application Development at Geodecisions. Dr. Wang holds a Ph.D. degree in GIS from the University of Waterloo, Canada, and an MS degree in Remote Sensing and a BS degree in Geography from Peking University, China.
Washington Metropolitan Area Transit Authority (WMATA)
WMATA [9] serves the greater Washington DC area and is one of the largest transit agencies in the United States.
Speaker #2
Our second speaker will be Ryan Harshbarger, Director of Transportation for the Centre Area Transportation Authority (CATA). Ryan has been with the Authority for eight years, starting his career at CATA as a Transportation Data Analyst, before transitioning to his current role. Previously, he worked in inventory control for several private sector businesses with a focus on Lean/Six Sigma process improvement. Ryan has been heavily involved in the advancement of CATA’s Intelligent Transportation System, serving as the program lead on several projects to enhance both the components on the vehicles and deployment of new software for internal and external consumption.
Centre Area Transportation Authority (CATA)
CATA is a transportation organization which services portions of Centre County, Pennsylvania. One of the factors which differentiates CATA is the presence of Penn State University which lies within its service area.
Watch This
In order to get an overview of how a transit organization operates, watch this 55-minute video on CATA’s operations which was produced by the Pennsylvania Cable Network (PCN).
HUGH MOSE: I'm Hugh Mose, and I'm the general manager at the Centre Area Transportation Authority. We're the public transportation provider in State College, Bellefonte, and the surrounding areas of Centre County. In that area, we provide three different types of service. First is CATA Bus. That's what everybody knows, because those are the big orange and white buses that you see all over the Centre region.
The second part of our program is called CATA Ride. That's a dial-a-ride program for seniors and persons with disabilities. And then the third, newest, and fastest growing program that we offer we call CATA Commute, and that's car pools, van pools, and all kinds of services that are designed to meet the needs of long distance commuters. We're really pleased to have the opportunity to talk about CATA, and particularly some of the things that we're doing to promote the intelligent use of energy resources.
CATA has been around since 1974, but that's not really the beginning of public transportation in Centre County. Public transportation has existed here since way back into the '40s, and perhaps earlier. Although we've never had streetcars in this community, we had bus services that were designed to meet the needs of people who, at that time, did not have very ready access to the private automobile.
As was the case in so many communities around the nation-- and in fact, worldwide-- after World War II, things started happening that didn't work very well for public transportation, and one by one all of the private operators pretty much fell by the wayside. And the same thing happened here.
In State College, Fullington operated a bus service, but by the early 1970s, the service was losing money and the proprietor went to the borough and said, "We need to do something or I'm going to have to discontinue running bus service." State College wanted to have bus service. So, at that point, we were created as a publicly funded and publicly organized enterprise.
Initially we were just a borough authority. But after a few years, we were reconstituted to be a five member municipal authority, and over the years since then, we have grown to the point where we now serve nine of Centre County's 35 municipalities.
As a municipal authority, CATA is comprised of five member municipalities. Each of those municipalities gets to appoint one member, so we have a five member governing body. And that body represent the interests of the municipalities that we serve.
We have a long tradition of very strong involvement on our board of directors. Our board chair has been on our board for over 30 years. We have another board member 25 years. Another one, almost 20 years. We have just in my estimation the absolute best board of directors that a transit system could have, and I am completely committed to the notion that the success of an organization starts at the top. And the leadership that we have with our board and the support that we have from the municipalities who have created us have made all the difference.
This is CATA's nerve center. This is our dispatch center where we keep track of everything that's happening out on the street. There are really four different functions that occur here. We have a dispatcher, we have an operation supervisor. And they deal with bus drivers across the counter, they deal with employees as well as the public over the telephone. They deal with the drivers out on the street via two way radio. And most recently, we have gotten fully involved in technology to the point now that we have the ability to use GPS to see in real time how the system on the street is performing.
But this is a place that is staffed almost 24/7. Our first buses pull out at about 4:30 in the morning, and on the weekends the last buses don't come in until about 4:00 o'clock the following morning. So, this really is the place where it all happens. We have two dispatchers, and we have five operations supervisors. And between the seven of them, they make sure that there's a presence in this room at all times. And as much as we can, that we have somebody in a sedan, or an Explorer out on the street looking after things as they're happening.
And this is really critically important, because CATA is in many ways unique among small transit systems in Pennsylvania. This is a small community. But because of the nature of the State College community, we have many attributes of our transit system that are like you would find only in a big city.
We have buses that are absolutely crammed on a regular basis. We have buses that run on very close frequencies, as close as every five or six minutes. We have situations where the buses are running in a platoon, because there are so many people trying to ride that they won't fit on one, or two, or three, sometimes they won't even fit on four buses, all coming into the campus and the downtown area at the same time. So, keeping all of that squared away is critically important, and it is a big, big challenge.
Over the last half dozen years, CATA has gone from having virtually no GPS-based technology to having a very complete system. We now have the ability to track in real time the location of every bus that's out on the street. We even have the ability, through the automatic passenger counters, to have a very good approximation of how many people are on each bus at any point in time.
And it makes it very, very helpful for the folks who are working to dispatch the service on the street to be able to keep track of what's happening and take corrective action when we see that buses are falling behind schedule, or buses are getting overcrowded, or we have other idiosyncrasies that need to be dealt with. It's a very sophisticated approach, but it's one that has proven to be incredibly beneficial.
We started with the idea that this would be something to help us manage the service on the street, and that's absolutely true. But what has happened is we have also discovered that we're able to capture data that we never had before that is very useful in our service planning process to help us understand the ebbs and flows of passenger demand.
And the part of this that we completely did not realize was the value that this technology has for customer service. We now have the ability for our customers to be able to see in real time exactly where their bus is, or its expected arrival. And we do that through our online presence, we do it through a variety of smartphone apps and, just this year, we have started a system of text messages.
So, if you're going out to wait for your bus, you can automatically text CATA and get an immediate response of when your bus will be arriving. Not when it's supposed to arrive, but when it really will be there. And in my view-- and I've been in public transportation a long time-- the ability for the customer to know exactly where their bus is and when it's going to arrive is a complete game changer.
The provision of transit service is a pretty complicated process. I'm certain from the eyes of the particular bus rider it may seem pretty straightforward, but I'm here to tell you that we have a very complex situation in terms of the scheduling of our bus drivers. I'm joined here today by Chris and Jen, and they are the folks who are responsible every day for working through this incredibly complicated scheduling process.
If you think about it, bus drivers typically work an eight hour day. The buses go out on the street in some cases 4 o'clock in the morning, and they don't come back till midnight. Other buses go out at 6:30 in the morning, and they're back here by 9 o'clock. So, what we're constantly doing is putting together all of these pieces into eight hour shifts, and then assigning them-- and it's typically done by a bidding system based on seniority. And complicating things further, people are on vacation, people are off sick, people are on jury duty, people are on military leave. There are always holes in the schedule that need to be filled.
So, it's an incredibly complicated process, and I absolutely tip my hat to our operations supervisors and our dispatchers. Because the job falls to them, and it has to be done every day, 360 plus days a year.
CATA currently operates 66 buses in our active fleet. What we have here is a good example of a bus that was purchased new in 1997. We got into natural gas as a vehicle fuel starting in 1996, and we began buying buses and replacing our old equipment. So, we bought buses almost every year for about five years running. But by 2005, we had replaced all of our old diesel buses with new, clean burning natural gas buses.
So, what you have here is what I would refer to as a first generation bus. And our fleet is mainly comprised of this sort of vehicle. It's a low floor, 35 or 40 foot bus that is designed to transport anywhere between 40 and, under crush capacity, as many as 70 people.
The things that might make a bus like this unique are, of course, the natural gas power. But we also have these buses equipped for the transportation of bicycles. Just to give an example, this bus right here has a bicycle rack. It can be folded down, bicycles placed right on it, and they're carried out over the front bumper of the bus. And it looks like it might be complicated, but it really is very straightforward. And we've had a lot of success. In fact, we were the first transit system in Pennsylvania to have bike racks on all of our buses.
Moving down the line, this next bus is what I would refer to as the second generation. When we first started our natural gas program in '96, we had 16 new buses. By 2011, 2012, those buses were just about worn out. And we were fortunate that we were able to get some grant funding to enable us to purchase 28 of these second generation buses.
These are about as close to the state of the art as you can imagine. They're equipped with bike racks, technology. They have video cameras on board to give us the ability to review any incidents that happen on the interior, and even the exterior of the buses. And these buses also, obviously, have the bike racks. And in this case, it's a three-bike rack. One, two, three. Again we've had a lot of success with these. And so, as we bought these buses, we increased our bike carrying capacity by 50%.
Continuing on down the line, these are more buses that go back to the late 1990s. And as we continue, we will come to one smaller vehicle, which I think is important to talk about. Over here, we have what we refer to as a CATA Commute van pool.
CATA has gotten into the van pool program over the last seven or eight years. And this is a technique that is used to provide transportation alternatives for long distance commuters. We can do a great job in and around the State College Bellefonte area with our conventional bus service. But if you're commuting from Lewistown, or Lock Haven, or Hollidaysburg, or Altoona, or Tyrone, or any of the outlying communities, bus service is really not a viable option, at least in our way of thinking.
So, we have gradually evolved to our CATA Commute program, which includes car pool matching, van pools, and other services that are designed to help people find alternatives to solo driving. The van pools have just been incredibly popular. We started with six that we inherited from Penn State back in 2007, and now, we currently have 41 van pools on the road coming in from all over central Pennsylvania, to Penn State, and also to state correction institution at Rock View and Benner.
I think it is probably the most efficient way of providing alternatives to driving alone. Because in the case of a van pool, CATA provides the van, we insure the van, we maintain the van. We give the group that's in the van a Sheetz card so that they can gas it up. And then we calculate all the costs and add it all up, and then we charge the group what that dollar figure is. And as a result, we can cover essentially all of the out-of-pocket costs for the operation of the van. And the people who are in the van can probably commute for an entire month for the cost of what it would take if they were driving their own automobile.
This is CATA's bus maintenance facility. If you look around, you can see behind me several different buses that are in the process of being repaired. Activity goes on here practically around the clock. We operate three shifts almost seven days a week. And if our dispatch center is the heart of what CATA is all about, our maintenance area is the muscle.
Because with 68 buses, and the requirement to have as many as 58 on the street at any one time, it is a constant activity to keep all of the buses in a state of good repair. We have 28 buses that are only a year and a half old. The rest of the fleet is getting up there in age, going back to the earliest buses built in 1996, '97, '98, 2001, and so forth. And some of these buses have as many as 300,000 or more miles. So, consequently, the amount of maintenance activity is really pretty significant. But we have a fantastic maintenance crew.
I think we are a great organization through and through. But if there's one area that is particularly noteworthy, it is the crew that we have that maintains and services the buses. Because we do virtually everything in-house, from rebuilding engines to servicing every aspect of the bus. And the only things that we don't do ourselves are things that it financially makes more sense to farm out, even though we could do them with our own talent.
We have roughly 20 people that work in maintenance. And as I said, they are here around the clock. During the day time we're doing major repairs. In the evening when the buses come off the street, we're doing the daily servicing. We fuel the buses, we check the fluids, we empty the fare boxes. We do all of the things that are necessary to get the bus ready for the following day.
And then overnight, we do what I would refer to as running repairs. These are the little things that the bus drivers report that need to be done to make sure the bus is ready to go the following day. It could be something as simple as fixing a loose wheelchair securement device, or replacing a burned out light bulb. There are always things that need to be done.
But we get them done, or we make sure that we have enough buses to meet what the industry would call morning pull-out every day. And I've been here 18 years, and I cannot think of a time when we were not able to field the necessary number of buses to meet the requirements of our passengers. And that's about the highest compliment that I can provide to the crew of folks that are doing our maintenance for us.
We are now standing in CATA's parts room. If you look around, you'll be able to see that we are stacked almost floor to ceiling with various bins, and drawers, and stacked up parts. The reason for this incredible array of material is that CATA is currently operating a bus fleet of 66, a van pool fleet of almost 50, about 20 other assorted vehicles, in a garage that was designed for 40 buses.
So, we are just incredibly overwhelmed. We don't have enough space to store the parts, we really don't have enough space to store the buses. We have to keep some outside. And we certainly don't have enough space to do all of the ongoing repairs, which is one of the reasons that we work three shifts around the clock.
But just looking at some of the things that are-- I won't say scattered around, but stacked around. As you can see, we've got drawers, and we've got bins, but we don't have nearly enough space for all the material that needs to be in here. So, we've got it stacked on top of every compartment, and we have another couple of areas outside which were never intended to be parts storage, but have ended up being pressed into duty because we simply don't have enough space.
Most transit systems of our size would have a completely separate area for fare box repair. This is our fare box shop. I mean, what you can see is a cart with a couple of fare box assemblies. And this is where we try to diagnose and correct problems that we're having with our fare boxes.
We have other situations very similar to this. If we walk outside to our engine rebuild area, you will see an area that was designed for rebuilding of engines, and transmissions, and other components. And now, it's completely full of spare engines, and spare transmissions, and spare other assemblies, because we simply don't have any room.
Fortunately, we are on the verge of being able to construct a new maintenance facility that will be twice as large as we have now, and will solve the problems that currently surround me.
This is the centerpiece of CATA's natural gas fuel initiative. CATA was one of the pioneers in Pennsylvania in the use of natural gas as a vehicle fuel. Our initial evaluation went back to 1991. By 1993, we had made the decision to embrace natural gas as a vehicle fuel. And by 1996, this fueling facility behind me had been constructed, and our first 60 natural gas buses were on the road.
The way this system works is pretty straightforward. We have a very good supply of natural gas in the street. In the street, it's at 50 pounds per square inch. We have a line that comes off the main right up to this compressor building, and the compressors that you see here will take the gas and compress it from 50 PSA up to 4,000 pounds per square inch, which is really quite high pressure.
However, you need that extremely high pressure in order to be able to get enough gas into the tanks that are on the buses so that they can stay in service all year. Without getting into all the technical details, let it suffice to say that these are pretty sophisticated pieces of equipment, and we have a very strong crew of technicians who are able to maintain and operate them.
When I talk about our program, I always make sure I mention Ed. If you're going to be in something as sophisticated as this, particularly as a transit system that really doesn't know a lot about natural gas, you really have to have a product champion.
And in our case, we were so fortunate that we had a mechanic. His name is Ed Delbaggio. And when we first got into natural gas, he was working on second shift when the buses were fueled, and the compressors were in operation. And he took this under his wing, and he made it work for us. And I cannot say enough good things about our entire maintenance crew, but particularly Ed Delbaggio. Because in the early years when we were still learning how all of this worked, he's the person that kept us afloat when things didn't always work quite the way that we had anticipated.
The natural gas fueling system consists of three components. First there are the compressors where the gas is compressed to extremely high pressures, and then there are these storage bottles. And without getting into all the technical details, when you're fueling with a gaseous fuel as opposed to a liquid, you really need a mechanism to help you fuel efficiently. And these bottles enable us to do that by having a low bank, a mid bank, and a high bank. It simply enables us to get the gas out of the system and into the buses as efficiently as possible.
This is one of CATA's second generation buses that's pulling up to the fuel island to be fueled with natural gas. The fueling process itself is not terribly sophisticated. In fact, unless you look really carefully, it's kind of hard to tell that it's any different than if the bus was being fueled with diesel fuel.
But there is a critical difference. And that is, we are fueling with extremely high pressure natural gas. But as soon as our technician Ed gets here, we'll be able to see exactly how it works.
What Ed will do is simply insert the dispenser nozzle and make a positive high pressure connection, and then turn on the dispenser, and the gas will flow.
Natural gas is not typically purchased in gallon increments. But for the purposes of tracking our utilization, we meter it in gallons, even though, of course, as a gas you would never see it in a gallon jug or a gallon can. But that's the way that we track it for purposes of calculating the amount that we're using and the fuel efficiency that we're getting.
Natural gas is a very good fuel. It's not a perfect fuel. Natural gas is less energy dense than diesel, which means it doesn't have quite the power that a comparable diesel fuel would have. But in a transit bus application, that's not really very noticeable, because the buses themselves are not operating at high speeds or doing a lot of, in our community, hill climbing, or other high intensity use.
However, it is worth noting that we've had a terrifically good experience in the nearly 20 years that we've been using natural gas, in that we have seen that it is a very low polluting fuel, it's a very inexpensive fuel, it's a very good fuel in terms of our commitment to energy independence, and it's also a fuel that we have learned will be very sensitive to the environment.
CATA has the ability to rebuild practically any component that we have on the buses. But in doing so, we have a couple of very significant challenges. First of all, this is our rebuild shop. Unfortunately, it's not a shop at all. It's a space right off our main vehicle maintenance floor where we've crammed in all kinds of engines, and transmissions, and other subassemblies because we have nowhere else to put them.
The other issue we have is training our staff so that we can do all of this work ourselves. Diesel mechanics are hard to find anyway. But somebody who is qualified not only with diesel, but also with natural gas is an extreme rarity. So, not only do we have the constraint of our physical plant, but we have the constraint associated with training our staff to competency so that they can do all of the work that's necessary to repair and maintain our natural gas field equipment.
It's a big challenge for us. We're looking forward to a day when we can build a new maintenance facility that will have appropriate facilities for the rebuilding of engines, transmissions, and other components. But until that time, we're doing the best we can with what we have. But as I've said, it is an incredible challenge, and I give our maintenance staff incredibly big kudos for their ability to work within these constraints and keep the buses in a state of good repair.
CATA has never been a particularly well-funded transit organization. Over the years, we've always been stretched to try to meet the growing needs of a growing community. So, we do the very best job that we can to try to ensure that we use our limited resources wisely.
One of the ways that we have done that is with our tow truck. You know a transit system of our size probably only needs to tow a bus or other vehicle maybe once every month, once every two months. But when a bus needs to be towed, you really have to have a truck to do it. We could never justify spending a quarter million dollars or more on a brand new tow truck, but we were able to work a deal with our good friends at SEPTA in Philadelphia.
Of course, there with their enormous fleet, they're towing buses every day. And so, consequently, they wear out their tow trucks pretty quickly. This is the second time in the history of CATA that we have worked with SEPTA and purchased for a very small amount of money one of their surplus tow vehicles.
In this case, we got this for $1,000, and the guys on our maintenance staff went to work and took the basic chassis, outfitted it with a new compressor, put all kinds of additional equipment on the bed of the truck, and have made it into a very serviceable tow truck to meet the needs of our small fleet. It's just another way that we have been responsible economically to provide a high level of service at the lowest possible cost.
One of the things that makes CATA absolutely unique is that we have relationships with the owners and managers of 19 different student housing complexes around the community. It's a blessing and it's a curse. It's a blessing because by contracting with the apartment complexes, we, in essence, have made an arrangement where the individual rider's fare has already been prepaid, typically through their rent.
The curse part is that it creates incredible demands on CATA, because we end up having to serve a very large number of riders, typically who all want to travel at the same time. We find that typically college students, being college students, want to ride the last bus that will get them to campus in time for the start of the next class period.
The development that we're standing in now is called The Heights. It just popped up within the last six months. 639 beds fully occupied. You can imagine what this means at 8:30 on a Wednesday morning, when all of a sudden 150 students come streaming out to get on the bus to head to second period classes on the Penn State campus. It's a real challenge for us. This is a situation that, like I said, just appeared out of nowhere within the past year. And we have been called upon to service it.
So far, I think we're doing a pretty good job. It's not perfect, because there are times we just can't get everybody squeezed on the bus. But what we have here is replicated 18 more times around the community. It means we carry a lot of riders. Today with Penn State in session, we will carry at least 35,000 trips, and that's in a community of less than 100,000 people. That's really high transit intensity. But the price comes at the ability to squeeze everybody on, and that's a challenge.
CATA has been at the forefront in a number of areas. Our natural gas buses, our use of technology, the way we have deployed car pools and van pools to meet the needs of long distance commuters. Another way that we have been very much on the cutting edge is working with the development community, our local elected officials, planning commissions and so forth, to make sure that as new developments get designed and constructed, they're built in a way that public transportation can be successful in serving them.
And what we have right here is probably the best example that exists in our community. This is a development called The Colonnade. It was developed about 15 years ago, and at the time, we were successful thanks to the strong support of the township in working with the developer, and the future merchants to make sure that what we ended up with was a wonderful set of facilities to meet the needs of people who will be coming here on the bus.
So, what we ended up with is a roadway network which goes through the heart of the development and two sets of very nice bus shelters that are conveniently located to all of the stores that are in the Colonnade. And so, consequently, if you are coming here by bus-- and many people do, particularly students and others from the campus-- you're able to get to a central location. And this location also serves as kind of a transit center where multiple routes all converge.
So, what we've ended up with is a very nice physical facility centrally located, built in a way that is designed to support the access by large heavy vehicles in a way that allows transit to be an effective alternative to the private automobile.
We're now standing in front of another student housing complex called The Point. This complex has about 1,000 beds, and we have a contract with The Point so that we provide transportation for their residents, and they pay for it through their rent. As you can see by the group of people standing behind me, this is a pretty busy situation.
What we've got here is at least two dozen, maybe 30 riders all destined for the Penn State campus and downtown State College. It's now about 10 minutes before noon, and this is the kind of ridership we are experiencing. Imagine what it was like at 10 minutes before 9:00 this morning. If we have 30 people here now, we easily had 100, perhaps 150. And at that time, we have to run multiple buses. So, instead of just having one bus with the crush capacity of 70 or so, we would have two, three, four, maybe even five buses coming through this bus stop. And they will all be filled to capacity.
If you look down the street, you can see a second bus that is servicing the stop at the neighboring apartment complex. Again, this is a situation where one bus simply isn't sufficient. So, in order to get everybody on board, we're using two buses. The first bus apparently is full, and now, the overflow of the passengers will get on bus number two.
We replicate this all over State College. We have four different student housing corridors, all of which require multiple buses in order for us to serve the passenger demand. When we think about the value that we provided the community, probably the greatest single value is keeping all of the automobiles off the street that would be there if the buses weren't in operation.
Because the apartment complex that we're standing at now and all of the others along this corridor are apartment complexes where students typically have automobiles. And if they weren't riding the bus, they'd be driving. Because it's too far from where we're located here on [INAUDIBLE] Boulevard to the Penn State campus for anybody to really walk that distance. Bicycling maybe, but not walking. So, the choice is drive or ride the bus. And if we can put 5,000 people on the bus, that's probably 4,000 automobiles that are no longer clogging up North [INAUDIBLE] Street.
We're standing at the Pattee Transit Center, which is in the heart of the Penn State campus. This transit center was built about a half a dozen years ago in a partnership between CATA and Penn State. CATA was able to secure some federal funding to improve the bus stop, and Penn State was interested in an overall improvement to the surrounding campus aesthetics. As a result, we ended up with a very attractive bus shelter in a location that's central to just everything that's going on on campus.
One of the things that we were able to incorporate is real time transit information. Using the GPS capabilities that are on board the buses, we're able to calculate the expected arrival of each different bus. And as you can see, there are a great number of routes that come through this particular bus stop.
If a person is standing there waiting for the bus, they can look on this reader board and see when their bus is due to arrive. Of course, they can also look at the apps that we make available for smartphones, both Android and iPhones, or the text feature where you can text to CATA and get an immediate response that will tell when your bus is due to arrive at this particular stop.
As you can see, this is a very, very busy location. Right now it's a little bit after noon, and it's class change time at Penn State. As a result, we have very full buses in every direction. Whether it's a bus that is traveling back and forth across campus like this white loop bus across the street, or whether it's the bus that just departed here that's heading back out into the community, taking students and others back to their living quarters off campus.
We're standing between the Beaver Stadium and the Bryce Jordan Center. For many people, the parking lots to my left and my right are lots that are used for sports activities. But in addition to being used for sports events, they are also commuter parking for Penn State employees and Penn State students.
When people park out here by the Jordan Center and Beaver Stadium, they need transportation to get into the core campus. And over the years, CATA and Penn State Transportation Services have developed a very strong partnership. It goes back to 1999. And at that time, Penn State developed a new campus master plan. And one of the central points of that master plan was develop a pedestrian friendly core.
And the consultants recommended to Penn State that if they were going to be successful in having a pedestrian core, they needed to do whatever they could to encourage people to park their cars at the periphery, to get cars and parking out of the central part of campus.
And at that point, Penn State and CATA were able to negotiate an arrangement for fare-free campus service. Over the years, it's evolved into four different routes. It's the red link, the green link, the blue loop, and the white loop. And these four routes provide transportation from outlying parking into the center of campus. And every day during the school year, we will transport on those four routes in excess of 20,000 riders.
It's operated under a partnership. Penn State contributes, CATA contributes. And between the two of us, we're able to provide frequent fare-free service. And it makes it a viable alternative to everybody feeling like they have to park right within 100 yards of Old Main.
If you look to my left, you can see one of our route maps. And you can see that we have service that goes from the White Horse apartments on the extreme western end of campus, all the way across [INAUDIBLE] Road, which is the main east-west arterial. And from the Jordan Center and Beaver Stadium, service continues out to the Mount Nittany Medical Center and Penn State's Innovation Park.
At the same time, the loop routes-- blue loop and white loop-- connect this area with downtown State College. So, it is a very complete network of services that will enable anybody who is parking at this location to get virtually anywhere on campus, the hospital, Innovation Park, or even into downtown State College.
Now we're aboard a blue loop bus on the Penn State campus. This is one of four routes that circulates around the campus and provides free-fare transportation. And as you can see, it's a fairly busy bus. But we are squarely between Penn State class periods. So, what you're seeing here is really the extreme low end. If we had been on this bus 30 minutes earlier, you would not have been able to see from one end of the bus to the other because it would have been packed with standees from the yellow line in the front all the way to the rear bench seat in the back.
It's an incredibly valuable conveyance. And over the course of the day, in excess of 20,000 people will be transported around the Penn State campus.
At CATA, if our dispatch function is the heart and our maintenance function is the muscle, the real soul to the organization is our 150 plus employees. Joining me here on this bus is Ken Mortar. Ken is a bus driver, been with CATA for 14 years. And Ken is not only one of our more accomplished bus drivers, but he's also the president of our local of the American Federation of State, County, and Municipal Employees.
And that's something that's pretty significant. Because public transportation, almost without exception, is operated by represented employees. And I have managed transit systems in four different states around the country over a period of 37 years. And I've always believed that in our environment, labor and management are truly a partnership.
I know there are people who see labor as sometimes an adversary, and I have to admit there are times when we need to be on opposite sides of the table. But, in my view, we are all in this together. I can't do my job, we can't have really good transportation for the citizens of our community, without the great work of Ken and his colleagues.
And I think in the other direction, that Ken and the other 150 plus folks who work at CATA can't really have a good working environment if management isn't doing its job well. So, we're really into this together. And I really believe that. And I think as a result of Ken and the other people who have served in leadership capacities before Ken, and also with him today, we have enjoyed really good labor-management relationships.
It's not been perfect. But on balance, together we have been able to accomplish some really good things for the people who ride our buses, for the people who pay their taxes to support the services we provide, and for the people like Ken and myself, who are making a career in public transportation.
CATA has enjoyed an awful lot of success over the past 18 years that I have been here, and I've found myself in the very fortunate position of being able to stand on the shoulders of the folks who have gone before me. But when I think of the things that we have accomplished together, there are about four that really rise to the surface.
First of all, it's the service that we've been able to do with our various partners in the community. Whether it's the University, the apartment complexes, the development community, or whoever, those partnerships have been very, very successful.
The second area has been in the use of natural gas. We got in the program early. We were very fortunate that we jumped in with both feet, and we made it work for us. We stuck with it. And all of a sudden 15 years later, Marcellus Shale arrives on the scene, and it makes it look like we were absolutely clairvoyant. But it has been one of the very best programs that I've been affiliated with in my 37 year career.
A third area that I'm particularly proud of has been our ability to develop a set of programs for long distance commuters. We've always had a great program of service right in and around State College. But developing carpools, and van pools, and guaranteed ride home, and a whole set of services to help people who are commuting longer and longer distances. That has been, I think, a terrific thing that we have been able to do for all of central Pennsylvania. And specifically, people who are commuting into the greater State College area.
And lastly, I couldn't not mention technology. Because we have discovered that the deployment of technology on our buses has not only helped us be even more efficient than we would have been otherwise, but it has given us the ability to convey real time transit information to our riders and our prospective riders.
If those are the things that we have been able to accomplish over the last decade and a half, looking ahead, there will be many other things that we will be able to achieve. But fortunately or unfortunately, I'm not going to be here. Because in another 299 days, I'll be retiring. But I will be leaving CATA in really, really good hands when I hand the reins over to Louwana Oliva, our assistant general manager, who has been designated to be my successor come next June 30th.
LOUWANA OLIVA: Hi, I'm Louwana Oliva, and I'm the assistant general manager here at CATA. A little bit of what Hugh has been talking to you about has been our success in the last few years, and over his career. And typically what happens with success is also comes challenges.
As we move into the next era for CATA, we'll be looking at a number of challenges. One of the first things that is in process right now is actually putting together a strategic plan to look at where have we had success, where do we go from here, how do we manage the growth?
A good example of that is Hugh talked a little bit about our CATA Commute program, which is a van pool program. That program has doubled in size in just the last five years. So, even though that's a success, there's a challenge that goes along with how do you manage that kind of a growth? We've also been seeing growth in our line service as far as we've talked a little bit about the apartment complexes, and the growth in ridership that we're experiencing. So, the strategic plan is part of what we're looking for to sort of lay our path for the future.
Two of the other areas that are challenges that we need to look to the future for. They're a challenge, but they're also exciting because they're growth. The first one would be is that we've talked a little bit about the fact that we've outgrown our facility here. In fact, this facility was actually built for 40 buses. And with our contingency fleet, we're actually at 72 buses right now. So, we're bursting at the seams.
So, we've been in the process of designing a new building that allows for growth as far as storing our fleet, working on our fleet, maintaining our fleet. Some of the things that we're looking at the future, too, is to be able to add articulated buses to our fleet to help with some of the student corridors, where sometimes we're sending three and four buses in order to keep up with demand.
So, as we go forward with the design of the building, the other challenge that will go with that is while we have a commitment for funding, it's how does that funding come in and allow us to build that building as we go through design?
The other challenge that we will be looking at is our fleet. Just a couple of years ago when I came here to CATA, our average fleet age was 13. Which means that we had buses that went anywhere from, I think our youngest buses were a little less than 10 years old, to buses that are now pushing up against 20 years old.
So, the average life of a bus is expected to be 12 years. So, what we'd like to do is to get that average fleet age down to where we're not keeping buses quite so long. With an influx of some new buses recently, we've gotten it down to about 9. But still our fleet's way too old for the kind of service that we're putting out there. So, you want reliable buses that don't cost a lot to maintain.
So one of our big areas of concern that we're looking at is how to not only grow our fleet, because our ridership is growing and we need more buses, but then how do we also, on a regular basis, replace that fleet so that we aren't spending a lot of money to maintain older buses, or spending money to put new equipment on buses that really should be at retirement age?
HUGH MOSE: This has been a great opportunity for CATA and for me to share with our viewing audience a little bit about the Centre Area Transportation Authority and the services that we provide here in Centre County, Pennsylvania. As I said at the very beginning, there are really three things that we do.
We have our CATA bus service, which is what everybody knows us for. Those are the big orange and white buses that are just pervasive around State College. But we also have CATA Ride, which is our service for seniors and persons with mobility or cognitive impairments. And then third is our CATA Commute program of carpools and van pools.
We are really, really proud of the services we provide. We believe that we provide great value for the taxpayers that help fund us. We believe we provide great service to the people who ride our buses and vans, and we believe we provide a very good place of employment for the folks who are making their careers in public transportation here at CATA.
So again, thank you very much for the opportunity to share a little bit about CATA, and it's been great being with you.
Passenger Information Systems
One of the huge benefits spatial technology has brought to the transit industry is in the area of passenger information systems. Watch this 4-minute instructional video on using the real-time bus information which CATA makes available.
To provide you with the route and schedule information you need to use the CATA bus system, CATA makes this information available in several convenient ways beyond the static information provided in the ride guide and on the CATA bus website. Please view CATA's CATA route and schedule info, the ride guide, and CATA website for instructions on how to read CATA's static route and schedule information located in the ride guide and on the CATA website. CATA's real-time website and its new My Stop mobile apps for iPhone and Android devices provide yet another source of information - this being up-to-the minute schedules for all CATA bus routes. They also provide a trip planner and a way to view and sign up for email and text rider alerts from CATA based on the route you ride.
To download the My Stop mobile apps, search for this My Stop logo in the iTunes or Google Play Store. Once downloaded and opened, click on the CATA logo.
Let's say we want the N Route to go to the Northland Center on North Atherton Street. And we want to board the bus on Bigler Road heading outbound, or away, from downtown State College. When we click on the N Route, we can see where the bus is in real time. When you click on your stop, a box will open showing you when the bus is estimated to be arriving at your stop and whether it is currently on time or running a little behind schedule. Here, we can see the bus is on time and scheduled to arrive at the Northland Center at a scheduled time of 11:34 a.m.
Planning your trip with CATA's new trip planner is fast and easy. Simply click on trip planner, input your origin and destination, and your preferences, and hit submit. Options for your trip, as well as walking directions will be provided. Riders can register with My Stop and sign up to receive recurring alerts via email or text as they relate to real-time bus arrivals, rider alerts for a specific route or all routes, and more. The same alerts, although only for one-time, non-recurring, can be set up via the My Stop mobile apps as well. And finally, have instant access to CATA's rider alerts as they become available, by clicking on public service messages.
Additional options also exist for accessing real-time information. If you're standing at a bus stop featuring real-time information boards like this one at the library you can see the estimated arrival time for all buses arriving at that stop, and if you're standing in a specific stop, you can access next bus arrival times by texting cb (stop number) to 321-123 or by scanning the QR code at the stop. Should you ever have questions or like guidance on using CATA's real-time bus tracking tools and mobile apps, CATA's bus drivers and friendly office staff are always happy to help you.
9.6 Summary of Lesson 9
In this lesson, you learned about DRT services including some of the challenges inherent to DRT and the technologies agencies commonly employ to help them manage and deliver these services. You also learned how DRT software can help transit providers schedule trip requests by completing an exercise on Network Analyst’s vehicle routing solver. You also learned about fixed route transportation and GTFS, the standard format used by transit agencies to publish their schedule data.
This week, you explored the FTA, an administration within the USDOT.
In our weekly webinar, you had the chance to interact with Mr. Rodney Bunner and learn about TBEST, a powerful Transit Planning Tool.
In preparation for next week’s webinar, you learned about Title VI of the Civil Rights Act of 1964 and how it impacts fixed route providers in particular. You also had a chance to explore TBEST, a tool you’ll have a chance to work with in next week’s lesson.
Finally, you had the opportunity to get to know one of your classmates a little better and share some of your ideas and questions about this week’s lesson materials.
Questions and Comments
If there is anything in the Lesson 9 materials about which you would like to ask a question or provide a comment, submit a posting to the Lesson 9 Questions and Comments discussion. Also, review others’ postings to this discussion and respond if you have something to offer or if you are able to help.