Understanding the Geography of Vulnerability
Developing a clear picture of an area's vulnerability to hazards and disasters is a non-trivial task. It's hard to predict exactly what could happen in a disaster situation. However, even a rough estimate can be a huge help to emergency managers and decision makers who can use that information to develop plans for allocating resources and managing recovery operations. By collecting socio-economic and environmental data sources in a GIS, for instance, we can develop risk maps to highlight the potential impact of disasters on people and infrastructure. In this lesson, we will examine some of the specific analytical methods for doing a vulnerability assessment, and we will reflect on the critical issues associated with planning an emergency management GIS system that includes vulnerability assessment as one of its key functions. Most systems for geospatial and emergency management are designed for reaction, not prediction and mitigation, but that’s changing fast.
There is a wide range of relevant questions to consider when conducting a vulnerability assessment, including answers to the following key questions:
- Who is at risk? How many will be affected?
- What is the spatial and temporal extent of the vulnerability?
- What capacity does the population at risk have for coping with the disaster?
- What is the range of scenarios given different conditions (for example, a Category 2 hurricane vs. a Category 5 hurricane)?
- What happens when multiple disasters occur at the same time (for example, heatwaves during major wild fires; hurricanes during pandemic shutdown)?
- Across all of these is the ‘where’ question, and what roles do spatial relationships play?
Here are a couple of examples of web-based services providing geospatial data on hazards and vulnerability; there are many others!
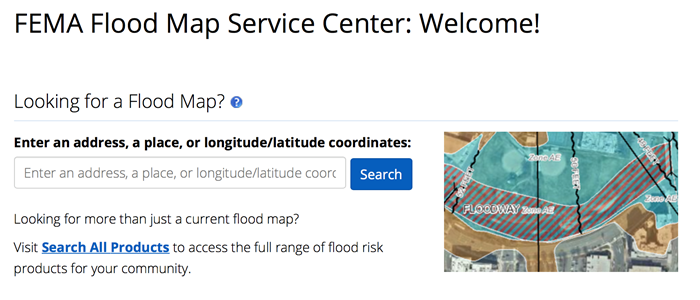
The first example is a map service developed and maintained by the U.S. Federal Emergency Management Agency (FEMA) that coordinates and conducts a great deal of vulnerability assessment work, including flood mapping. FEMA flood maps are used to help set flood insurance rates, among other things. The flood mapping tool shows an overview of ongoing FEMA flood mapping, levee repair, and other flood-related risk assessment and mitigation tasks. Contrast this with recent research reported in this interactive New York Times page - New Data Reveals Hidden Flood Risk Across America. Note: you shoudl be able to view the interactive maps without a subscription, but if you are having trouble, you can view a copy of the article on the following page in Canvas.
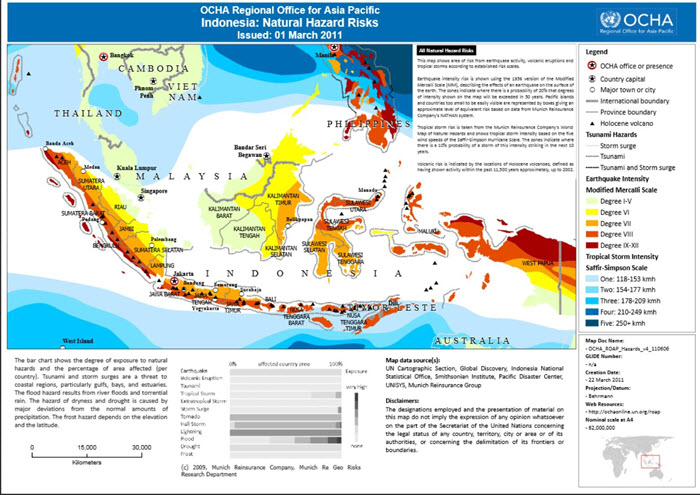
Indonesia: Natural Hazards Risks
The United Nations engages with other entities to develop risk maps for developing countries where they are likely to be involved in future disaster situations. If you check out the map above in greater detail, notice who the collaborators are. They include several NGOs, as well as Munich Re, a major re-insurance player. Interesting, huh?
Keep this Indonesia map in mind, because later in the course you will be considering the 2018 Sulawesi Earthquake and Tsunami in greater detail.
Some private sector firms provide what is known as Address Risk Rating products - in essence, you can look up a specific address and get a report outlining all of the vulnerabilities associated with that location. One of our PSU faculty, Dr. James O'Brien, works for Risk Frontiers in Australia, a firm that works on Address Risk Rating products among others. Here is another example, UNHaRMED model, from the University of Adelaide and the Australian Bushfire and Natural Hazard Cooperative Research Centre.
These examples don't explicitly consider people and the wide range of factors that make some people and places vulnerable while others are not. You will see it is not just a matter of whether you are inside or outside of an impacted area. Geographers have done a lot of work on social vulnerability analysis as part of a rich tradition of Hazards Research.