As we have seen, the boundary between response and recovery is a fuzzy one as is that between recovery and mitigation. As we have talked about earlier, it is useful to think of the stages of emergency/crisis management as a circle with each stage blending into the next. The roles of geospatial approaches and technologies can be conceptualized as occupying (often overlapping) positions along this circle.
This overlap in functions was never more apparent than with the 2012 Sandy Hurricane disaster hitting the eastern seaboard. In the midst of efforts to rescue people stranded by floodwaters, politicians and others began discussing how or whether to rebuild--opening what will probably be a long dialogue about the potential to rebuild in a way that is more resistant to similar events in the future and comparing the economic and other costs of this option with suggestions to not rebuild at all or to relocate parts of the city. Similarly, while repairs and rescue efforts continued, work began in some parts of the city to start on recovery – with spatial tasks ranging from figuring out where displaced individuals were, to assessing damage in regions of the city to determine whose insurance claims of disaster relief requests to process first, to re-establishing utilities, fixing roads, and other efforts to establish the infrastructure required to carry out whatever recovery efforts were decided upon.
Background on What Happened During Hurricane Sandy: Optional, but recommended!
This video, Inside the Megastorm (54:38 minutes), produced by PBS NOVA does a nice job of describing the storm and why it was so damaging. It also helps illustrate the many ways that spatial data analysis was used to aid in the response and immediate recovery. Note how different groups used geospatial data and analysis e.g, first responders, search and rescue, utilities, transportation. I know this is a long video, but it is worth a look, especially if you are not very familiar with what happened.
To get a sense for just how complex and challenging recovery can be, have a look at this report from the Guardian, Hurricane Sandy, five years later: 'No one was ready for what happened after' and contrast it with some of the materials on the FEMA site, Sandy Five Years Later. Do you notice a difference in tone and emphasis of these two sources? Unfortunately, there are pretty much always winners and losers during recovery efforts.
Critical Perspectives on Recovery
Finally, here are two critical perspectives on recovery I’d like you to pay close attention to. This essay, A Tale of Two Recoveries: 5 Lessons from Hurricanes Katrina and Sandy, is written by geographers Susan Cutter and Christophe Emrich of the Hazards and Vulnerability Research Institute at the University of South Carolina. Susan Cutter is an influential scholar working in this space, and you are likely to come across her research center’s work (in fact, consider having a quick search in Google Scholar and/or visit the HVRI website). The second article, As Storms Keep Coming - FEMA Spends Billions in ‘Cycle’ of Damage and Repair, also focuses on some important and difficult issues around recovery, in particular, the back-and-forth between disasters and recovery effort. This echoes some of the messages in the Cutter article, and I’d like you to think about how the 5 Lessons relate to this analysis of FEMA spending. Although the article focuses on FEMA, the story is much the same for other countries trying to manage the complexity of recovery efforts, and we will see this later in the Sulawesi earthquake and tsunami case study.
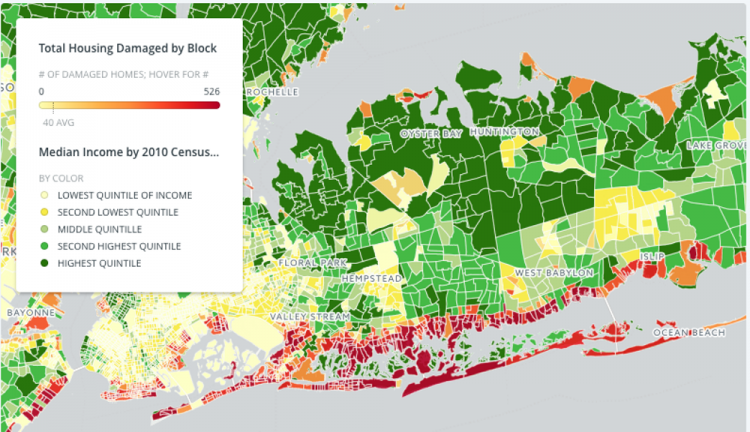
As we've seen, disasters have a highly variable impact spatially and temporally. There are also strong spatial differences in social, economic, and environmental characteristics that shape both impact and recovery. The map below illustrates this issue by mapping housing damage against median income for part of Long Island in the wake of Hurricane Sandy. This is probably not too surprising given what you learned in Lesson 3 about hazards and social vulnerability. You can really see this play out during a big event like Sandy. This map comes from a piece in The Conversation, Storms hit poorer people harder, from Superstorm Sandy to Hurricane Maria, by Professor Chris Sellers at Stony Brook University.
For Further Consideration: Optional
The optional Business of Disaster video (54:47) continues to explore many of the themes around the complexities of disaster recovery. The video was produced by PBS FRONTLINE and NPR in 2017 and focuses specifically on the (ongoing) recovery from Hurricane Sandy.
Click here for a transcript of the Business of Disaster video as posted on the PBS/Frontline website.