Informal Use of Social Media During Crisis
We have already talked a lot about volunteered geographic information (VGI) and other types of citizen involvement in emergency management, but here we will consider how social media data, like Twitter, Instagram, and Facebook, are being used informally and more formally through big (spatial) data analytics. These are potentially rich data sources but are still a bit difficult to use and have some specific problems around getting accurate and meaningful location information.
To get this section started, have a look at this NBC Nightly News Story (2:01 minutes) about how search-and-rescue used social media to help locate people needing rescue.
LESTER HOLT: By air and by boat, the rescuers continue to come. Harris County Constable, Alan Rosen, and his deputies are among many answering the urgent pleas of those waiting for aid. We joined them today as his fleet of high water rescue trucks rolled out looking for those in need. And while the size of the trucks are impressive, they can only go so far.
ALAN ROSEN: We did have one get stuck yesterday with some very high water, seven feet. We had to deploy boats.
LESTER HOLT: Rosen is relying on an unlikely source to direct his teams where to go. This is one of the biggest natural disasters of the social media age. How has that affected how you are dispatched?
ALAN ROSEN: Social media has helped us message, find out where people needed to be rescued. People were on their roofs. It helped us deploy assets.
LESTER HOLT: #SOSHarvey has been trending on Twitter since the flooding began-- users tweeting out addresses where people needed to be evacuated. "2 adults 2 children water at waist level 9015 Sandpiper #HarveySOS". Facebook has a safety check where users can alert family members to their whereabouts. Those still in need of help are urged to post their addresses and phone numbers and sit tight. Help will come.
SURVIVOR: We're going to be OK, I think.
ALAN ROSEN: We're still in a search and rescue mode. And we're going to continue to focus on saving lives until the water recedes and everybody is safe to go home and clean up their lives.
LESTER HOLT: And, as you saw, the constable working right alongside with the National Guard and their high water vehicles on that rescue. Just some of the heroism we're seeing here in Texas as a terrible situation brings out an incredible showing of humanity.
Hey NBC News fans, thanks for checking out our YouTube channel. Subscribe by clicking on that button down here. And click on any of the videos over here to watch the latest interviews, show highlights, and digital exclusives. Thanks for watching.
Mapping Social Media in Crises
In the recent past, there have been significant advances in automated tools for extracting place information from news articles and other text media. This led to a wave of map mashups that allowed for news stories to be browsed using a map. Since those earlier efforts, social media data sources have become ubiquitous, and while similar methods can be used to extract and represent places mentioned in social media reports like Tweets, there are also a lot of challenges we have yet to overcome to make these datasets truly useful in a crisis situation. Moreover, as we saw in Lesson 5, the rise of real-time geospatial systems means we need to be able to locate and understand the content of social media in near real-time, and this is still challenging!
The use of social media in disaster response really took off in the mid-2000s with the efforts of digital humanitarians like Patrick Meier, the author of your textbooks (also see Chapter 3 – Crowd Computing Social Media in Digital Humanitarians for more). In the following short video (1:31 minutes), Patrick explains how this works, particularly how we can teach machines to understand and classify tweets into actionable information.
Patrick Meier: How can social media help in disaster response
PATRICK MEIER: I work in a number of different networks and projects in social media and disaster response. One of them is a Digital Humanitarian Network, which is a global network of technology savvy, digital volunteers who basically make sense of the big data that gets generated during disasters on behalf of established, traditional humanitarian organizations because these organizations have no idea how to make sense of this big data. It's a very new world for them.
Typically, well, like the Nepal earthquake-- happening within a few hours of the Nepal earthquake, the Digital Humanitarian Network was activated by the United Nations to carry out a number of different missions. One of them was to look through social media and find urgent messages. So what we did is we used a new platform called micro macros, which crowdsources the filtering of social media information to quickly find those messages that have to do with urgent calls for help.
So what you do is you give the algorithm a lot of examples of what urgent tweets looks like. And the algorithm starts to learn what the similarities are. So if you say, OK, these 100 tweets here are all about urgent needs and you send it to the algorithm, what the algorithm does is it looks at the similarities between all these 100 tweets. And it says, OK, now I understand why all these tweets are similar. I'm going to find more tweets like these 100 tweets. So it's that simple.
A few of the challenges associated with mapping information from social media are:
- disambiguating where a tweet is reported from versus what places it talks about;
- figuring out which locations to use when the place names found could refer to multiple places (Indiana, PA vs. Indiana the state);
- symbolizing massive collections of social media reports on a map (simple overlay just causes a lot of clutter - so what else can we do?).
Here at Penn State, we've been engaged in research to develop new tools for foraging through and visualizing geographic information coming from social media reports.
The SensePlace2 project harvests tweets that include disaster-related keywords. From these tweets, we then extract place names and geocode them (along with other named entities, such as people, organizations, and resources). Please have a look at the following 3 minute video, SensePlace2: Visual Analytics and Big Data for Spatiotemporal Sensemaking.
SensePlace2: Visual Analytics and Big Data for Spatiotemporal Sensemaking
[MUSIC PLAYING]
JOSHUA STEVENS: By the time I finish this sentence, more than 500 million users on Twitter will have sent over 37,000 tweets. By the end of the day, these users will send more than 400 million tweets. There is clearly a lot of conversation happening on social media. But what can it actually tell us?
Hi, I'm Joshua Stevens, a 2nd-year PhD candidate in Geography at Penn State's GeoVISTA Center. As part of the IGERT in Big Data Social Science, I'm working on a project that attempts to make sense out of this torrent of tweets.
Humans are very social, and we are now more connected to each other and various sources of information than ever before. We enjoy talking about the events happening around us, sharing our successes, lamenting our failures, and distributing information in times of crisis. The Internet and social media allow us to do this on a global scale. This means that where people are talking about is just as important as what people are talking about.
Now, you may be thinking, doesn't Twitter already record my location and include it with my tweets? It certainly can. But less than 1% of all tweets include geolocation data. So the more difficult question and the concept we're interested in is, how do we determine the geographic context of the other 99% of tweets? And more importantly, how can we determine the locations people are talking about, not just the locations they're tweeting from?
To do this, we've created a tool called SensePlace2. SensePlace2 works by analyzing tweets to identify topics and locations mentioned in the text. We use sophisticated entity extraction and geolocation algorithms to map the places mentioned in each tweet, pairing mentioned locations with both a tweet and a timestamp. When this is done for hundreds of millions of tweets, there's simply too much information to take in all at once. This is where advanced cartography and interactive features, the key elements of geovisual analytics, come into play.
Let's take a look at SensePlace2 in action to see how this works. We'll run a search using the term "protests." You might reason that some places will mention protests more than others. But where are mentions of protests more common? And which locations tend to get mentioned with protests at the same time? SensePlace2 can help us explore these questions.
The Map View shows all the locations that are mentioned in tweets containing our search term. A Place-tree view and word cloud show the most frequent place mentions in our search results. The dark red areas and the timeline reveal that tweets mentioning protests were more frequent earlier in the year. We'll constrain our search to this time period by adjusting the Temporal Controls. Notice that the top locations are different now.
With SensePlace2, users can explore the geographic landscape of tweets in an intuitive, interactive way. By enabling analysts to understand the what, when, and where of social media, our research demonstrates how geovisual analytics can support spatial understanding and the interpretation of enormous and complex data sets. This enriches our ability to ask important questions about the topics that affect people and places and how these relationships change over time. On behalf of the SensePlace2 Team, thank you for viewing our video.
If you want to learn more, check out this 2017 journal article on the project: SensePlace3: a geovisual framework to analyze place–time–attribute information in social media, Cartography and Geographic Information Science
Because so many social media sources now feature API access to their data feeds, new map mashups are now possible that can integrate multiple forms of social media with other geospatial data. Keep in mind that the quality of these vary considerably. For example, some tools just use the location feature that some (very few, it turns out) enable on their devices when they use Twitter.
OPTIONAL
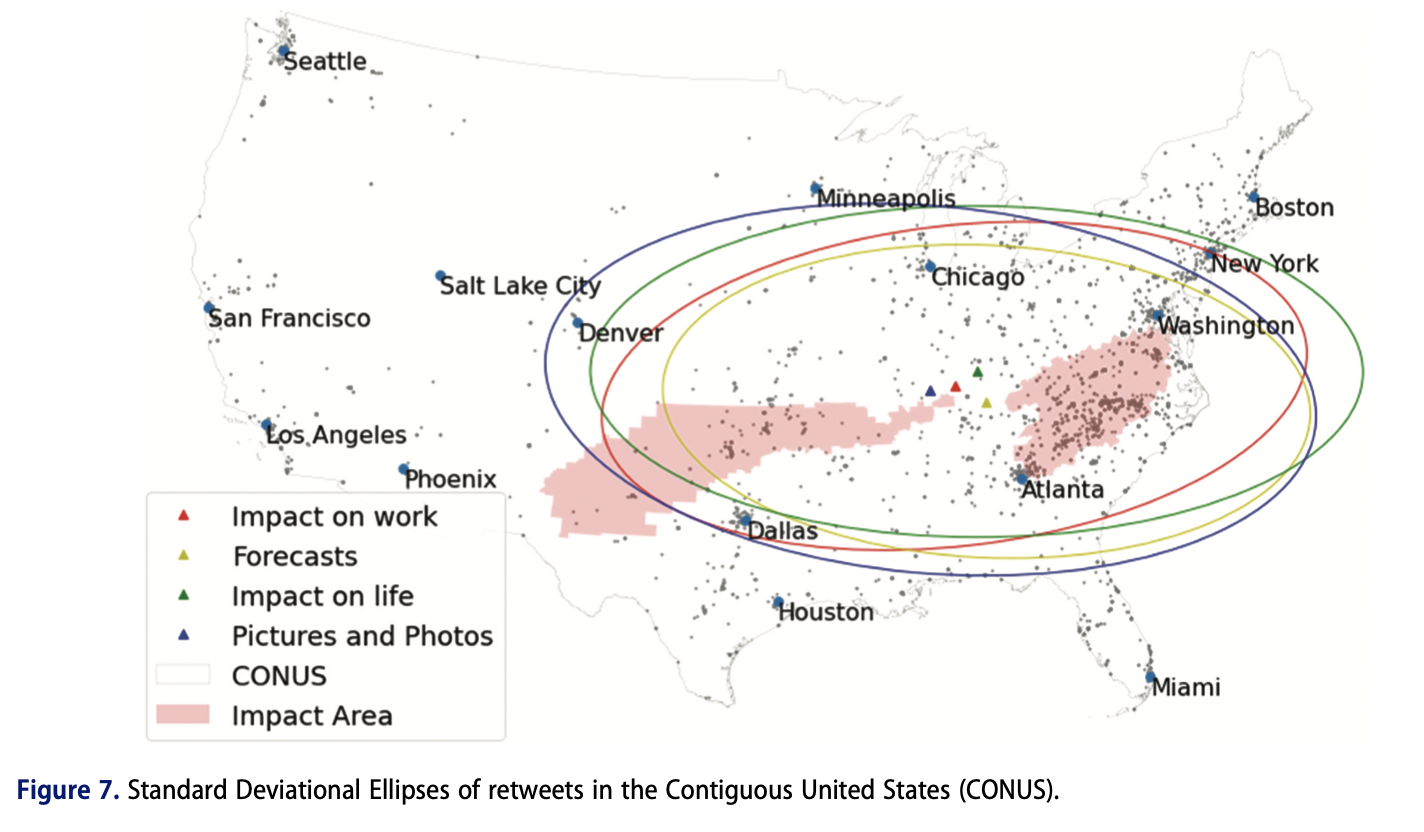
You may be interested in this study that was published just this year (2022!) on using tweets and retweets to understand information diffusion during disasters. This is just FYI, but it is worth a skim now.
Jinwen Xu & Yi Qiang (2022) Analysing Information Diffusion in Natural Hazards using Retweets - a Case Study of 2018 Winter Storm Diego, Annals of GIS, 28:2, 213-227, DOI: 10.1080/19475683.2021.1954086
Deliverable
- Post a comment in the Emerging Theme Discussion (L7) forum that describes how you imagine integrating social media mapping into a successful geospatial system for emergency management. How would you deal with the various aspects of uncertainty that these data sources entail? What emergency management phase do you think social media data is most useful for?
- In addition, provide a link and short description to a social media application to emergency management or public safety ‘in the news’ or that you have otherwise come across.
- The initial post should be completed during the first 5 days of the lesson.
- Then, I'd like you to offer additional insights, critiques, a counter-example, or something else constructive in response to your colleagues on two of the following 5 days.
- Brownie points for linking to other technology demos, pictures, blog posts, etc., that you've found to enrich your posts.
NOTE: Respond to this assignment in the Emerging Theme Discussion (L7) forum by the date indicated on the course calendar.
Grading Criteria
This discussion will be graded out of 15 points.
Please see the Discussion Expectations and Grading page under the Orientation and Course Resources module for details.