Introduction
In 2017, Hurricane Irma had devastating impacts on much of the Caribbean, especially the island nation of Antigua and Barbuda. In fact, nearly all of the buildings on the island of Barbuda were destroyed, and almost the entire population was evacuated to Antigua before or immediately after the storm.
For more context, have a quick look at this reporting from the Guardian, The night Barbuda died: how Hurricane Irma created a Caribbean ghost town. If you have trouble with this link, go to the next page in Canvas.
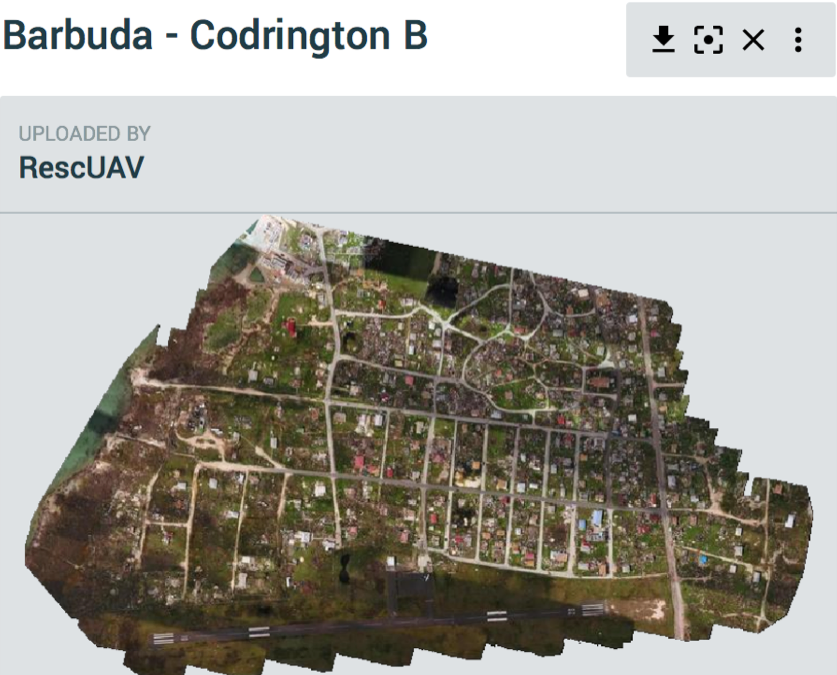
In this section, you will compare UAV imagery collected soon after the hurricane hit with ‘baseline’ satellite imagery taken before the storm. I want you to contrast the type of information you can get from high-resolution satellite imagery with that from an insanely high-resolution UAV mission. Approach this from the point of view of an emergency manager coordinating search, rescue, and recovery efforts in the immediate aftermath of the event. Also, consider the damage evident in the imagery in support of overall damage assessment and teams entering the field.
The data you will be working with came from a Canada-based group called UAViators and it is distributed on OpenAerialMap. If you are interested in this type of data (for your term project?), the OpenAerialMap website might be a good place to start looking.
Steps to follow:
- Begin by accessing the data and associated metadata in the OneDrive folder I shared with you via the the emailed link. Let me know right away if you haven't already downloaded the data.
- Look at the ArcGIS Pro Project that I have created to help support your analysis. There are many different layers in this project, so have a quick look to see what’s there as you consider the specific context in Barbuda. Note the analysis focuses on the main settlement, Codrington. The data have been sourced from:
- Humanitarian Data Exchange
- OpenStreetMap Barbuda
- Global Health Data Exchange – Census Data
- The Caribbean Development Portal – Antigua and Barbuda
- Think about how these easy to obtain datasets can rapidly paint a picture of conditions on the ground and the likely impacts on people and infrastructure. Is there anything major missing data-wise, and do you think you could easily find what you need in a hurry?
- Next, load the satellite and drone imagery.
- The pre-event satellite imagery from Maxxar’s Open Data Program is another source of freely available data for disaster events. You might want to make note of this site when considering your term project.
- As mentioned above, the post-event UAV aerial imagery comes from UAViators via OpenAerialMap.
- Have a look at the properties of these two images and note their spatial resolutions, keeping in mind how these may influence the information that can be derived from the image.
Part 2 Deliverable
Write a short assessment of the situation on the ground, keeping in mind your role as a geospatial analyst supporting operations and field teams.
- Conduct a simple visual damage assessment, e.g., what is the extent of the damage?
- Has critical infrastructure (such as ports, roads, key buildings) been destroyed or blocked by debris?
- Develop some broad search-and-rescue advice, e.g., what could you tell teams about conditions on the ground?
- What quick mapping products can you envisage creating from these data that could be distributed to the teams?
Submit, along with Part 1, to the GIS and UAV Data Exercise Dropbox.