Lesson 1: Spatial Data Science for Emergency Management
Overview and Checklist
Overview
In my opinion, there is an interesting paradox with geospatial analysis and crisis management - we continually develop new and improved methods for handling disaster situations, but our increasingly complicated societies, economies, and infrastructures increase the challenges associated with disasters. People and their environments are more interconnected than ever, and spatial data science and related technologies are in many cases the most appropriate mechanism for analyzing and rectifying emergency situations.
There are four key phases of emergency management: vulnerability assessment, preparedness, response, and recovery. In subsequent lessons, we will explore each of those topics in detail. Later, we will work together to research and apply methods from spatial data science to emergency management contexts, and we will explore how geospatial perspectives and technologies have been used in a variety of ways in recent disasters.
Each week, you will learn about an emerging technology trend and how it relates to geospatial analysis and crisis management. One of my goals is to make sure you learn about and consider new trends and themes in technology, and imagine how those advances can and will impact Spatial Data Science for Emergency Management in the future. The geospatial planning activities you participate in now should take into account new types of technologies that will be commonplace in the next 5-10 years.
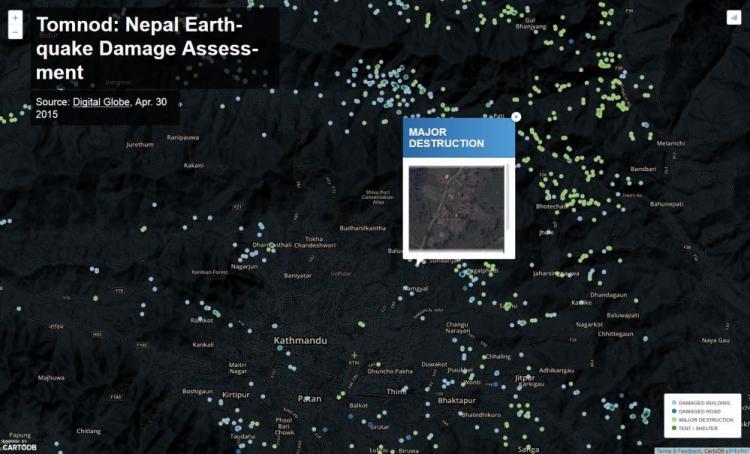
Example - Changing approaches to rapid damage assessment after a disaster
Crowdsourcing approaches for damage assessment have been popular, with micro-tasking platforms like Tomnod used to leverage digital volunteers, as shown here for the 2015 Nepal Earthquake. Volunteers look at images of structures and rate the level of damage.
What You Will Learn
By the successful completion of this lesson, you should be able to:
- articulate the role of spatial data science, including geospatial perspectives and technologies, in emergency management;
- evaluate and discuss how recent technology trends in geospatial interaction relate to emergency management;
- understand the final project assignment for this class and brainstorm some ideas;
- discuss the role of spatial data science in emergency management with your classmates.
What You Will Do
Lesson 1 is one week in length. To finish this lesson, you must complete the activities listed below.
| To Read |
|
|---|---|
| To Do |
|
Please refer to the Course Calendar for specific due dates.
Questions?
If you have questions about the content or lesson activities, please post them to the General Questions and Discussion forum in Canvas. While you are there, feel free to post your own responses if you, too, are able to help a classmate. If your question is of a personal nature, please email me directly through Canvas.
Rethinking Emergency Management
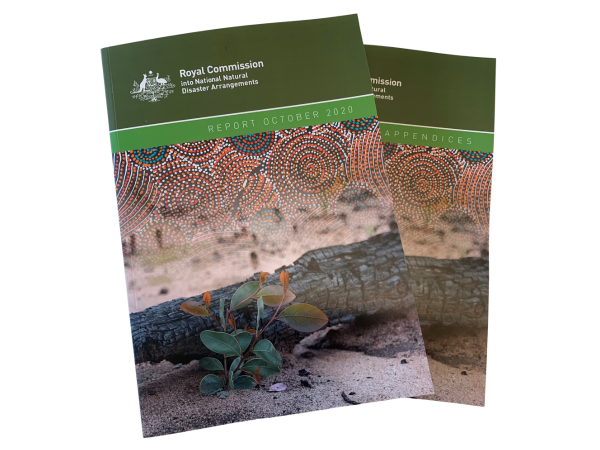
Before going any further, I'd like you to consider the devastating 2019-20 Black Summer Bushfires in Australia. I focus on event because it has prompted a major National Review of disaster and emergency management arrangements. The Royal Commission into Natural Disaster Arrangements [3] released their final report at the end of last year. Royal Commissions are basically a big investigation that relies on submissions from all kinds of stakeholders, from academics, to frontline workers, to citizens. This process results in a series of recommendations that the government considers. While the bushfires prompted this review, the recommendations take a multi-hazard approach. So, how can you manage fires, smoke, heatwaves, floods, cyclones in a more coordinated way.
I'd like you to look at a few sections of this report and also keep it on hand as we go through the course. It has a lot of information relevant to the topics we cover, albeit we are exploring geospatial dimensions in greater depth. First, have a look at some photos and videos from the Bushfire History Project (below) to get a feel for what happened last year.
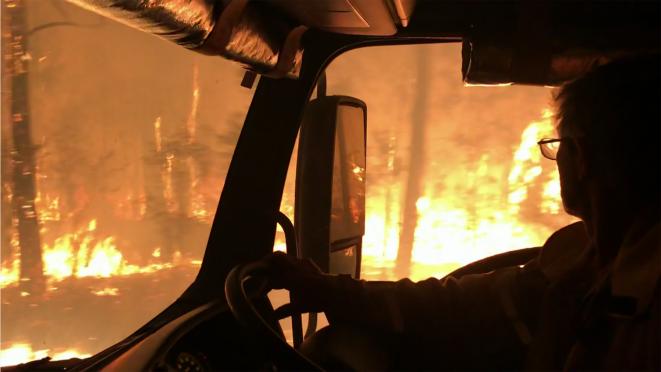
2019-20 Bushfire History Project - Fires (3:51 minutes)
No Audio - images only
2019-20 Bushfire History Project - Damage (2:54 minutes)
No Audio - images only
2019-20 Bushfire History Project - Recovery (2:06 minutes)
No Audio - images only
Now, look at the download the report from this direct link or go to the Commission's website [4].
Royal Commission into National Natural Disaster Arrangements Report [5]
Royal Commission into National Natural Disaster Arrangements Appendices [6]
Please read the following sections (don't worry if these seem a bit technical given you just started the course):
- Forward - page 5-7
- The 2019-20 disaster season - page 19
- Disasters have changed & We need to act on multiple fronts - page 22
- A national picture needs national data - page 28-29
- The impact of natural disasters on essential services (Figure 35) - page 227-229
- Mental health and natural disasters - page 345-348
- Earth observation systems - page 498
I'd like you to consider a few questions (nothing to submit now!):
- From these sections of the report, does anything jump out at you with regard to data needs in emergency management?
- Do you think the Australia situation is similar to your home country?
- From what you know so far (and it is early in the course!) do you think geospatial data is most useful for:
- Preparing for a disaster?
- Responding when it is in progress?
- Recovering and rebuilding?
I hope this has provided a concrete and current picture of the complexity of emergency management. I'll refer you back to the Royal Commission report later in the class.
The Four Stages of Emergency Management
The improvement of the built and social environment in order to reduce, withstand or prevent disaster impacts.
- Hazard Analysis
- Vulnerability Assessment
- Scenario Development
- Community Engagement and Education
- Planning and Infrastructure Work
Actions taken prior to a disaster with the intent of ensuring a better event response
- Planning
- Training and Exercises
- Logistics
- Technology infrastructure
- Agency and stakeholder coordination
- Provide information and tools to citizens
Actions taken immediately before, during and after an event to alleviate suffering and prepare for recovery
- Establish Situational Awareness
- Evacuations and Shelters
- Respond to remaining hazard
- Search and Rescue
- Mass Care
- Logistics response
- Initiate Recovery
The rebuilding or improvement of disaster-affected areas
- Debris Management
- Return essential services
- Food and water
- Temporary housing
- Economic assistance
- Insurance claims and rebuilding
- Business aid
Definitions from the Tomaszewski (2014) textbook
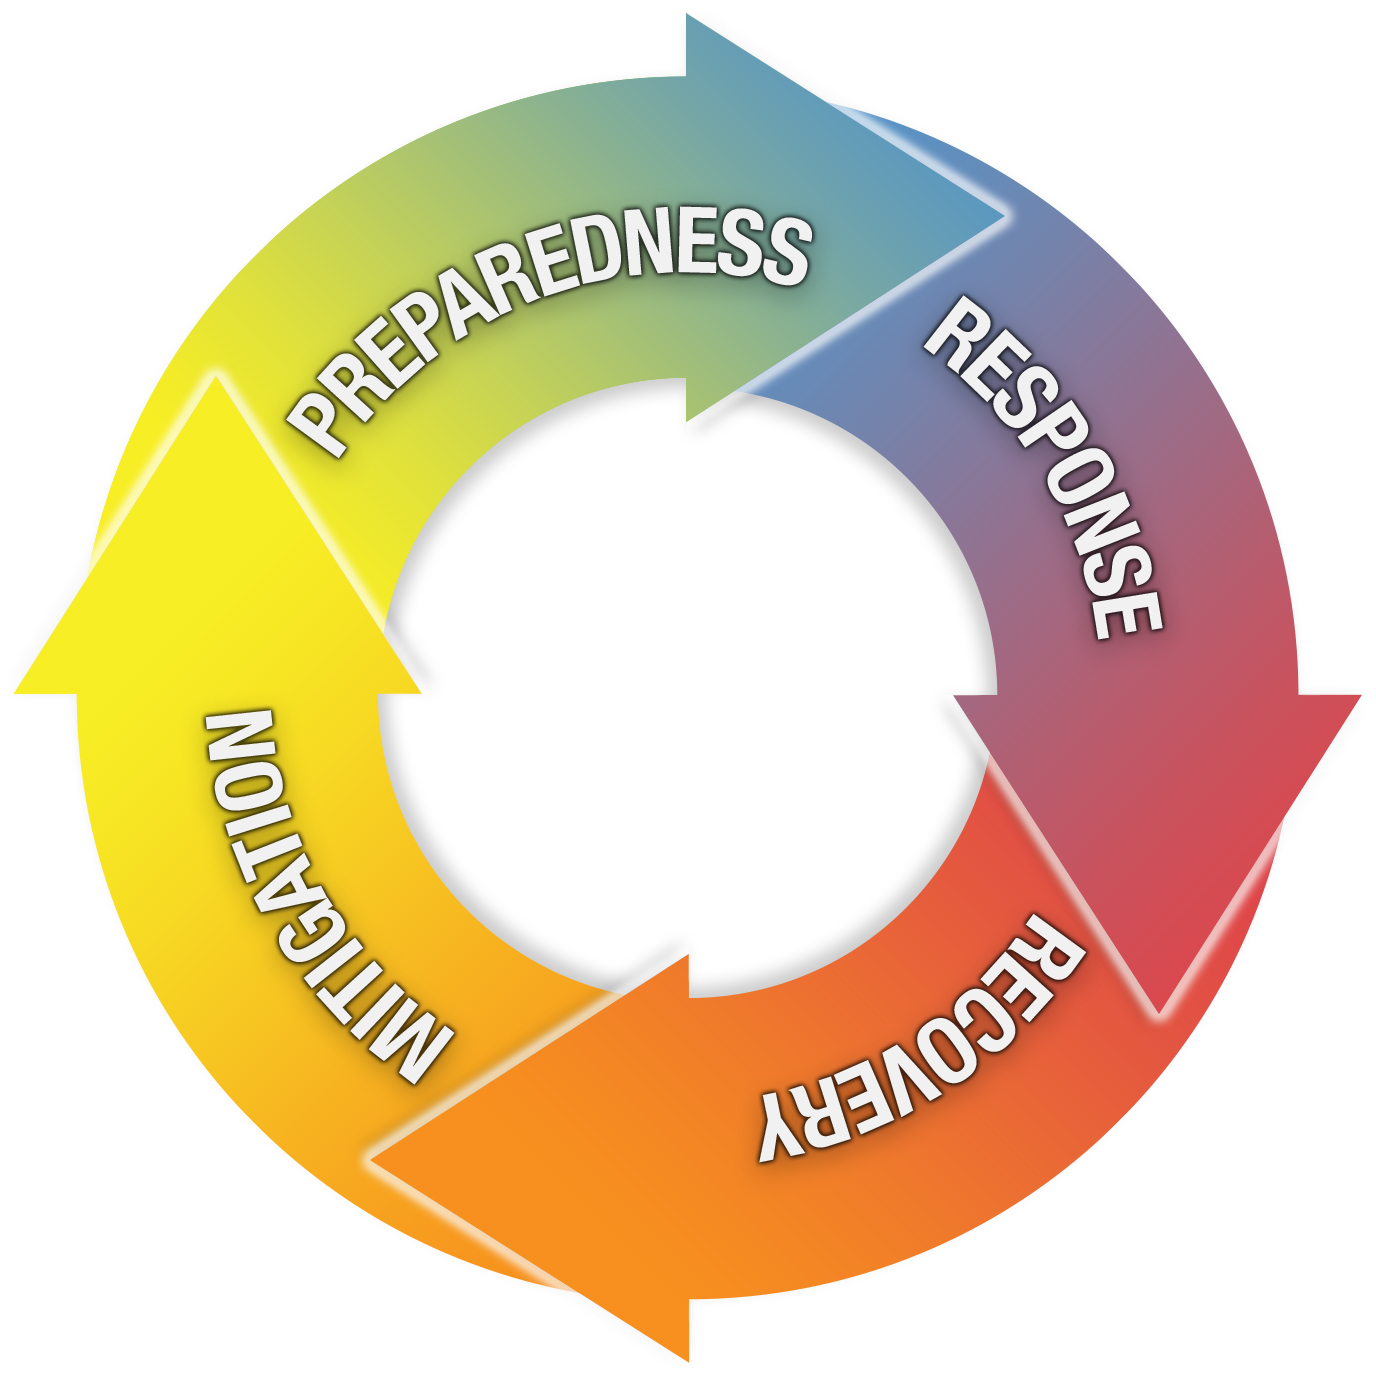
It is generally agreed upon that there are four key stages of emergency management problems.
- Planning & Mitigation
- Preparedness
- Response
- Recovery
You can probably imagine a wide array of possible geospatial applications that would make sense for each of these stages of emergency management. Lesson 2 in this class will talk about hazards more generally, and then, in Lessons 3-6, we'll start a deep dive into how geospatial perspectives and technologies can be used in these four stages. In Lessons 7-9, we'll explore scenarios and cover a few case studies to see how geospatial analysis has been used in real-world emergency situations.
Here are brief definitions for each stage of emergency management:
Planning & Mitigation: Evaluation of the potential types of disasters and the development of plans for reducing their probability or their impact on life & resources.
Preparedness: Actions undertaken when mitigation efforts have not prevented or are unable to prevent a disaster from taking place.
Response: Activities that occur in the wake of a disaster that are intended to identify and assist victims and stabilize the overall disaster situation.
Recovery: Actions following a disaster that aim to restore human and environmental systems back to normal.
Geospatial Approaches and Technology in Emergency Management
We will begin our consideration of geospatial approaches and technologies related to emergency management by contrasting four perspectives. On this page, the role of geospatial analysis in the work of the Federal Emergency Management Agency (FEMA) is described. This includes some historical perspective on how FEMA's mission has evolved over the last 10 years or so. Next, we will focus on emergency management related applications developed by Esri, the peak GIS software company globally. Then, for a very different perspective, you will consider what the 'digital humanitarian' community is doing in response to factors like big data, volunteered geographic information (VGI) and social media. Finally, we will consider emergency management in light of cutting-edge technologies. Of course, all of these areas are interrelated, and we will cover much more as the course proceeds! The idea is to start building a context and framework for developing a deep understanding of the topics to come.
First, we will take a look at the Federal Emergency Management Administration [8] (FEMA). If you're not familiar, FEMA is part of the US Department of Homeland Security and is the lead agency for preparing for, responding to and assisting with recovery from major disasters. Have a look at their website if you want to learn more. (As we move through the course, pay attention to the different roles that emergency management organizations play, particularly at local, state and federal levels, and the types of incidents they are responsible for).
For a little context, here's what FEMA Enterprise GIS Services considers its mission with respect to GIS and Emergency Management.
FEMA Enterprise GIS Services
Our primary mission is administration, coordination, collection, and dissemination of geographic information for FEMA and the Emergency Management Community under Emergency Support Function #5 (Information and Planning) of the National Response Framework and in support of the Robert T. Stafford Disaster Relief and Emergency Assistance Act (PL 93-288) as amended. Our current concept of operations includes a full range of GIS services to all FEMA program offices that encompasses sophisticated geospatial analytics through the Mapping and Analysis Center (MAC) and deployable GIS technology through the Deployable Emergency GIS program (DEGS).
Let's dig deeper into this. First, consider this excerpt from FEMA's Mapping and Analysis Center in 2008 [9] (note it is no longer maintained by FEMA and the MAC has evolved into other departments). Make a mental note of the range of functions that they focused on and some of the ways they went about their work. I wanted you to look at this old description, so you can contrast it with what FEMA does now, and more importantly to highlight how much has changed in a short period of time with regard to the ways geospatial products are generated and distributed.
Now, let's jump ahead 10 years! Start with the interesting 2018 presentation slides from Chris Vaughan [10] on GIS @ FEMA Working Smarter Through Data Analytics. Finally, have a look at the 20 September 2017 FEMA Geospatial Coordination Call briefing [11]. This is a summary of 'situation awareness' for the day Hurricane Maria hit landfall in Puerto Rico and is quite comprehensive.
With this historical context, have a look at some of FEMA's current offerings at the FEMA Geospatial Resource Center "Hub" [12]. Notice the dashboard with a summary of current hazard events. Click on a few of the hazards and look at what's available.
Consider these artifacts and reflect on what you see that may have changed in recent years, e.g., increasing focus on analytics and real-time.
Reading Assignment
How Reading Assignments Work
For each lesson, I will ask you to read parts of your textbooks and/or selected online materials and articles. As you can see below, I'll try to make it as clear as possible what you're expected to do by always identifying specific reading assignments in a separate box.
You can access the readings right in the course website, and they are also available in Canvas.
Lesson 1 Reading and Writing Assignment
For our first set of readings, we will focus on setting the stage for the rest of the lessons this term. First, I'd like you to read the white papers developed by folks at Esri and contrast it with the company’s current software and service offerings. These provide a simple overview of the common terms and topics associated with GIS for Emergency Management, and they show you how the GIS Goliath perceives the role of geospatial tools and methods in the context of Emergency Management. You just read a bit about how FEMA sees the state of affairs, and I think you'll notice some key similarities (and differences) in how the world is viewed from these two perspectives.
Second, I've selected a chapter from a National Academies of Science report written in 2007 that sets a research agenda for GIS in Emergency Management. The specific chapter I've picked for this week focuses on how GIS was or could have been used in a few different disaster scenarios. Unfortunately, these are examples that are still relevant today, over 10 years on.
Finally, you’ll contrast these perspectives with the emerging field of Spatial Data Science. First, you will look at a journal article focused on spatial data science and how it is shaping cartography/visualization. You'll see throughout this course that visualization is an essential part of understanding and addressing problems in emergency management. So, it is useful to explore spatial data science through this lens. The book chapter from Digital Humanitarians introduces how the disaster and humanitarian community is opening up and engaging with big data and volunteered geographic information (VGI) at a remarkable pace.
1. READ
ESRI White Paper on GIS for Emergency Management, [13] which outlines how Esri sees a role for ArcGIS in Emergency Management (in 2012!). Contrast this with Esri’s current ArcGIS for Disaster Management [14] tools on their website.
THINK ABOUT
These materials present definitions and roles for GIS in the context of Emergency Management. They also reflect the view from a major software vendor in this field. As you peruse these documents, think about which aspects seem software-specific vs. those that appear to be more general to all geospatial applications in emergency management. How would you define roles differently, or broaden some of their definitions?
2. READ
Chapter 2: Thinking About Worst Cases from Successful Response Starts With a Map: Improving Geospatial Support for Disaster Management. Please visit The National Academies Press [15] and read the chapter online or, you can create an account and download the chapter for free. This chapter is VERY OLD now (2007), but I think it will provide a good background for thinking about different disasters and how geospatial approaches can help us understand what might happen. Reflect on how things may be in 2023. For example, scenario two talks about a hurricane hitting the New York region, and this actually happened with Hurricane Sandy. We will talk about Sandy later in the course.
3. READ
Robinson, A.C. et al. 2017. Geospatial big data and cartography: research challenges and opportunities for making maps that matter [16]. International Journal of Cartography 3: 32-60.
If you are having trouble accessing the paper through the link above, you can download the PDF directly here [17].
4. READ
This short web article - Becoming a digital humanitarian, one deployment at a time [18] and Chapter 1: The Rise of Digital Humanitarians from Digital Humanitarians. See the Library Resources menu to read the chapter.
RESPOND
As you read the three different worst-case scenarios, it should be apparent that a key challenge is simply developing a rapid picture of the spatial extent of a disaster. If you assume that a given disaster will disable local EOCs and their accompanying geospatial tools and data, describe at least two ways that emergency managers brought in from afield could quickly assemble data that describes the extent of the disaster. How would folks from the digital humanitarian community approach this problem?
Deliverable
Complete the writing assignment - Details on the next page!
Writing Assignment
Based on this week's lesson, address the following:
1. As you read the three different worst-case scenarios, it should be apparent that a key challenge is simply developing a rapid picture of the spatial extent of a disaster. If you assume that a given disaster will disable local EOCs and their accompanying geospatial tools and data, describe at least two ways that emergency managers brought in from afield could quickly assemble data that describes the extent of the disaster. How would folks from the digital humanitarian community approach this problem?
2. What do you consider to be the one or two key challenges facing the application of Spatial Data Science to Emergency Management in (a) temporally short, geographically local event(s) versus (b) temporally extended, geographically regional events? Assume your audience is a group of emergency management planners considering incorporating geospatial data and analysis into their operations. They don't have a lot of time, so be direct and succinct in your analysis.
Make clear how your response relates to the readings.
This response should be between 500 - 600 words in length.
This class is writing intensive. I'll be editing and commenting on your written work throughout the term. Penn State's Style for Students [19] guide can be a huge help if it's been a while since you've written for a course like this.
Submission Instructions
It is important for you to save your files in the following format so that I can match each submission up with the correct student.
L1_assign_firstinitialLastName.doc For example, my file would be named "L1_assign_mBeaty.doc"
Upload your assignment to the Writing Assignment (L1) dropbox. See the Course Calendar for specific due dates.
Grading Criteria
This assignment is worth 4% of your total course grade and will be graded out of 20 points using the following rubric.
| Criteria | Description | Possible Points |
|---|---|---|
|
Content and Impact |
You make strong and logical arguments and provide analytical insights. Ideas are well organized, clearly communicated and relevant to the prompt. All criteria are accurately addressed. Supporting details are shared, elaborated upon and demonstrate understanding. Examples are provided, and your post includes images or other multimedia that support content. | 15 |
|
Clarity and Mechanics |
Evidence of editing and proofreading is evident. Writing is engaging and well-structured with excellent transitions between sentences and paragraphs. Concepts are integrated in an original manner. | 5 |
Discussion Expectations and Grading
Discussion Assignments - Readings and Emerging Themes
A key component of your graduate coursework will be participating in online discussions with classmates. This will occur around two main activities: 1) Discussion of the weekly readings and/or 2) Discussions of the Emerging Theme content.
In this class, you will be expected to be online and participating in online discussions at least 3 days a week. While the times of day and specific days of the week in which you do this work are flexible, you must participate actively and regularly in online discussions in order for you to be successful and fulfill your responsibilities as a member of the class learning community. I would suggest setting aside dedicated time several times a week for participation.
Timeline
Lessons begin on Wednesday and the discussion will be open for 10 days (even though the rest of the lesson is only scheduled for one week). Your initial post is due on Sunday. You are then required to participate in the conversation on at least two different days by or before the following Thursday.
Content
In addition to being thoughtful about the discussion prompts, I would like to see you asking and answering questions, making suggestions, and sharing examples from your own life. I would like to see this begin to look like a true conversation, so while most of your posts should be about a paragraph in length, some may be shorter and conversational. Remember to contribute to the learning community by being creative in your approaches to topics, being relevant in the presented viewpoints, and attempting to motivate the discussion. And remember, there is value in diverse perspectives, so it is ok to have a constructive and considerate disagreement.
Rubric
Your contributions will be scored as follows.
| Criteria | Points |
|---|---|
| Initial post is submitted on time | 3 |
| Follow up posts were made on two different days, 2 days gets full points, less than 2 days gets 0 points. | 6 |
| Quality of contributions | 6 |
| Total | 15 |
Emerging Theme: Introduction
Emerging Theme: Introduction
OK, you might think, "Well - isn't GIS already something most people consider high tech?" The answer to that question is a little complicated. In comparison to where we were about 20 years ago, yes, current GIS systems are pretty high tech. In comparison to recent advances in software, interfaces, and the ways in which regular people can participate in the development of data and tools - no, off-the-shelf desktop GIS software isn't so radical anymore.
What I hope to do in this course is to bring in new trends and themes in technology and imagine how those advances can and will impact spatial data science in the future, with particular emphasis on how those technologies fit or could be adapted to support geospatial analysis for emergency management.
Emerging Themes
Each lesson features an Emerging Theme page that presents a technology and encourages you to envision its potential impact on GIS systems for Emergency Management. I draw upon video lectures, links to live demonstrations, and other multimedia as much as possible to make these modules as engaging as possible.
The themes we will cover this term are:
- New Methods of Geospatial Interaction
- GIS and Unmanned Aerial Systems (UAS) - includes an exercise working with UAS data
- Volunteered Geographic Information (VGI) - includes an exercise
- Spatial Data Science - Data and analytics
- Real-time GIS and Analytics - includes an exercise working with operations dashboards
- Humanitarian Logistics and Supply Chains
- Social Media and Crisis Mapping
- Geospatial Artificial Intelligence (geoAI)
- Digital Twin
- Work on Term Project
The following 4:30 minute video, Geospatial - A Golden Thread in the Fourth Industrial Revolution is from the geospatial industry website, Geospatial World. It is a bit sensationalized but does cram in a lot of interesting content about technology and geospatial and provides some viewpoints from industry leaders. I hope it makes you want to learn more about these emerging themes!
Click for a transcript of the Fourth Industrial Revolution video.
A golden thread in the Fourth Industrial revolution
KUMAR NAVULUR: The key word is revolution, how a common person's life is changed with these technologies. So the first one is steam. The next one is electricity. The third one are computers.
[MUSIC PLAYING]
ANNE HALE MIGLARSE: It's about machine learning. It's about the internet of things. It's about the world awash in data. Certainly, data is a big part of what will drive the Fourth Industrial Revolution.
KUMAR NAVULUR: It's the disappearance of technology in good ways that is becoming ubiquitous. So the technology is hidden, but it's still there. The Fourth Industrial Revolution is all about new technologies, including artificial intelligence, robotics, connectivity of societies. When you have all the globe connected with internet, that kind of connectivity was never seen before.
SANDEEP SINGHAL: The Fourth Industrial Revolution. And I really regard it as the marriage of data, analytics, and real time presentation.
WILLY GOVENDER: How we as consumers of data are producing loads of data, more data every day than we have collected in a couple of decades we are producing nowadays. And it's how we are going to handle this data.
SANDEEP SINGHAL: Applying deep analytics, big data analysis, and machine learning to infuse that data together and really draw conclusions, and then present that information very, very quickly in order to drive changes in how we manufacture, changes in how we schedule resources, and so on.
ROBERT LAUDATI: And now you see that revolution made possible by the increase in sensors, In the increase in the analytical tools that many of the industry has. It's really about moving from data to answers.
NIGEL CLIFFORD: The revolutions that are going on in terms of affordable, massive technological shifts, geospatial is one really significant golden thread that's going to enable all users to find sense in some of the huge changes that are going on.
KUMAR NAVULUR: If we talk about augmented reality, yes, geospatial plays a role in terms of creating that virtual environment. If we talk about machine learning, robotics, geospatial definitely has a role.
WILLY GOVENDER: Just the proliferation of fake news-- we'll probably see fake data also appearing and making our lives more difficult. And that's where you're going to find that we need this geospatial industry to make the world better understand the data that we're producing, acknowledging the data, and verifying it so that we make the critical decisions.
ROBERT LAUDATI: All of us in the industry, from the data, the sensor developers and providers to the software providers, we see that wave coming of really the democratization of GIS and geospatial technology. Everyone will be using it in some form or fashion. But they won't have to be experts in the field to be able to process the information.
ANNE HALE MIGLARSE: We absolutely have a place to play in it. And our expertise in analyzing place is what brings us to the table. And so I think we should embrace fully participating in it.
KUMAR NAVULUR: So geotechnology, the location technology, is foundational to the Fourth Industrial Revolution. And I'm glad that our industry is a critical part of that.
On the next page, you'll find your first Emerging Theme assignment. In this assignment, we will examine new types of mobile interfaces and discuss how they could be integrated into future GIS systems for emergency management.
Emerging Theme: New Methods for Interaction with Location
This week, I’d like you to take a look at a few very exciting technology demonstrations that I think are relevant to spatial data science applications for emergency management. These videos show the cutting edge of what is possible with computers, and I think it’s quite reasonable to expect that in the next 5 years or so these things will become quite common in consumer and professional systems.
Throughout this course, we will be considering information from different viewpoints, including industry, government, NGO, and academia.
Let's start with this video about the ways spatial data and technology are being used (to varying effect) to address different aspects of the COVID-19 response.
How geospatial technologies can help combat COVID-19 (3:15 minutes)
Music playing
The next video is from the DHS Science and Technology Directorate’s Next Generation First Responder Program [21] and describe how emerging technology, including geospatial, are being incorporated in first response situations. They both describe a high level of integration amongst technology. Think about how this might fall down in a real emergency situation.
Next Generation First Responder (5:22 minutes)
Next Generation First Responder
[BEEP]
SERGEANT PARKER: Confirm what appears to be a building explosion and fire at the intersection of Hughes and Third.
DISPATCHER: Roger, 734. Additional units and fire are en route. Fire will provide incident command. I am patching your body cam feed to command now.
SERGEANT PARKER: Roger, dispatch.
[SIRENS]
OFFICER: What do we have, Sarge?
SERGEANT PARKER: Pretty much what the 911 caller reported. It looks like a building explosion.
OFFICER: The fire command is set up one block over. Williams and Moore are over there.
SERGEANT PARKER: Audrey, patch this call to Corporal Williams on his radio.
AUDREY: Copy that, Sergeant Parker. Patching you to Corporal Williams, located two blocks east on Third Avenue.
[BEEP]
CORPORAL WILLIAMS: Williams.
SERGEANT PARKER: Corporal, this is Sergeant Parker.
CORPORAL WILLIAMS: Go, Sarge.
SERGEANT PARKER: You've got Incident command setting up over there where you are. I need you to reroute traffic and keep onlookers way back so fire and EMS can get through.
CORPORAL WILLIAMS: Roger. Already on it. Sarge, check your phone. We got an alert.
SERGEANT PARKER: Audrey, get me incident command, any path.
AUDREY: Linked to incident command.
[BEEPING]
SERGEANT PARKER: Command, this is Sergeant Parker.
BATTALION CHIEF BENDER: Battalion Chief Bender here, Sergeant. I see you're on the northwest corner. From your video, it looks like the building entrance is blocked with debris.
SERGEANT PARKER: It's going to take some digging to get inside.
BATTALION CHIEF BENDER: We're linked to the closed circuit cameras in the building. We also have a drone up overhead showing two large hot spots on the top floor. But a witness says there are at least two people still in the building, so I'm sending a team to the Third Street entrance.
FIREFIGHTER: I've got two civilians here.
[BEEPING]
Who's in trouble?
FIRE CHIEF: Fire Team One, it looks like we have a mayday. Firefighter Thompson is down. Heart and breathing rates spiking.
FIREFIGHTER: We're on it, chief. He got pinned by a chunk of ceiling. We're also bringing out two civilians. We put vital sensors on them. EMS should be getting readings now.
FIRE CHIEF: EMS, do you copy the message from Fire Team One.
EMT: Got it, chief. I'm getting vital signs on one firefighter, two civilians. Looks like we have two red tagged patients with severe burns and trouble breathing and a firefighter with possible crush injury. I need you to start the IV and get ready to intubate. Audrey, connect me to the nearest trauma center.
AUDREY: Linking to St. Anthony's trauma center, 3.7 miles. Estimated travel time, seven minutes.
NURSE: This is Miriam Zheng. Go ahead, EMS.
EMT: I have three victims, two civilians, one firefighter. I don't have eyes on them yet, but I'm sending you telemetry.
NURSE: Yes, I see the data. Definitely two red tags there. Do you have RSI medications ready and prepared to intubate if needed?
FIRE CHIEF: We do. Soon as we get them stabilized and we're on the way, I'll send more telemetry and detailed assessment information.
NURSE: OK, we'll be ready. Thanks for the heads up. I'll continue monitoring their vitals and transport.
EMT: Audrey, patch me to command.
FIRE CHIEF: This is command. Go, EMS.
EMT: Chief, we have two victims in serious, maybe critical condition. I'm recommending a medevac.
FIRE CHIEF: Copy that. I'll alert aviation. There's a park two blocks east of here. Looks like the best landing site. I'll have law enforcement cordon it off.
CCTV REVIEWER 1: I have the view from a camera on a building across the street. It looks under control.
CCTV REVIEWER 2: I have a white SUV matching the description on two traffic cams headed east on Third past Tacony. I think I can pull the plate number from that.
COMMANDER: OK, great work. Let's datacast the route that vehicle's on to all patrol units, and when we get the plate number, let's send that out, as well.
[BUZZ]
OFFICER: Good job, Sarge.
NARRATOR: First responders today have nothing like the communications tools in this video, but we are making progress. Through its Next Generation First Responder Program, the DHS Science and Technology Directorate is leading the effort to develop these capabilities and get them into the hands of responders in the next five years. It's important work that will help law enforcement, fire, and emergency medical personnel save lives, protect property, and enhance security in communities everywhere.
Finally, take a look at the I-React project funded by the European Commission that use augmented reality in an disaster response situation. Visit this website [22] and watch the video below.
Emergency Management with Augmented Reality (4:00 minutes)
NARRATOR: Environmental catastrophes have reached levels that have never been recorded anywhere in the world. To face such a powerful and often unpredictable events, it is essential to work on prevention and emergency management. Nowadays, a smartphone application can be a valid tool to save lives.
PRESENTER: In the last 10 years, natural disasters have caused around 7 million casualties in Europe alone, and up to 113 billion euros of overall economic losses. Floods are the biggest hazard in the EU, in terms of people affected and economic damage.
At the Civil Protection Control Room in Turin, it's an emergency simulation day. Developers from the I-React team are here to lead their final tests on a smartphone app improving risk management systems that will help citizens to cope with climate related disasters. The app is part of a complex system which processes large amounts of data and generates valuable information during a natural disaster.
NARRATOR: I-React, as we saw during the exercise, gives us the ability to gather your reference data on the ground to know where the critical points are and to know what is happening and what main information is needed.
PRESENTER: I-React is the first European-wide platform to integrate emergency management data coming from multiple sources, including satellite climate services and weather forecasts, combined with information sent by emergency workers and citizens through the mobile app. It provides real-time pictures of the situation.
NARRATOR: The data from the I-React system is generated by devices that are present in our daily lives, such as applications on our smartphones, social networks, and above all, e-matches and data from the Copernicus Satellite System.
PRESENTER: The app, which was issued by a European research project, is meant to be a valuable tool for emergency workers. But not only that, it also allows for involvement of citizens, who can be an important element in the information gathering process.
NARRATOR: This app is designed for ordinary people, not only for civil protection, to send reports on an emergency situation and to receive reports from an operation center.
PRESENTER: Civil protection volunteers are often first on the scene during an environmental emergency, that's why an easy to use device is key for their mission.
NARRATOR: I found it extremely simple and fast. In a real emergency, it's important to send updates on the situation in real-time, not only with words, but with images.
PRESENTER: I-React enables the operators to gather and send data in different ways during an emergency operation. In addition to smartphones, stakeholders are also equipped with smart glasses and other wearable georeference devices so they can receive and send information without using their hands.
NARRATOR: What I'm wearing is a prototype of augmented reality glasses, able to perform some functions that can also be performed on the app. For example, if there is a river that is flooding, I can take a picture. I follow the same steps I would do with my cellphone, but in this case using only one hand. And thanks to this remote control, I can send the report to the operations center.
PRESENTER: After having tested the effectiveness of the app during an international civil protection exercise in 2018, researchers of the pan-European I-React Team are currently fine-tuning the system before they release it to the emergency management market at the end of this year.
Digital Twins (4:24 minutes)
Music Playing
Deliverable
- Post a comment in the Emerging Theme Discussion (L1) forum that describes how you envision one or more of these technologies integrating into a spatial data science for emergency management. Do you see any problems with integration, or, perhaps, you don't think we should consider them for emergency situations. That could be a valid position to take as well.
- The initial post should be completed during the first 5 days of the lesson.
- Then, I'd like you to offer additional insights, critiques, a counter-example, or something else constructive in response to your colleagues on two of the following 5 days.
- Brownie points for linking to other technology demos, pictures, blog posts, etc., that you've found to enrich your posts.
NOTE: Respond to this assignment in the Emerging Theme Discussion (L1) forum by the date indicated on the course calendar.
Grading Criteria
This discussion will be graded out of 15 points.
Please see the Discussion Expectations and Grading page under the Orientation and Course Resources module for details.
Term Project Description
Term Project Overview
This course is built around a term project that will integrate your understanding of geospatial perspectives and technologies with what you have learned about how they can be applied to emergency management. You will select a project topic from one of the options described below and write a report that includes spatial data analysis and visualization approaches. In some cases, this might take the form of a case study, in others, a proposed geospatial system design or a demonstration (e.g., dashboard or app) that illustrates either current trends in applying geospatial thinking to emergency management or what might be possible in the near future.
To a large degree, you will have the freedom to shape the specifics of your term project around the geospatial and/or emergency management contexts in which you are most interested. I hope that this allows you to either focus on a topic related to your day-to-day work or to choose an area that sparks your curiosity. That said, it should be clear who you are writing for and the role you are playing in preparing this report.
Your analysis will be informed by relevant datasets that you find, analyse, and visualize. A key task early on is identifying a suitable dataset and developing some ideas about what you’d like to do with it. I can help with this process and when you develop the abstract for the project, we will meet to discuss your ideas and make sure they are achievable in the time you have. I will also circulate a list of websites where you can search for suitable data. There are many options, so don’t be too concerned about being able to find suitable data.
You can choose from a wide range of tools to conduct your analysis and visualize the results, including Esri products like ArcGIS Pro or ArcGIS Online/Portal. You have access to a wide range of Esri tools through your Penn State Accounts. But don’t forget about other possibilities such as web mapping tools like MapBox or open-source tools like QGIS and R. In this course, we use a range of data and technologies and you can do the same with your projects. Just keep in mind you’ll need to balance the time you have to do the analysis and write your report with the time you have to learn new software.
Each week, you will notice that at least one page of the lesson is dedicated to a goal or assignment associated with your term project. In about half of those Lessons, you need to complete a graded deliverable related to your final project. I've developed a project schedule that is designed to make sure you make steady progress on the term project and that also ensures that we have one full round of draft editing to refine your work. I don't like classes that end with submitting a final project with no chance to do any revisions. That seems silly to me.
My hope is that you end the semester with a product that has utility beyond just meeting the course requirements. It could end up being a use case or a proposal that you share with others in your organization. This has been the case for some students in past offerings of GEOG 858.
Term Project Options
Here are some options for your term project. You can choose one of these options, or if you'd like to riff on one of these and take it in a different direction, by all means, do so! These are really just suggestions: I want you to be innovative and surprise me with your good ideas for projects. But I also know that many of you want to know what a good example project might look like, which is why I've listed these options here.
- OPTION 1: Develop a case study on the use of specific geospatial data and technologies from a recent crisis or disaster. Using geospatial data and analyses, demonstrate at least one way that geospatial approaches were used effectively and at least one way their use could have been improved. This option should be built on your original analysis and not just a review of what others have done.
- OPTION 2: Develop a vulnerability, hazard assessment, and mitigation case study for a place that has not recently been impacted by a disaster. Develop a concept for a geospatial system to support these activities and build a prototype to illustrate your main points.
- OPTION 3: Address the question, Why is recovery so difficult? For this project, conduct a comparative analysis of recovery after recent disasters (ones that occurred within the last ten years) in two to three case study areas. Use geospatial data and analysis to help illustrate and communicate the comparisons and main points you make.
- OPTION 4: Focus on an emerging technology that is changing how geospatial analysis is applied in emergency management. You may consider a technology we cover in this course, or focus on a different technology (but provide an argument for your choice). Provide context for the technology, but focus on some specific aspects of its use that you can demonstrate using spatial data and analyses.
Deliverables (for Future Lessons)
The term project includes the following deliverables that will be assigned to you in future lessons:
- Project Abstract indicating which project option you have chosen and describing in general terms what you will cover - assigned in Lesson 2 (Worth 5% of total grade)
- Project Outline and Short Video Presentations (headings and several bullets under each heading for the main topics you'll cover). Produce a short 3-5 minute video introducing your topic to the class - assigned in Lesson 4 (worth 8% of total grade)
- Full Draft of your Term Project Report, no longer than 5000 words, not including an appendix where you can outline your methodology in greater detail - assigned in Lesson 6 (worth 12% of total grade)
- Revised Term Project Report, no longer than 5000 words, not including an appendix where you can outline your methodology in greater detail - assigned in Lesson 10 (worth 16% of total grade)
- 5-7 Minute Video Presentation of your Term Project - assigned in Lesson 10 (worth 4% of total grade)
Look for details on each deliverable (including specific due dates and grading criteria) in future lessons.
NOTE: I have provided examples of each term project deliverable on the following page in CANVAS.
Summary and Final Tasks
Summary
In this lesson, you have received an introduction to some of the major concepts associated with spatial data science for emergency management. You reviewed the four basic stages of emergency management and read some background material that defines common terms to geospatial science and emergency management.
Disasters and emergencies provide a wide range of opportunities for geospatial systems to play an important role, and in future lessons, we will delve into these possibilities in detail.
This week, we covered our first emerging technology theme. I've created a page for every lesson that focuses on a different technology theme that I think is relevant in some way to future geospatial applications for emergency management. When we are concerned about planning future geospatial systems, it is essential to become aware of new technology trends that could significantly impact how systems work in the not-too-distant future.
In the next lesson, we will review the range of hazards and emergencies that may require the use of spatial data science to aid mitigation, preparation, response, and recovery efforts.
Reminder - Complete all of the Lesson 1 tasks!
You have reached the end of Lesson 1! Double-check the to-do list on the Lesson 1 Checklist page to make sure you have completed all of the activities listed there before you begin Lesson 2.
Questions?
If you have any questions, please post to the Canvas Discussion Forum called "General Questions" or email the instructor via Canvas conversations (if the question is personal in nature).