Lesson 4: Preparedness
Overview & Checklist
Overview
We are shifting our focus now from vulnerability assessment and hazard mitigation to the next stage of emergency management, preparedness. One way you can think of this phase is that it involves activities to address shortcomings in planning aimed at reducing vulnerability and mitigating hazards. Preparedness is about what you need to be able to do when the worst happens - being ready to respond and promote recovery.
In this lesson, you will read about ways in which geospatial analysis can be used to target intervention and evacuation efforts to reduce the impact of forecast disasters. You'll respond to one of the readings with a written critique. This week, the emerging theme discussion focuses on Humanitarian Logistics and Supply Chains. Finally, for your term project, you will develop a detailed outline to help guide your progress.
What You Will Learn
At the successful completion of Lesson 4, students should be able to:
- explain disaster preparedness and how it is supported by geospatial perspectives and technology;
- critically evaluate technical literature on geospatial analysis for emergency preparedness;
- evaluate and discuss disaster and humanitarian logistics and supply chains;
- complete an outline for your term project report.
What You Will Do
Lesson 4 is one week in length. To finish this lesson, you must complete the activities listed below.
| To Read |
|
|---|---|
| To Do |
|
Please refer to the Course Calendar for specific due dates.
Questions?
If you have questions about the content or lesson activities, please post them to the General Questions and Discussion forum in Canvas. While you are there, feel free to post your own responses if you, too, are able to help a classmate. If your question is of a personal nature, please email me directly through Canvas.
Disaster Preparedness
CC BY-NC-SA 4.0 [4]
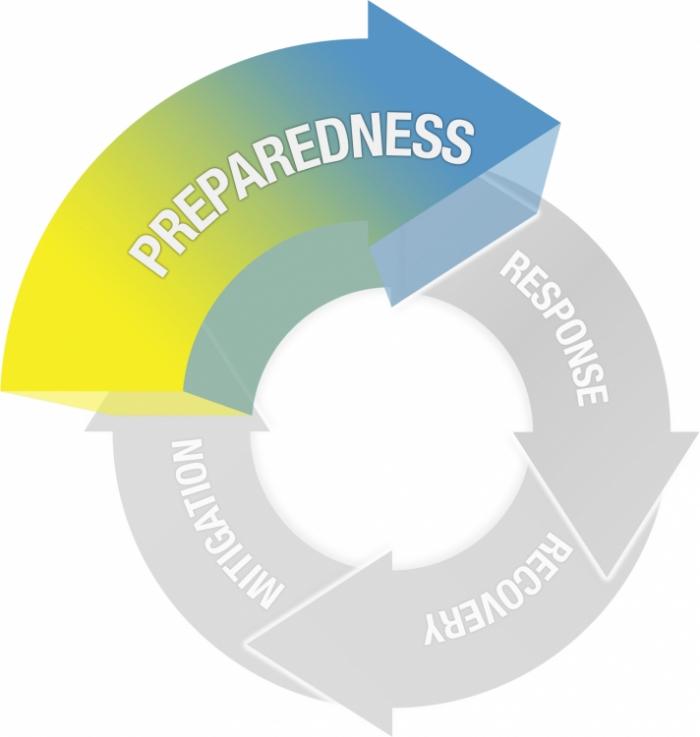
Preparedness
Actions taken prior to a disaster with the intent of ensuring a better event response
- Planning
- Training and Exercises
- Logistics
- Technology infrastructure
- Agency and stakeholder coordination
- Provide information and tools to citizens
An Ounce of Preparation...
...is worth a pound of cure, right? Often disaster situations do not present themselves with substantial warning. Some events, like earthquakes or terror attacks, occur with little or no advanced warning. Other events, like hurricanes or tsunamis, may allow for some substantial amount of time (ranging from an hour or two in the case of a tsunami to several days in the case of a hurricane) to prepare for the initial impact. No matter what the type of event, there are ways we can prepare by taking advantage of geospatial capabilities.
In lesson, we will explore geospatial enabled preparedness in several ways. On this page you will contrast different scenario-based activities - one focused on large scale disasters and another on a more localized emergency. Then you will consider some of the science behind forecasting and modeling potential emergencies, and the geospatial technologies that are being used to develop the capacity ahead of time for situation awareness when disasters do strike. Finally, you will once more contrast large and small scale preparedness activities and the role of geospatial data and analysis by looking at Humanitarian and Disaster Logistics and models for improving building evacuation. So the idea is to think about preparedness as a set of activities with multiple dimensions (spatial and temporal scales) and geospatial analysis as a key tool for managing this complexity.
Scenario-based Exercises
A highly regarded method for preparing for disasters involves the use of scenarios to conduct realistic exercises to simulate a crisis situation. Using the examples below, contrast live training exercises on small-scale (such as Active Attacker Situations) with those developed by FEMA for large-scale earthquake scenarios. For disasters that provide no advanced warning, using scenarios may be the only way to really prepare in advance. We'll go in-depth on designing scenarios later on in Lesson 7, but for now, read this short article from GovTech about how GIS can help communities prepare for disasters [5]. How effective do you think these activities would be? Could the community be engaged more actively? How do you think things have changed since the GovTech essay?
FEMA Earthquake Preparedness Scenario
FEMA has developed a wide range of training exercises to aid in disaster preparedness and response. I'd like you to consider the following materials they developed for a catastrophic earthquake in Southern California. Here is their description of this resource.
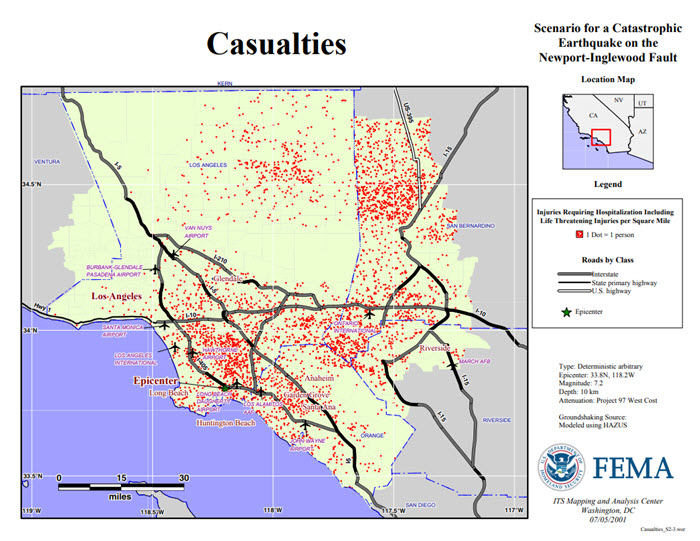
Scenario for a Catastrophic Earthquake on the Newport-Inglewood Fault
"Emergency planners use HAZUS-MH to provide realistic catastrophic planning exercises. Over the last several years, FEMA has supported the development of a suite of "priority maps" to support our Federal Response Plan (FRP) partners in preparing for, and responding and recovering from a catastrophic earthquake. A suite of ten priority maps that illustrate the region of strong ground shaking, direct and induced damage, as well as estimated social impacts were developed to provide information for FRP partners within a few hours of an earthquake event. By using the priority maps in regular planning exercises, the FRP partners will become familiar with the map information produced within a few hours of a damaging earthquake." Credit: FEMA [6]
Here is an example of one of the exercise's realistic maps showing casualties. Other realistic geospatial products and other material are produced and presented to participants during the course of the exercise to help prepare emergency managers for real events. When reviewing these materials, do a quick thought experiment and think about all of the different groups involved in a disaster like this. Think about the agencies and organizations involved and the level of coordination required at local, state, and federal levels. We'll consider these issues as we move on through the course.
Active Attacker Preparedness Exercises
Preparedness scenario exercises are not just undertaken for large scale, catastrophic events but are increasingly being used in response to local events. One of the clearest examples of this, unfortunately, is the increasing prevalence of active shooter or active attacker drills. These range from training for police to more detailed and realistic exercises involving first responders along with real civilians (including students and teachers) and perpetrators played by actors.
I'd like you to have a look at two example videos. The first one is a news report on a very realistic drill being conducted at a Colorado school. This video provides a pretty good behind the scenes view of how elaborate this training can be. The second item to look at is a more educational-type video produced by Penn State for Students, Faculty, and Staff to help them know what to do during an Active Attacker situation.
Warning! These videos depict simulated active shooter scenario that some people might find distressing. If you prefer not to watch the video, please reach out to the instructor for alternative media.
Video: Police Practice Active Shooting Drill at Colorado High School (8:03 minutes)
Click here for a transcript of the Police Practice Active Shooting Drill video.
DAN HARRIS: Shots fired at a high school. Hostages strapped to explosives. It's a nightmare scenario for law enforcement. How do they respond? Tonight, you're going to see police stage an extraordinary active shooter drill, and it all plays out on camera. Here's ABC'S Clayton Sandell.
CLAYTON SANDELL: Inside this Colorado high school, we are on the front line of one of the most dynamic active shooter drills in the country.
[GUNSHOTS]
The goal, make it as real and stressful as possible-- gory makeup on victims, fire alarms, heavy smoke, deputies rushing in amid screams and confusion. Their mission? To subdue the shooter as quickly as possible.
POLICE OFFICER: Stop! Stop!
[GUNSHOTS]
Shooter down.
JEFF ENGEL: They're going to have to prioritize, one, what's the priority of life? One is to stop the threat. The second is to start saving lives. Walking wounded. People--
CLAYTON SANDELL: Sergeant Jeff Engel is coordinating today's exercise for the Douglas County Sheriff's Department here in suburban Denver.
JEFF ENGEL: There's got to be that immediacy, that aggressive action, that you need to go in and stop the threat.
CLAYTON SANDELL: With 248 mass shootings this year and counting, his department, and those around the country, are using real life tragedies as a way to prepare. And you incorporated some of Orlando into what you were doing today, right? Tell me what it was you did.
JEFF ENGEL: Having a situation where we had a whole bunch of folks that were surrounded by a device. And how are we going to move people from a place of danger to a place of security?
POLICE OFFICER: Moving.
POLICE OFFICER: Moving.
CLAYTON SANDELL: And this school mere miles from Columbine High.
POLICE OFFICER: Free to move again.
CLAYTON SANDELL: In a region that's seen more than its share of mass shooting tragedy.
PETER JENNINGS: There's been a day of horror in Littleton, Colorado, just south of Denver.
GEORGE STEPHANOPOULOS: A terrifying moment in Colorado late Tuesday. A horrific scene east of Denver, where a night at the movies has turned into a nightmare.
JEFF ENGEL: Colorado is kind of the epicenter of these immediate action events and these active killer events.
CLAYTON SANDELL: When Columbine was attacked in 1999, it had long been the policy for officers to wait outside for the SWAT team to arrive, but that 45-minute delay before officers went in was later criticized for allowing the gunmen to continue their killing spree, precious moments lost that might have saved lives.
PARAMEDIC: I was one of the first medics at Columbine. We did have to stand outside, unfortunately, and wait for the building to be cleared before we could go in and find any survivors.
TRAINER: Explosion in an office complex.
CLAYTON SANDELL: Today, training calls for even the most junior cops to immediately take the fight to the bad guy and take him out.
JEFF ENGEL: They want officers, when they come out of the law enforcement academy, would like to have them to have that ability to go in as a single unit, or as a two-person unit, to go in and take care of a threat, because that is the reality.
TRAINER: If you cover me, I'll cuff him.
This is what I signed up for. I'm going to be scared. I know that. But it's all about how you kind of control your emotions, and you kind of funnel that into something that's effective.
CLAYTON SANDELL: Deputy Kristen Tinsley knows the heartache all too well.
KRISTEN TINSLEY: Moving.
CLAYTON SANDELL: She went to Columbine High School.
KRISTEN TINSLEY: We have a lot of very local things that we can go to for experience to train from. It's happened, you know, just miles away.
CLAYTON SANDELL: Today's drill, more than 60 officers and 50 students acting as victims. For Jeremy Finkenbinder, training these teams hits home. When something like Newtown, San Bernardino, Orlando happens, do those things keep you up at night?
JEREMY FINKENBINDER: I think about them quite a bit, I really do. This is my passion.
CLAYTON SANDELL: What's the goal now?
JEREMY FINKENBINDER: The goal now is to be able to render medical aid quickly, to save more lives. That's really what it boils down to. Tip of the spear, my first priority is to get the bad guy terminated. He's out of the equation.
TRAINER: Be aware of your cover and what you guys are moving to. If your partner gets hit, what do you do?
CLAYTON SANDELL: The first scenario of the day begins.
TRAINER: --been reports of two shooters wearing tan pants and black shirts.
KRISTEN TINSLEY: It's like a nervous excitement. It's the anticipation of-- it's like the fear of the unknown. You want to do really well for your teammates and for the people that you're trying to help out.
CLAYTON SANDELL: Tinsley and her team get ready to rush in. The officers navigate through pandemonium.
POLICE OFFICER: Aggressive target.
CLAYTON SANDELL: This is what you call a contact team, three or four officers all working together, moving right to the threat as fast as they can.
[GUNSHOTS]
They quickly overtake the gunman.
POLICE OFFICER: Shooter down.
CLAYTON SANDELL: But the teams find even simulated chaos comes with real problems, even real wounds.
POLICE OFFICER: And a bad guy, obviously got one off and I took a round as soon as I even came on point.
CLAYTON SANDELL: Plus all that noise drowns out police radios. There's confusion.
POLICE OFFICER: Is that it? Three inside?
CLAYTON SANDELL: And now police have more to worry about.
POLICE OFFICER: Contact.
CLAYTON SANDELL: They must also protect unarmed paramedics moving in right behind them.
JEREMY FINKENBINDER: We'll provide safety for them while they're taking care of business inside and rendering aid.
CLAYTON SANDELL: For the day's final drill, Tinsley and her fellow first responders will deal with a worst case scenario, shots fired at a high school, hostages strapped to explosives. The teams race toward the sound of gunshots, down stairs and hallways, not knowing how many gunmen there are. Just as things are heating up at the high school, another call sending deputies to a different school up the street.
DISPATCHER: We're getting reports of a possible active shooter at middle school.
POLICE OFFICER: 204, 203, we copy.
CLAYTON SANDELL: Two deputies head in alone, no time to wait for backup. Inside, helpless victims, one student chained to a bomb. But these cops know their first priority is to eliminate the threat.
POLICE OFFICER: Where is he?
CLAYTON SANDELL: A shooter in a first floor bathroom.
[GUNSHOTS]
POLICE OFFICER: Come out with your hands up.
POLICE OFFICER: Come on, come out with your hands up.
CLAYTON SANDELL: But just as the officer tries to take that final shot, her gun jams. Their backup arrives just in time.
POLICE OFFICER: All right, so they're pinned down by the bathroom taking shots. Is he by himself, or does he have a hostage in there? Do we move? Do we hold?
POLICE OFFICER: Is he in there by himself, do you know?
POLICE OFFICER: I think so. I don't know.
[GUNSHOTS]
POLICE OFFICER: Suspect down.
[INTERPOSING VOICES]
One suspect down.
CLAYTON SANDELL: But upstairs, a surprise second shooter.
POLICE OFFICER: Drop the weapon.
[GUNSHOTS]
[SCREAMS]
CLAYTON SANDELL: Officers quickly take him down.
POLICE OFFICER: He is out of play. He is out of play.
CLAYTON SANDELL: When it's all over, they talk about what went right and what went wrong.
JEFF ENGEL: Who identified themselves as the tactical supervisor? If no tactical supervisor's there, how chaotic would it be? I mean, how chaotic is it with a tactical supervisor? Now imagine without. So there needs to be-- try to get that command and control.
CLAYTON SANDELL: As jarring as the day was, Sergeant Engel hopes the day has given his troops a taste for the real thing.
JEFF ENGEL: You had some IEDs. You had multiple threats. We had multiple engagements. We had compromised entry points. I mean, those things are coming this way. That's what truly does scare me.
CLAYTON SANDELL: You think it's coming this way. I mean, it's--
JEFF ENGEL: Oh, it's here.
CLAYTON SANDELL: He knows the harsh reality for Kristen Tinsley and her fellow cops. It's not a matter of if she'll use what she learned today, but when.
KRISTEN TINSLEY: I'm going to feel a heck of a lot more prepared than I did coming into today, that's for sure. I mean, you're still going to have all the different emotions of the unknown and everything, but at least I have some sort of base to build on now.
JEREMY FINKENBINDER: Everybody's got to be ready, no matter-- first day on the job to the guy that's going to retire next week, we want them all to be ready, because you know, a warrior's a warrior, and it never quits.
CLAYTON SANDELL: For Nightline, I'm Clayton Sandell in Highlands Ranch, Colorado.
[MUSIC PLAYING]
Video: Run, Hide, Fight - Surviving an Active Attacker (6:42 minutes)
[SINISTER MUSIC PLAYING]
Instuctor walking around a classroom: Less than a minute to finish up, folks. What have you got?
[INTERPOSING VOICES]
[MUSIC PLAYING]
[BOMB EXPLODING]
[HIGH-PITCHED RINGING]
[INTERPOSING VOICES]
CHRIS: We can't stay. We need to go.
SPEAKER 2: Where we gonna go?
CHRIS: I don't know. We just need to go.
[INTERPOSING VOICES]
PRESENTER: What would you do if you learned that there was a bombing on campus?
SPEAKER 3: Explosion or something. I don't know. I don't know.
PRESENTER: How would you react if you heard gunshots coming from outside your classroom? Or worse yet, what if someone with a knife or a gun came into your classroom or office and began to attack?
[GUNSHOTS]
To help us remember the options available to you, let's use the phrase "run, hide, fight." Have an escape route in mind. Find a place to hide. If necessary, fight the attacker as a last resort.
SPEAKER 4: Where did that come from?
SPEAKER 5: I don't know.
SPEAKER 6: Shots fired.
SPEAKER 7: Shots?
SPEAKER 5: Oh my god. I don't know.
SPEAKER 4: Chris is right. We need to go.
SPEAKER 8: Come on, let's go.
[INTERPOSING VOICES]
CHRIS: I think we're clear. Let's go.
PRESENTER: One option you have is to run for an exit. Get away from the attacker. Run in the opposite direction. Get out of the area and find a safe place as soon as possible.
[MUSIC PLAYING]
CHRIS: OK, let's go.
[MUSIC PLAYING]
[GUNSHOTS]
[SCREAMING]
[GUNSHOTS]
[MUSIC PLAYING]
PRESENTER: Once you feel that you're in a safe place, alert the authorities. Call 911. Just remember to first get somewhere safe.
CHRIS: I think we're safe, but you need to call the police.
SPEAKER 8: Yeah.
SPEAKER 9 (ON PHONE): University police. Where is your emergency?
SPEAKER 8: There was an explosion. And heard gunshots.
PRESENTER: Don't assume someone else has already called 911. Provide the operator with as many details of the situation as you can.
SPEAKER 10: I think there are two shooters in the building.
PRESENTER: Don't call anyone else. The 911 operator may want to call you back for further information.
SPEAKER 11: We need help. Please hurry.
PRESENTER: Another option you have is to find a place to hide from the attackers.
SPEAKER 12: Shooters in the building. Find a place to hide.
PRESENTER: If the room appears to be empty, there's a better chance the attacker will simply pass it by. If you choose to hide, be sure to lock and barricade the door. Use whatever you can find to block the door to prevent the attacker from coming in.
[MUSIC PLAYING]
[GUNSHOT]
[MUSIC PLAYING]
[GUNSHOTS]
[MUSIC PLAYING]
[DOORKNOB RATTLES]
[MUSIC PLAYING]
[SIRENS BLARING]
[MUSIC PLAYING]
If the attacker has entered your immediate vicinity and there's no way out, you need to be prepared to end the threat and fight the intruder.
SPEAKER 4: We're trapped!
[MUSIC PLAYING]
SPEAKER 13: Threat forward. Threat forward. Turn right. Right down, break off for cover. Put your hands on your head. Put your hands on your head.
PRESENTER: Remember-- run, hide, fight. No one wants to be involved in an active attacker situation, but these incidents do happen on and off campus. If you take a moment to think through how you would act, you will increase your chances of survival. Commit to taking action. If you're ever caught in an active attacker situation, now you know just what to do.
[MUSIC PLAYING]
Simulating Disasters
GIS and other geospatial technologies can support a key element of disaster preparation through computational simulation and modeling. A wide array of specialized modeling software extensions for ArcGIS and other GIS platforms are available. This software enables users to tweak disaster parameters and simulate damage patterns due to storms, earthquakes, disease outbreaks, and fires (think back to InaSAFE from the previous lesson). With the rise of cloud computing, near-real-time data streams, and big data analytics, much of this happens at a fast pace including analysis well before the event up to the start of the event itself. For example, thinking about the preparations for Hurricane Florence and how often decisions on pre-deploying assets changed as new information became available to the managers. This will become clearer when we consider disaster and humanitarian logistics later in this lesson.
The output of these models can be viewed in static maps or interactive web tools. Some real-time modeling capabilities exist for emergency managers to test various parameters and visualize their potential impact, but few of these systems are available for free to the general public (very unfortunate!). The Pacific Disaster Center [9] in Hawaii does quite a lot of work on modeling and visualizing model outputs for disaster scenarios. Have a closer look at this site and some of the tools and apps PDC offers [10], including the disaster preparedness training [11].
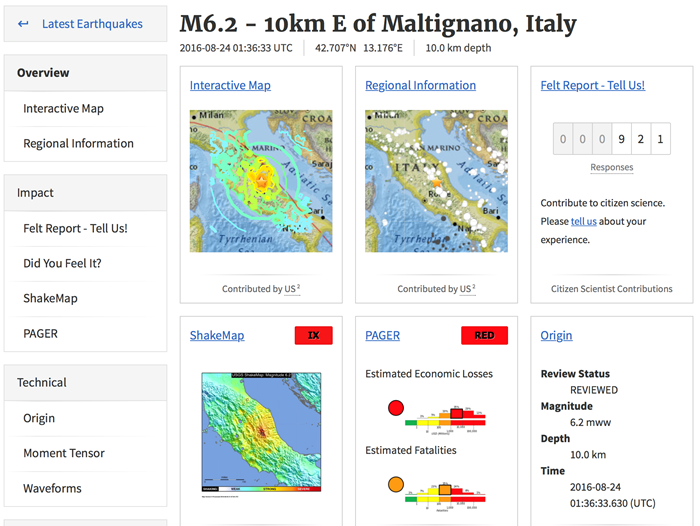
One publicly available resource is provided by the USGS in the form of their Prompt Assessment of Global Earthquakes for Response (PAGER [12]) system. PAGER provides rapid reporting on the potential impacts of recent earthquakes on human life and structures in easy-to-consume reports and maps.
Note
You may want to refer back to some of these resources (and find others!) as potential sources of data for your term project and the case study assignments coming later in this course.
Towards Situation Awareness
A rapidly growing part of preparedness is the development of geospatial tools, data analytics, and visualizations that can be put into place ahead of a disaster. This includes making sure existing datasets, like roads and other infrastructure, demographics, and critical facilities are ready to use. Increasingly, these efforts involve the use of real-time or near real-time information from data feeds including Internet of Things (IoT) devices, reports from field crews, streaming model outputs, and others. We will focus on this in greater detail in Lesson 5 and again later when we consider the emerging technology of IoT. This diverse range of information is often summarized using maps and emergency management dashboards. Below, we'll consider some interesting examples of these trends.
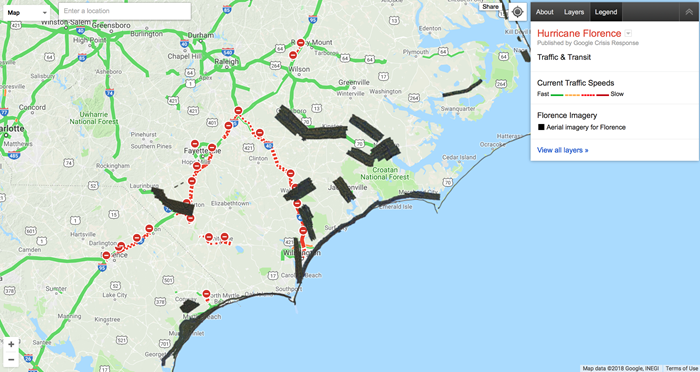
Let's start with something very familiar, Google Maps! While many sophisticated methods for modeling disaster impacts aren't yet publicly available in web tools, there are in fact a very large range of options for free platforms used to evaluate and monitor a situation in progress. The Pacific Disaster Center's Global Hazards Atlas [14], introduced on the previous page, is one such system. Google Crisis Response [15], also mentioned earlier, is another example and is more readily available and usable by the responders and the general public alike.
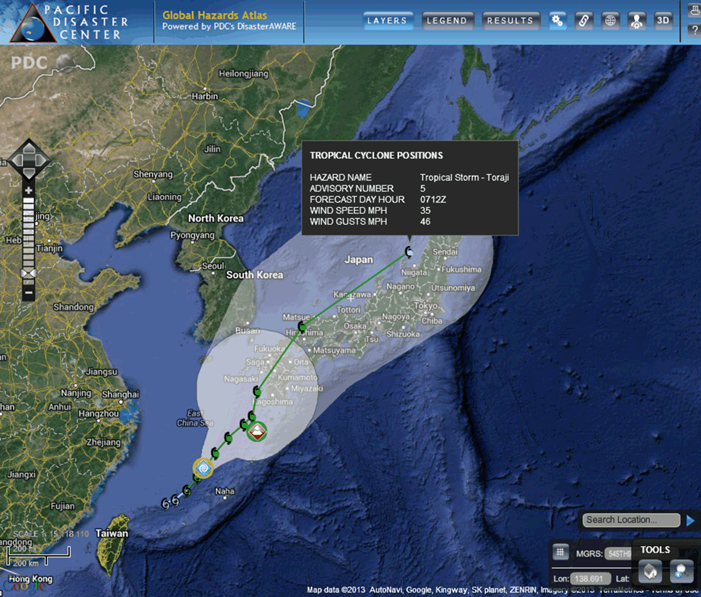
This next example is from the PDC Global Hazard Atlas and shows the position and projected path of a tropical cyclone bearing down on Japan. Note that as with the Google map, there are a lot of other layers that can be examined to gauge likely impact and help make decisions about where resources might need to be pre-positioned. Another way this data can be used is for future planning and mapping of disaster prone areas (think back to the FEMA Southern California Earthquake example). Finally, and you will see this more in the following video, these maps can help emergency managers evaluate the potential for disasters to interact. For example, some areas may be vulnerable to a cyclone and may also have a critical facility like a power station. GIS 101 but very powerful nonetheless.
Finally, check out the impressive Nationwide Operational Assessment of Hazards (NOAH) program from the Philippines [16]. This is a good example of the trend toward multi-hazard approaches to emergency management, rather than focusing on a single hazard type. This site has a lot of functionality including the ability to map the likely impact of different hazards based on historical data. After viewing this short video, take some time to click on a few of the buttons and see what you can learn. For example, display volcano hazards alongside critical facilities to see if there are places particularly at risk.
Video: How Project NOAH helped avert potential disasters (2:14 minutes)
The Habagat 2012. One month after the launch of project NOAH, there was a warning about the imminent floods that was going to happen. The warning was provided at 2 a.m. in the morning. The warning was three hours in advance of the peak floods, and when the floods came in the people were already out of harm's way.
I think this kind of system is already being viewed as best practice in the world. Because I don't know of many other countries that have this kind of system that make use of sensors deployed all over the Philippines. All 1,500 of them streaming data every 15 minutes, and the top achievements that I can think of are these three.
The first is that we were able to map out the hazards of the country in very high resolution. These are the flood hazard maps. The storm surge hazard map is already complete for the entire Philippines for different scenarios. The landslide maps are also complete, and they're very high-detailed.
The second one is NOAH helped in raising awareness trying to change the mindset of the Filipino people. And, moreover, we were able to empower the Filipinos with a lot of information regarding weather events and its hazards impacts.
The third is, I think which is the most important, is that the instruction was delivered. The instruction was to create a program to warn the people hours in advance. And because of the methods that were used in NOAH over the past four years wherein we complemented the forecast with near real-time information for data, we were able to avert at least 13 extreme hazard events.
For further information
For more on NOAH, have a look at this journal article: Disseminating near-real-time hazards information and flood maps in the Philippines through Web-GIS [17]. This link takes you to the abstract. To see the entire document, see e-Reserves under Library Resources in Canvas.
Reading Assignment and Live Discussion
The readings this week continue our focus on preparedness. You will read a chapter in your textbook that covers some of the broader issues around GIS and disaster preparedness, continuing some of the themes we've been covering. Next, you will consider a journal article that takes a (very) deep dive into emergency building evacuation modeling. This paper is challenging but has a lot of useful information even if the technical bits are too much!
I like to remind students that, as you read, it is important to read critically and not necessarily accept what you read at face value, even if it appears in a peer-reviewed journal. Many of the course assignments are aimed at helping you build the skills to assess published reports on geospatial technology objectively and critically. There are multiple perspectives from which to critically assess what you read. No papers can cover all issues and no author is all-knowing; thus, it is likely that you know something relevant that the author does not (or that he/she did not consider relevant, but that is relevant from your perspective). Methods of data processing and analysis that might be acceptable in one discipline may be at odds with established methods in another discipline, so you will find disagreement among authors about what methods are “right.” People make mistakes (in their original conceptualization of a problem, in carrying out work, and in interpreting the results) – and your practical experience and/or solid grounding in geospatial analysis may give you special insight to identify these mistakes. In many cases, the authors may have limited practical knowledge, thus, they may completely ignore issues that are critical in a real world context.
1. READ
From "GIS for Disaster Management": Chapter 6 - "Geographic Information Systems and Disaster Planning and Preparedness". See Library Resources in Canvas for the electronic version.
These chapters focuses on the various ways preparation can be characterized in the context of GIS, as well as some of the key methods by which geospatial tools can be used to support near-term preparation when we know a disaster is about to strike.
Think about
What are some of the specific ways in which preparedness is different from mitigation? You might consider this from the perspective presented by text author or (more interestingly) from the perspective of a GIS manager in a state Emergency Operations Center, from the perspective of a local regional government deciding whether to invest in GIS, or from the point of view of a citizen who expects service from their government. How might GIS activities to support preparedness differ for different kinds of emergencies – what are examples of different kinds of emergencies in which preparedness activities would differ?
2. READ
Bo Li and Ali Mostafavi 2022. Location intelligence reveals the extent, timing, and spatial variation of hurricane preparedness [18]. Scientific Reports 12:16121. (PDF version [19])
This paper examines preparedness for hurricanes based on geospatial data and anlaysis
Respond
Are there other data and technologies that could be brought to bear on the problem of disaster prepartedness? How might the authors’ work be applied in other emergency situations e.g., fire, flood? Note, you will provide a written critique of this article following on the live discussion - details to follow!
Deliverable
- This week, you will be participating in a "live discussion" with some of your classmates and me! So, no written posts are required! The meeting will last one hour.
- We will focus on the Lochhead and Hedley paper, so come to the discussion with any points or questions you would like to raise.
- I will send out a Doodle poll so we can fined some times that will work for everyone. We will meet in small(ish) groups so everyone can participate.
- Note: You will also do a short writing assignment that will critique this article as well. This will give you a chance to reflect on what comes out of the live discussion.
Grading Criteria
This discussion will be graded out of 15 points - pretty easy this week! Just show up and share your thoughts.
Emerging Theme: Spatial Data Science
For this week’s Emerging Theme topic, we are going to take a step back from emergency management and focus on spatial data science (SDS) in general. I want to emphasize that SDS (and terms like Big Data or Machine Learning) can mean several different things.
On the one hand, it is how we talk about GIS and geospatial science in the age of large data sets (e.g., imagery and otherwise), enhanced computing power, and networked data and services. A lot of traditional GIS workflows are described in (spatial) data science terms. For example, variants of regression analysis and hotspot analysis are referred to as machine learning and cluster detection, respectively. This is all fine, but SDS is also the integration of big data, high performance computing, and programming of machine learning/AI algorithms to conduct analysis in some fundamentally different ways from traditional GIS/geospatial analysis. You will explore and discuss some this complexity in this Emerging Theme Discussion.
To set the stage, I'd like you to have a look at few perspectives on spatial data science, and where it is heading, from two geospatial industry leaders, Esri [20] and Carto [21], and university researchers at the Center for Spatial Data Science [22] at the University of Chicago.
What is Spatial Data Science?
What is Spatial Data Science (6:08)
When considering SDS as a set of activities, we can identify several interrelated parts. These are listed here with some examples of common associated tasks (not exhaustive):
- Data ingestion, cleaning and management
- Obtain data, formatting, cleaning, and management in database system
- Exploratory data analysis
- Statistical methods for data reduction, data visualization
- Data enrichment
- Data linkage, spatially enabling data, calculate new variables
- Spatial analysis
- Mapping, hot spot analysis, space-time analysis, overlays and spatial queries
- Machine Learning
- Cluster analysis, regression, predictive analytic, object recognition
- Big Data Analytics
- Big data, (near) real-time
- Visualization and Communication
- Maps, graphics, interactive, web, Tableau/Qlik/BA
Visit Carto's Technology Stack Overview [23] page to see a similar list. Take note of the Data ingestion and Management & Analysis steps. Are you familiar with the technologies listed there? Pick a couple e.g., PostGIS, Python SDK, ELT, PostgresSQL that you are not familiar with and look them up. Gaining a general familiarity with the various parts of SDS is a good first step.
Finally, Carto have produced a useful free e-book on Becoming a Spatial Data Scientist (download the PDF here [24]). Read the first chapter and have quick look at the rest of the book. This may be a good resource for you going forward as it lists many of the tools you can use for analytics projects.
You are probably aware that the dominant player in the GIS space is Esri [25], the developer of ArcGIS Pro amongst many other offerings. In addition to desktop software, they offer server and cloud based services that allow for big data analytics at scale.
Visit the Esri Spatial Analysis and Data Science [26] page. Note the components of SDS they outline and a few of the tools on offer. I'd like you to take a closer Machine Learning and AI & Big Data Analytics.
Machine Learning and AI
Artificial Intelligence is a somewhat generic term for a class of techniques including machine learning and deep learning. On a basic level, AI is all about developing algorithms that can "learn", or can be "trained", to recognize patterns in datasets and then predict likely behavior. For example, algorithms have been written to identify and differentiate sharks from swimmers in real-time UAV camera feeds over beaches in Australia. Post hurricane damage assessment is also commonly done by AI these days, often with the help of volunteers training the algorithms e.g., looking at single buildings and decided on a damage class.
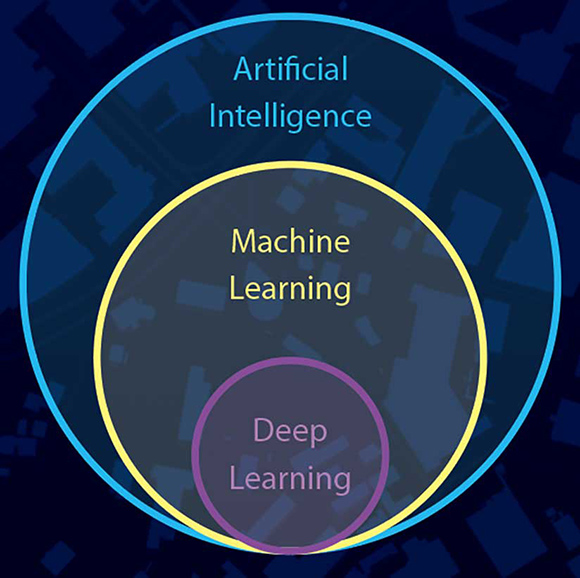
Artificial intelligence, machine learning and deep learning. Source: Esri
Read this short article on Machine Learning in ArcGIS [27] by Esri Spatial Analyst Lauren Bennent. What are some of the key issues she cites about using ML and GIS? What stands out as being different from what you can do with Desktop GIS alone? Do you think you can get started with ML using ArcGIS Pro? What constraints might you run up against?
Big data analytics
One way SDS is different from traditional GIS workflows is the ability to deal with large volumes of data including collection and cleaning, storage, analysis and visualization. Analysis of real-time (or near real-time) data is a rapidly growing area for geospatial science and emergency management applications in particular. Have a look at the following video and website [28] to see a geo-analytics workflow using Esri.
Real-Time GIS and Analytics (5:42)
Center for Spatial Data Science
The geospatial industry are making great advances in SDS and delivering data and tools to a wide audience, however research groups at universities have been at the cutting edge of developments in (spatial) data science for many years. This includes work in computer science, high performance computing, mathematics, statistics, geography, human-computer interaction, amongst others.
One research group that has been very influential across these areas is Professor Luc Anselin's Center for Spatial Data Science [29] at the University of Chicago. Have a look at a few of the research projects this center has undertaken in recent years. What similarities or differences do you see compared to the problems described in the Carto or Esri sites, or that you have usually thought about in the context of GIS problems?
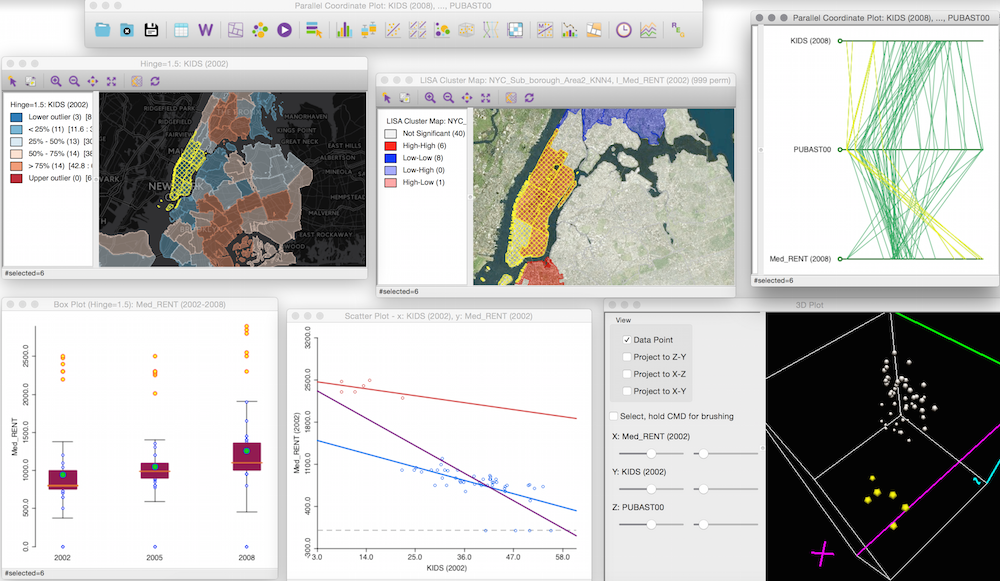
Screenshot of multiple linked displays from analysis with GeoDA
One of this group's most widely used products is the GeoDA software. [30] This program has a lot of basic GIS functionality but is also loaded with easy to use advanced spatial analysis tools. This is a desktop application, but many of the tools can be used by coding with Python and R, thus making the tools scalable with data and hardware needs.
Look at the GeoDA [31] pages and also visit their github site [32] which hosts software and training materials. Be sure to scroll down this page to view the desktop spatial analysis program GeoDA. As mentioned, they are also actively developing R libraries. Why would they focus on both?
Note that you can download and use GeoDA for free (and it works on multiple platforms). It might be worth considering as part of your projects?
Data Science Computing
As mentioned previously, SDS goes beyond desktop GIS and requires the use of a range of computing resources and programming tools to manage different analysis steps.
What about the hardware required for Spatial Data Science. In many ways it is all about scalability. You may be able to accomplish many tasks with desktop software like ArcGIS Pro, but for bigger and more complex analysis you may need to rely on enterprise solutions or high performance computing.

NVIDIA A100 Tensor Core GPU (Source: NVIDIA)
Have a very quick look at this fact sheet for the NVIDIA A100 Tensor Core GPU [33]. This type of hardware is designed for for AI, data analytics and high performance computing in server/cloud applications.
Hardware like this is used in distributed computing where tasks to be split up and conquered by a stack or cluster of processors. The figure below is from the Riga Technical University [34] and shows how a central computer (head node) is orchestrates analysis jobs undertaken by computing nodes.
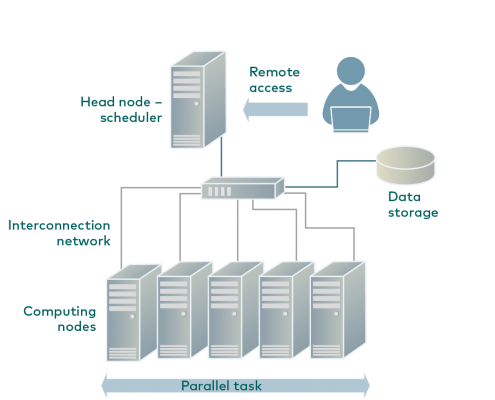
Distributed computing example (Source: Riga Technical University [34])
Distributed computing is controlled by software systems such as Hadoop [35]. Here is a description from the developers website of what Hadoop does:
The Apache™ Hadoop® project develops open-source software for reliable, scalable, distributed computing.
The Apache Hadoop software library is a framework that allows for the distributed processing of large data sets across clusters of computers using simple programming models. It is designed to scale up from single servers to thousands of machines, each offering local computation and storage. Rather than rely on hardware to deliver high-availability, the library itself is designed to detect and handle failures at the application layer, so delivering a highly-available service on top of a cluster of computers, each of which may be prone to failures. - Source Hadoop [35]
Data Science Software and Programming
I'd like to end this section by showing you a useful diagram produced by Carto (again!). It is meant to show the relationships amongst data science tools and geospatial analysis.
Python and R are the main languages used for data manipulation and analysis in much of SDS. The two languages overlap in functionalist but also offer different capabilities (R is good for some things / Python excels at others). This highlights that you need to be somewhat pragmatic and use whatever tool will work best. The tools hanging off the R and Python circles refer to specific packages e.g., ArcPy is the site package used by Esri for accessing ArcGIS functionality. SQL is the main language for querying and managing databases. Finally, the platforms area refers to the many ways you can interact with the data and run analyses. Are you familiar with any of these? The Carto book recommended above provides some practical help on how to set some of these up for your own analysis.
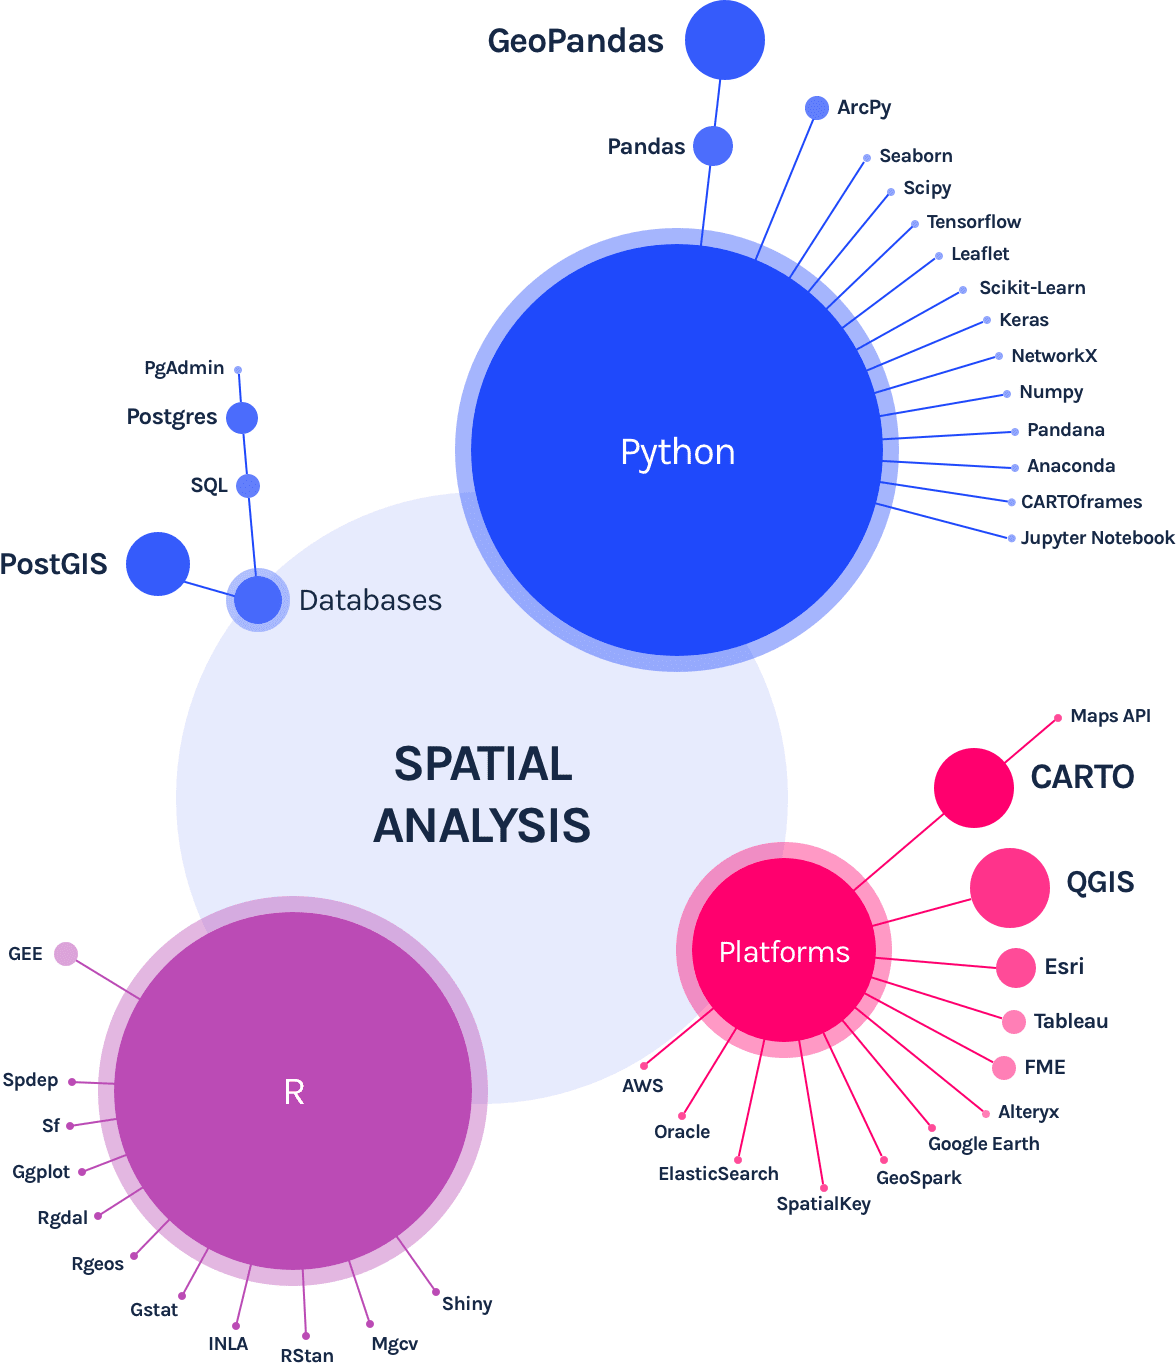
Data Science tools for spatial analysis (Source: Carto - What is Spatial Data Science? [36])
Additional Resources
We will come back to the topics of GeoAI and real-time analytics later in the course, but in the meantime Esri and Carto offer many free resources on SDS (some listed above) and this includes free seminars and training materials. Have a look at this page listing current resources and upcoming events - Spatial Data Science Events, Videos, Webinars and Courses [37].
The growing interest in spatial data science has spawned several conferences that bring together scientists and analysts in the public and private sectors. I encourage you to take a look at the Spatial Data Science Conference website [38]. You can register and attend online for free this year.
Deliverable
- Post a comment in the Emerging Theme Discussion (L4) forum that describes similarities and differences between traditional desktop GIS and Spatial Data Science. How you think spatial data science is changing or will change crisis and emergency management approaches?
- Provide a link and short description to a VGI effort ‘in the news’ or that you have otherwise come across.
- NOTE: Respond to this assignment in the Emerging Theme Discussion (L4) forum by the date indicated on the course calendar.
Grading Criteria
This discussion will be graded out of 15 points.
Please see the Discussion Expectations and Grading page under the Orientation and Course Resources module for details.
Term Project - Create an Outline
This week, you need to compile and submit an outline for your term project paper. By now, you've received my feedback on your project abstract, and you had time last week to collect some background information.
Outline Description
A good outline will help you complete your term project as efficiently as possible. I like working with an outline, because then I know the gaps that I need to fill. It's also an excellent way of narrowing what your paper will cover given a specific word count constraint.
Your outline should include:
- major sections and subsections of your paper;
- organized sections in a logical flow that guide the reader from start to finish;
- some details about the dataset and analysis you plan to use including where you plan to source data if you haven’t already (now is a good time for me to help out if you are having any problems).
The outline should reflect the limitations you have on word count (no more than 3000 words) for the final product (you won't be able to have dozens of sections covering every possible topic).
I like to add short statements for the key ideas I will cover in each subsection; that way I know exactly what I must cover to complete the paper, but I'll leave it up to you to decide how much detail your outline includes beyond section and subsection headings.
For your term project, you must include the sections/headings provided in the table below. These are the major items I will be looking for. You can create subheadings as you see fit.
| Section | Description |
| Introduction | The introduction meaningfully engages the target audience/reader and clearly presents the central argument along with its substantive, technical and applied contexts. |
| Background and Supporting Research | The paper is well researched and contains references to peer-reviewed articles, government documents and industry reports that relate to the arguments in a logical manner. References are correctly cited. |
| Analysis and Interpretations |
The design and implementation of a methodology was appropriately used to address the central arguments of your topic. Critical, relevant and consistent connections are made between evidence and central arguments. Includes appropriate use of maps, graphics, and tables. Analytical insights are sound and show a deep understanding of the issues. Depending on your selected topic, this may involve describing the steps taken for data analysis and mapping (NOTE –step by step instructions can be put into an appendix and will not count against word limits – disc |
| Conclusion |
Excellent summary of topic and central arguments with concluding statements that impacts the target audience/reader. |
The content of this announcement will not be visible to users until Mar 8 at 0:00
Submission Instructions
Submit your assignment as a word document or PDF to the Term Project: Outline dropbox in Canvas.
Save your files in the following format: L4_tp_firstinitialLastName.doc.
See our Canvas Course Calendar for specific due dates.
Grading Criteria
The goal of this exercise is to pave the way for you to write an exemplary term project; therefore, each section will be graded on a satisfactory (1 point)/unsatisfactory (0 points) basis. You need to address the following criteria:
- a title is present that reflects the focus of the project,
- clear headings and subheadings are present for each paragraph,
- appropriate and high-quality datasets for your project have been identified,
- a plan for locating and acquiring the data has been determined (and instructor consulted if having problems),
- a clear and detailed plan for analyzing the data has been given.
The outline is worth 5% of your total course grade and will be graded out of 45 points.
Project Proposal Presentation
The ability to synthesize technical information into a concise package that is appropriate for a broad audience is a skill that is hard to hone and yet highly sought after in the workplace. This assignment provides you an opportunity to do just that. I would like you to create a short (5 - 7 minute) recorded presentation about your term project proposal. The presentation will be shared with your classmates.
Guidelines for your video
- Must be no longer than 5-7 minutes (no exceptions!).
- Outline the topic you chose, brief background, and key contributions of your work.
- Create a slide presentation that includes key points, graphics, photos, etc. to explain the project.
- Avoid lots of text (and reading your slides) if you can make the same points with a graphic. You want the audience to focus on what you are saying and not on reading the slide!
- Do not go into extreme detail in five minutes - the idea here is to provide a quick teaser of your work that will entice someone to read your final report.
- Be creative!
Make Your Video
- You may choose your own screen recording software, or record your screencast from within Canvas. Here is a link to instructions (Links to an external site.) [39] on how to use Kaltura Capture to record within Canvas. Note: Kaltura Capture is accessed in Canvas by clicking on My Media in the Canvas menu and "Add new". If you do not use Kaltura Capture, you will need to upload your own video file to My Media using these instructions (Links to an external site.) [40].
- Record your screen while you give your five to seven-minute slideshow (make sure the slides are visible and the audio is clear - using a headset microphone is normally the best way to ensure decent audio quality).
- Need more help? Contact the World Campus Helpdesk [41] for assistance.
- Make sure that you have added your screencast video to My Media in Canvas.
Add Your Video to the Media Gallery
You're almost done! The last step is to add your video to our Term Project Presentation gallery so everyone can see!
1. Click the Media Gallery link in the course navigation on the left side of the page.
2. Click the + Add Media button in the upper right of the page.
3. Select the video you would like to add by checking the checkbox to the left of the video.
4. Click Publish in the upper right of the page.
5. Let me know you've uploaded your video, and I'll approve it for the Media Gallery.
NOTE: The video will not appear in the Media Gallery until I approve it.
Review your peers' presentations
Go to the Media Gallery in Canvas and view your peers' presentations. Please provide comments and feedback to your peers.
Deliverables
- Share your video in the Media Gallery.
Writing Assignment
The chapter from your book is matched with a journal paper that focused on GIS for emergency management situations that include preparedness components. Your written deliverable for this week’s lesson (beyond what you wrote for the class participation section) is to produce a brief (no more than 400 words) critical assessment of the paper by Lochhead and Hedley. The critical assessment should begin with a one-two sentence summary of the authors’ goals in the project reported. Then, in 2-4 paragraphs, discuss the strengths and weaknesses of the work reported. Consider the following issues:
- the most important contribution that the paper makes to understanding the role of geospatial data and approaches in emergency management (what do we know now that we did not know before this work?);
- critical aspects of the methods applied and/or decisions made about those methods that make the work something that others should emulate (e.g., things that they considered that, if they had been ignored, would make the conclusions unreliable or invalid);
- flaws that you see in the work reported (these might be in methods developed, in the way they were applied, or in the interpretations that the authors make about the applicability of their results).
Submission Instructions
Please name your document using the following as an example: L4_assign1_firstinitialLastName.doc
Submit your assignment to the Lesson 4 Writing Assignment (L4) Dropbox. See the Course Calendar for specific due dates.
Grading Criteria
For this assignment, I will assign grades with the following rubric. It is worth 4% of your total course grade and will be graded out of 20 points.
| Criteria | Description | Possible Points |
|---|---|---|
| Content and Impact | You make strong and logical arguments and provide analytical insights. Ideas are well organized, clearly communicated and relevant to the prompt. All criteria are accurately addressed. Supporting details are shared, elaborated upon and demonstrate understanding. Examples are provided, and your post includes images or other multimedia that support content. | 15 |
| Clarity and Mechanics | Evidence of editing and proofreading are evident. Writing is engaging and well-structured with excellent transitions between sentences and paragraphs. Concepts are integrated in an original manner. | 5 |
Summary and Final Tasks
Summary
This week, we focused on how GIS can be used to prepare for a disaster. Different disasters present different types of opportunities for preparation - some, like terror attacks or earthquakes, provide little or no warning time at all. Others, like hurricanes or other severe storms, may offer a window of opportunity where geospatial data and tools can be used to coordinate evacuations and other types of preparation efforts (sandbagging levees, for example).
One way to prepare for disasters that offer little or no warning is to develop spatial computational models of disaster impacts and use a GIS to run simulations of hypothetical emergency situations. In this lesson, we looked at how the USGS uses PAGER to quickly estimate damage from earthquakes. When planning a geospatial system for emergency management, it may be very useful to allocate time and resources toward disaster modeling efforts to simulate situations that present very little advanced warning.
In the next lesson, we will shift our attention to the response phase of emergency management. In the time immediately following a disaster, GIS and other geospatial technologies will be called upon to develop a situational picture and to allocate first responder resources. In Lesson 5, we will delve into a wide variety of challenges that are associated with disaster response.
Reminder - Complete all of the Lesson 4 tasks!
You have reached the end of Lesson 4! Double-check the to-do list on the Lesson 4 Overview page to make sure you have completed all of the activities listed there before you begin Lesson 5.
Questions?
If you have any questions, please post to the Canvas Discussion Forum called "General Questions" or email the instructor via Canvas conversations (if the question is personal in nature).