Lesson 5: Response
Overview & Checklist

In this lesson, we will focus on how geospatial perspectives and technology are used in response to emergency situations. Geospatial analysis has tremendous potential for aiding disaster response, but as you will learn, it is not easy to quickly translate geospatial data into actionable information when lives are at stake. Responders need to know where to go and how to get there, and emergency managers need to understand and react to a changing situational picture.
CC BY-NC-SA 4.0 [2]
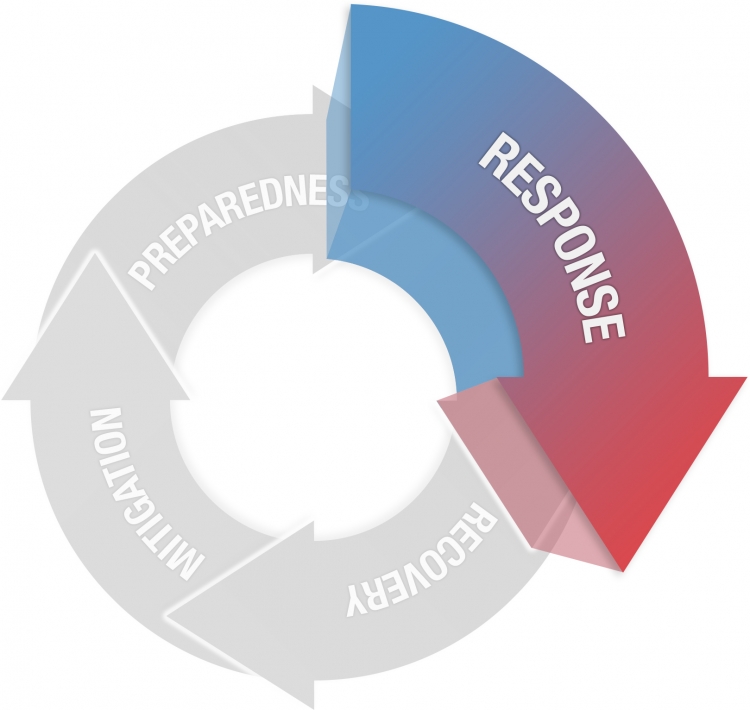
Response
Actions taken immediately before, during and after an event to alleviate suffering and prepare for recovery
- Establish Situational Awareness
- Evacuations and Shelters
- Respond to remaining hazard
- Search and Rescue
- Mass Care
- Logistics response
- Initiate Recovery
What You Will Learn
By the successful completion of this lesson, you should be able to:
- identify the roles that geospatial approaches and technologies can play in disaster response;
- discuss some of the issues that geospatial analysis systems must overcome in response situations with your colleagues;
- understand the implications of real-time mapping and spatial analytics;
- create real-time mapping and spatial analytics dashboards.
What You Will Do
Lesson 5 is one week in length. To finish this lesson, you must complete the activities listed below.
| To Read |
|
|---|---|
| To Do |
|
Please refer to the Course Calendar for specific due dates.
Questions?
If you have questions about the content or lesson activities, please post them to the General Questions and Discussion forum in Canvas. While you are there, feel free to post your own responses if you, too, are able to help a classmate. If your question is of a personal nature, please email me directly through Canvas.
The Role of Geospatial Analysis in Disaster Response
When Disaster Strikes, What's Next?
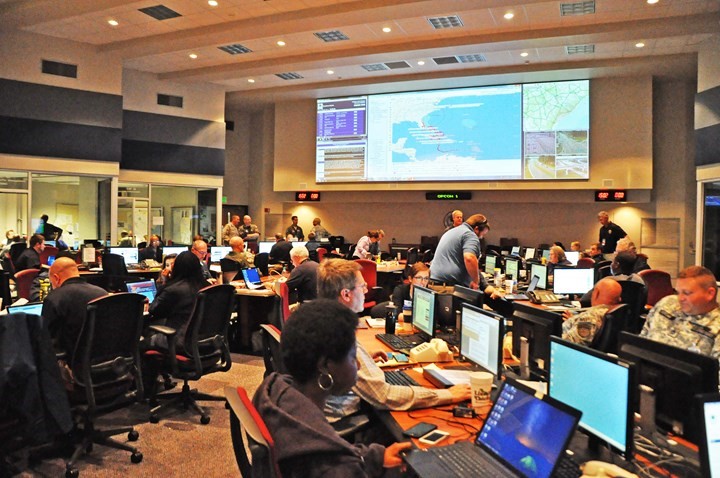
In the wake of a serious disaster, geospatial analysts along with other emergency managers are expected to provide a wide array of information with short deadlines for a variety of important tasks. First, it is essential for everyone involved to have a clear sense of the current situation (situation awareness) and to receive updates on the situational picture as time progresses. This can be a serious challenge because often a disaster can impact the types of data that are available. Also, consider the extreme case of the EOC for New York on 9/11 which was located at 7 World Trade Center, and its state-of-the-art equipment and data were destroyed as a result of the attacks.
For Further Reading - Optional
You can read more here on how GIS resources were developed on an ad hoc basis during the 9/11 crisis [4]. It is interesting to contrast these activities with what is possible now, over 20 years later! In particular, think about the crowdsourcing and crisis mapping efforts you read about in the Digital Humanitarians chapters.
Any geospatial plan for responding to an emergency or crisis should consider several key questions:
- Are there backup sources for equipment and data?
- Is there an alternate site where personnel can gather in the event that the primary EOC is taken out by the disaster?
- What are the basic geospatial-dependent products you must be able to provide to support fundamental response efforts?
- What are the plans for dealing with power and communication (Internet) outages, especially when current and emerging geospatial applications are dependent on these?
Even contemporary web-based geospatial systems present possible challenges in a real crisis situation. While cloud-hosted solutions can help avoid the risks associated with data storage in a single EOC, many disasters make Internet access difficult or impossible. We will consider this issue in more detail later.
Who Needs Help, And Where is the Help?
The most pressing need facing geospatial managers during the immediate aftermath of a disaster is to estimate the impact of the disaster on the local population to determine where first responders should focus their rescue efforts. This problem requires an awareness of the scale and scope of the disaster as well as the ability to know where response resources are located, what their capabilities are, and what routes are available for them to take to those who need their help.
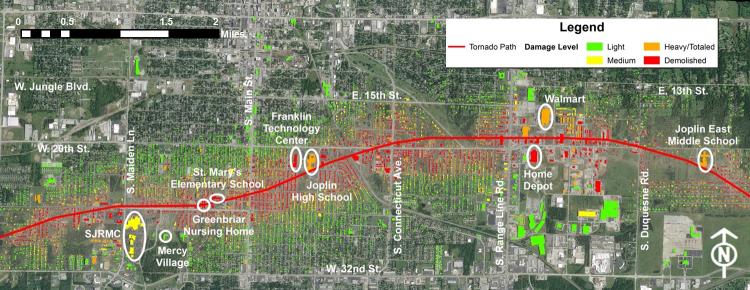
As an example, consider the May 22, 2011 tornado that went through Joplin, Missouri. The map above shows locations of key facilities and estimated building damage levels. Developing an understanding of the scope of damage during and immediately following an event is a key goal for geospatial analysis. Spatial data on the location and functions of key facilities can be developed as part of mitigation and preparedness.
Later in this lesson, we will consider these issues in greater detail when we look at (near) real-time mapping and spatial analytics. The data and tools to support emergency management are changing rapidly and are much more advanced than they were just a few years ago.
On the next page, you'll find your reading assignment for this week, where we'll delve deeper into how GIS and other spatial tools are used during response activities, including a focus on the limitations of GIS systems in response situations.
Reading Assignment
The readings for this week focus on the fourth component of emergency management, response. You will read an overview chapter from your textbook, review a situation awareness briefing from FEMA during Hurricane Maria, and a book chapter on emergency management communications technology.
1. READ
"GIS for Disaster Management" - Chapter 7 - "Disaster Management and Geographic Information Systems"
Previous readings have focused on how GIS can be used to avoid disasters, mitigate the consequences of events that may happen in the future, and prepare (in those cases where there is warning) for a disastrous event that is likely to happen (e.g., a hurricane that exists and has a predicted track and severity). These chapters focuses on how GIS can help in situations where an emergency/crisis is unfolding and shows how a well-reasoned, timely response can make a difference in the consequences of a disaster. Have a look at the entire chapter but focus on pages 192 - 203 – Geographical Aspects of Situational Awareness.
RESPOND
What are the key inter-agency coordination issues that should be considered to make a GIS-based response effort successful? How might recent advances in location-based services change the ways in which emergency management professionals and the public interact through geospatial information and technologies to respond to a disaster?
2. REVIEW
Situation awareness described in FEMA Geospatial Coordination Updates on two days during Hurricane Maria. The PDF's are located in Module 5 of Canvas.
These slide decks supported one of the daily coordination briefings that FEMA ran in the days up to and following Hurricane Maria. They provide a nice summary of what different FEMA teams and allied agencies are doing. It is meant to provide an overall summary of the current situation. Contrast these "hard copy" products with newer web based tools in the FEMA Geospatial Resource Center. [10]
RESPOND
Take note of the range of information and resources contributing to situation awareness for this event. Does anything seem to be missing? How well do you think the work of this group may support other parts of the emergency response e.g., search and rescue teams?
3. READ
Norris, C. 2018. Chapter 2 - Computer Networks and Emergency Management from Technology and Emergency Management found in Module 5 of Canvas.
Finally, I’d like you to think a bit more about communication systems during disasters. This book chapter provides some interesting, albeit a bit basic, information on communication systems and then describes some of the ways they are impacted by disasters and how they can be restored during a disaster. It is good background given how much geospatial technologies depend on reliable ICT.
You might also be interested in this late 2017 news article on What Happens to the Internet After a Disaster? [11]
THINK
What are some of the specific geospatial challenges to communication and IT systems disruptions during emergencies? Does this make geospatial approaches vulnerable and potentially ineffective? Are there new ways for restoring these resources in a hurry?
Deliverable
- Post a comment in the Reading Discussion (L5) forum that addresses the RESPOND prompt above during the first 5 days of the lesson.
- Then, I'd like you to offer additional insights, critiques, a counter-example, or something else constructive in response to your colleagues on two of the following 5 days.
- Brownie points for linking to other technology demos, pictures, blog posts, etc., that you've found to enrich your posts.
NOTE: Respond to this assignment in the Reading Discussion (L5) forum by the date indicated on the course calendar.
Grading Criteria
This discussion will be graded out of 15 points.
Please see the Discussion Expectations and Grading page under the Orientation and Course Resources module for details.
Emerging Theme: Real-time Mapping and Spatial Analytics
Overview
This week’s emerging theme focuses on the topic of looking at disasters and maintaining situation awareness in (near) real time. To complete this section, you will need to:
- review a short video and reading to get you started;
- use ArcGIS Online to create your own emergency response dashboard;
- identify and add live data feeds to your dashboard;
- conduct analysis to develop situation awareness that can be used to target response resources; and
- write a short report summarizing your work and findings.
Real-Time Mapping and Spatial Analytics
For this exercise, we are going to focus primarily on the Solutions for Emergency Management [12] apps that have been developed by Esri and are based on their suite of ArcGIS technologies, especially cloud and web-based GIS services. Also, see Esri’s Disaster Response Program [13] website for the help the company offers during emergencies. There are other systems out there, some that leverage major industry platforms and some that are developed in-house from open-source software (e.g., recall InaSAFE [14], PDC [15], and even Google Crisis Response [16]).
Regardless of the system being used, they have similar goals such as providing:
- base maps and other datasets that can be prepared beforehand and deployed during an event, e.g., road networks, building footprints;
- infrastructure for communicating with a range of stakeholders from local first responders, EOCs, specialists working at a distance, and the general public;
- a means to upload data, including real-time, from the field and other sources;
- rapid analysis and then uploading and sharing derived products, e.g., spatial data analytics, rapid image processing for damage assessment; and
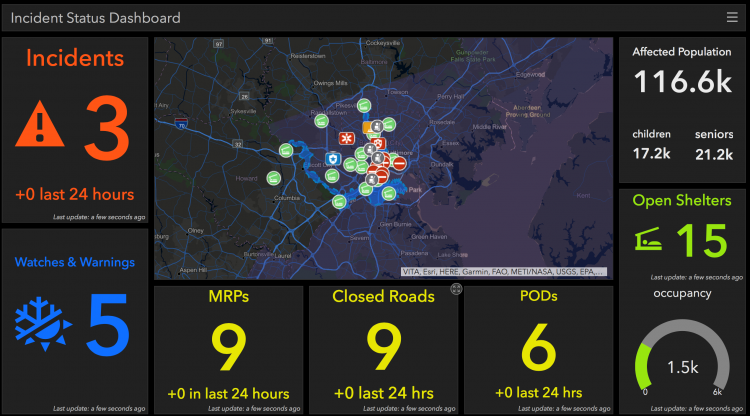
- visualize diverse datasets in an easy to update and understandable format, e.g., multiple map displays on a dashboard with other charts, figures, and video feeds.
Before developing your own situation awareness app, have a look at the two videos and the optional reading below. The first (short) video is an overview of a case study where these approaches are used by the California Office of Emergency Services (Cal OES). The second (longer) video provides more detailed examples about incorporating live data feeds into a situational awareness app and dashboard using Esri tools. These concepts are further discussed in the optional reading from The ArcGIS Book.
ArcGIS Online Case Study: Emergency Management – Cal OES (3:54 minutes)
[BEEPING]
DAN BOUT: My name is Dan Bout. And I serve as the assistant director for response at the California Governor's Office of Emergency Services. Cal OES is responsible for all disasters that occur in California that exceed the locals' abilities to respond to them. Far and away, the biggest challenge we have as it relates to data in an incident is synthesizing data into information that's useful. So there's a huge potential for miscommunication. And as you get more and more data feeds, that becomes a more and more salient issue.
[FIRE ENGINE SIRENS SOUNDING]
PRESENTER 1: Here is the latest on the breaking news we're following out of northern California. A strong earthquake rocked--
PRESENTER 2: Parts of Napa got hit hard, hammered by this quake early this morning. One example--
JOSE LARA: The Napa earthquake truly showed us the power of visualizing information. The ability that we had at that time to create flat maps in a not-so-speedy way showed a gap that we had in our ability to really visualize the information, get it out in a fast manner.
CHI SMITH: The people on the ground, they need the tools so that problems can be solved during activation, so resources could be deployed timely and effectively.
JOSE LARA: So during the Napa earthquake, the decision was made to bring Esri into-- show us what is possible, what capabilities they have.
DAN BOUT: That was actually, I think, probably one of those key-use cases for moving to a digital map. The ability to start seeing water leaks in real time and like, OK, when did that happen? Three minutes ago. That is something that you couldn't do with a paper map.
JOSE LARA: We went from, at best, 5% of online products to 95%. And that actually happened in about, say, six or nine months of the Napa earthquake.
DUANE VALENZUELA: Now you have all the current data that's available. And it may change as you're looking at it. And it's real time. You're looking at what's happening now, not what happened 12 hours ago.
JOSE LARA: What they showed us that day during the Napa earthquake was a story. It's interactive. It allows us to take a look at the shape map, take a look at the shelters, take a look at whatever information that we're discussing. This allows us to be able to really give decision makers what they need.
CHI SMITH: GIS changed the way we do business. We now have the go-to products. We know that this is what we need to do as a requirement. So that would be part of our common operational picture.
DUANE VALENZUELA: During the fires was the first time we really use the dashboards this year. And we were able provide a visual of acreage burn, current damage assessments. The dashboard provides that snapshot that saves time. Instead of somebody stopping in the middle of an operation to brief someone, they can just walk in and look at the wall and see exactly what they want to see.
DAN BOUT: One of the areas that I think we're deliberately going to move to is taking a tool like our GIS mapping capability and using that as a mitigation tool.
JOSE LARA: Where I see us going is to get hooked up to every single county statewide, so when an event happens, we flip the switch on and absorb their data. And then I can just visualize.
DAN BOUT: The bottom line in emergency management is we are going to be successful. There's not a lot of trying involved. You have to make it work because it's-- it's people's lives. It's families. It's their property. I mean, it's the things that are most core to our identity and to who we see ourselves as, as a nation.
CHI SMITH: The technology is there. And we know that it's available. And we've leveraged to the best of our abilities. It's my dream come true. I mean, it's great.
[MUSIC PLAYING]
Leveraging Live Feeds for Situational Awareness (55:39 minutes)
I know this is a long video. If you don't have time to watch the entire video, please have a look at the first 10-15 minutes or so.
Optional Reading
Chapter 9: Mapping The Internet Of Things [18] from The ArcGIS Book
As a companion to the two videos, you might want to have a look at this book chapter from Esri. At least keep it in mind as a resource as you work through the rest of the exercise.
Note
There is no Emerging Theme Discussion this week.
The next page will provide you with the details of the Exercise and writing assignment that are due this week.
Real-time Mapping and Spatial Analytics Exercise
For the analysis part of this exercise, you will consider the applications of (near) real-time geospatial tools for emergency management in greater detail. You should critically evaluate what is already out there and what is required for an effective decision support system utilizing dynamic and real-time spatial data. Once again, you are assuming the role of a geospatial analyst that is planning for and responding to emergency situations.
Steps to Follow
- Start by evaluating some near-real time systems used by different emergency management agencies. We have looked at some examples already, but you should have a search of applications on the web. I can provide some pointers if you are having trouble finding suitable examples.
- From this, and the other material in this week’s lesson, you should come up with a needs assessment/system design for a hazard and location of your choosing e.g., wildfires in California, inland flooding in Queensland. In other words, what functionality should the tool have and what data is required.
- Finally, build a simple prototype with ArcGIS Online tools. You should be able to find some data feeds, but there may or may not be much traffic on them if there isn’t a current emergency. That’s OK the idea is to have a simple prototype that has the essential static and dynamic data elements needed when an emergency occurs. You don’t have to find data for everything or address everything from Step 2.
Deliverables
- Report your findings by writing a short 400 word essay on your critique of existing systems and your design advice. Please include a minimum of two figures (screen-grabs with captions will be OK) illustrating the points you raise.
- Create a simple app/dashboard with ArcGIS Online and share with me (and the class). Please include a link to your app at the TOP of the document.
Submission Instructions
- Submit a link to your app and your written assignment to the Deliverable: Real-time Mapping and Spatial Analytics Exercise Dropbox (L5).
- Post a link to your app with a 2-3 sentence description of what you focused on to the Deliverable: Real-time Mapping App Discussion so that your classmates can see what you have done.
- Review and provide constructive encouragement and feedback on your peer's apps.
- See the Course Calendar for specific due dates.
Grading Criteria
This assignment is worth 50 points toward the exercise portion of your course grade.
This assignment will be grading using the following rubric.
| Criteria | Description | Possible Points |
|---|---|---|
|
Part 1 – Critique of existing systems and design advice |
You make strong and logical arguments and provide analytical insights. Ideas are well organized, clearly communicated and relevant to the prompt. All criteria are accurately addressed. Supporting details are shared, elaborated upon and demonstrate understanding. Examples are provided, and your essay includes images or other multimedia that support content. | 20 |
| Part 2 – Needs assessment and dashboard demo | You make strong and logical arguments and provide analytical insights. Ideas are well organized, clearly communicated and relevant to the prompt. All criteria are accurately addressed. Supporting details are shared, elaborated upon and demonstrate understanding. Examples are provided, and your essay includes images or other multimedia that support content. | 20 |
| Overall - Clarity and Mechanics |
Evidence of editing and proofreading are evident. Writing is engaging and well-structured with excellent transitions between sentences and paragraphs. Concepts are integrated in an original manner. Mechanics (word limits and other requirements) were met. |
10 |
Term Project - Make Progress On Your First Draft
Make Progress On Your First Draft
This week, you should be making significant progress on the first draft of your term project. Your goal should be to make the first draft as high quality as possible, with the idea that doing so will mean you have less work ahead of you to complete your second (and final) draft.
I have designed the timing of this assignment so that I have time to read your full drafts, offer feedback and editing suggestions, and return them to you with enough time left in the course so you can revise your work before submitting a final version.
Expectations
Here are my expectations for your first draft:
- It should be clear who you are writing for and the role you are playing in preparing this report.
- Your draft should be complete, and the topics from your abstract and outline should be covered.
- I understand you may still be working on some of the data analysis and visualization, so I will put a greater emphasis on the rest of the draft. That said, the logic of your analysis should be clear and there should be good progress towards completing your analysis.
- It should be well written using correct grammar and spelling.
- Your draft should not exceed the 3000-word limit (citations and figure captions do not count toward the word limit). A more detailed version of your methodology can be provided in an appendix, and this doesn't count towards your word limit.
- The format of your document should be consistent and elegant.
- You should use a common citation format and apply it consistently. If you don't know which one to use, Chicago Author-Date style [19] is a good default. Refer to the Writing Resources Page [20]for more detials and advice.
Rubric
| Criteria | Description | Possible Points |
|---|---|---|
| Introduction | The introduction meaningfully engages the target audience/reader and clearly presents the central argument along with its substantive, technical and applied contexts. | 15 |
|
Background and Supporting Research |
The paper is well researched and contains references to peer-reviewed articles, government documents and industry reports that relate to the arguments in a logical manner. |
30 |
|
Analysis and Interpretations |
The design and implementation of a methodology was appropriately used to address the central arguments of your topic. Critical, relevant and consistent connections are made between evidence and central arguments. Includes appropriate use of maps, graphics, and tables. Analytical insights are sound and show a deep understanding of the issues. Depending on your selected topic, this may involve describing the steps taken for data analysis and mapping (NOTE –step by step instructions can be put into an appendix and will not count against word limits – discuss this with the instructor). |
30 |
|
Conclusion |
Excellent summary of topic and central arguments with concluding statements that impacts the target audience/reader. 10 | 10 |
| Writing | There is evidence of editing and proofreading. Writing is engaging and well-structured with excellent transitions between sentences and paragraphs. Writing is polished and professional. Concepts are integrated in an original manner. | 15 |
This week, you should complete at least the first half of your term project draft. You will have all of this week and next week to complete your first draft, and since you have other assignments in this course, I recommend you manage your time accordingly.
If you're like me and you have trouble getting started on writing assignments, consider this piece of advice I heard from a colleague about completing a Ph.D. dissertation:
"Every day, set aside a writing task for yourself that is so small that you cannot possibly fail to complete it."
When I was writing my dissertation, I set little goals for myself every day that mirrored this advice. For me, it worked best to set a specific word count that I had to achieve every day. For you, there may be better ways to motivate yourself, so your mileage may vary.

Questions?
Remember, if you have any questions while you are working on your first draft, just send me an email or leave a post on the Questions and Comments Discussion in Canvas.
Summary and Final Tasks
Summary
Effective response to a disaster depends on quickly synthesizing actionable information and disseminating that information to responders in the field. Geospatial data systems and analyses are frequently used to assemble the "big picture" in a disaster. Among other things, it is essential for geospatial systems to help decision makers understand where first responder resources are located and where help is needed.
This week, we also focused attention on another challenge for geospatial systems in response situations. Quite often, a significant disaster will destroy the infrastructure that had been designed to support emergency management. For example, we learned about how an ad hoc system was developed in New York after 9/11. One way of avoiding this kind of problem is to distribute the emergency management geospatial system through a local network or via the Internet where it can be accessed from multiple entry points. This type of approach makes it less important that all emergency management personnel are in the same place.
Up to this point, we have covered mitigation, preparedness, and response topics for emergency management GIS. In the next lesson, we will move on to the final stage of emergency management and explore how geospatial data and analysis is used in longer-term recovery efforts to rebuild disaster areas.
Reminder - Complete all of the Lesson 5 tasks!
You have reached the end of Lesson 5! Double-check the to-do list on the Lesson 5 Overview page to make sure you have completed all of the activities listed there before you begin Lesson 6.