Lesson 7: Using Scenarios to Plan GIS for Emergency Management
Overview & Checklist
In this lesson, we will rely on our new knowledge of geospatial perspectives and technology as it is used in the four stages of emergency management to develop scenarios that can be used to inform the design of new geospatial systems for emergency management. Scenarios are a key creative mechanism for evaluating system designs against the likely impacts and outcomes from a hypothetical disaster situation. You will learn about scenarios and then develop your own.
What You Will Learn
By the successful completion of this lesson, you should be able to:
- describe the key components of scenario design
- produce compelling scenarios that focus on the use of geospatial applications and technology during a hypothetical emergency event.
- explain and discuss why mapping social media is relevant to geospatial systems for emergency management
What You Will Do
Lesson 7 is one week in length. To finish this lesson, you must complete the activities listed below.
| To Read |
|
|---|---|
| To Do |
|
Please refer to the Course Calendar for specific due dates.
Questions?
If you have questions about the content or lesson activities, please post them to the General Questions and Discussion forum in Canvas. While you are there, feel free to post your own responses if you, too, are able to help a classmate. If your question is of a personal nature, please email me directly through Canvas.
What Are Scenarios?
Besides researching previous disasters and geospatially-enabled emergency management technology, an excellent way to forecast what is needed in a future geospatial system is to develop scenarios. You've already had some experience with this in Lesson 3 where you explored potential disasters for Texas using the InaSAFE plugin for QGIS.
In a disaster management setting, scenarios are realistic stories that describe what would happen to people, infrastructure, and the natural environment with a given set of disaster conditions. Often, scenarios are developed as part of a hazard assessment process where they can be used to predict the possible effects on a place, given different types of hazard situations. Scenarios are also used to create training simulations to test preparedness measures and response plans. This latter purpose is particularly relevant for this class; we need to use scenarios to evaluate the extent to which our geospatial infrastructure and analytical capabilities will actually hold up during a disaster situation.
Note that in geospatial system design activities, scenarios can end up being quite formal in terms of their structure. For further reading on the essence of scenario-based design, check out this section from Geospatial System Analysis and Design: GEOG 583 [2] – NOTE: you don’t have to read all of this! Just have a quick look.
Disaster Scenario Examples
A great way to understand scenarios is to read a few yourself. The US Department of Homeland Security and FEMA have prepared many different scenarios and training materials that you can review. Please click on the "Emergency Planning Exercises For Your Organization" link on Emergency Planning Exercises [3] page to see some examples. In particular, I would like to explore a few of these exercises. Please pay particular attention to the roles that participants play, the rules to follow, the scenario itself, and the prompts used to keep things moving. What are participants expected to do and get out of this? Focus on these (but feel free to explore others):
Critical Power Failure
“Developed by the Office of External Affairs and the FEMA's National Exercise Division, this exercise is based on a combination of U.S. communities experiencing critical power failure during a severe weather event. Designed to help the private sector identify ways to prepare for, respond to, and recover from such a disaster.”
Hurricane
“Prepare to respond to and recover from a Category 5 hurricane. Based on the National Planning Scenario for a major hurricane, this exercise was developed by the Office of External Affairs together with FEMA's National Exercise Division to prepare the private sector for catastrophic damage caused by major flooding, tornado, and other natural disasters.”
Chemical Accident
“Based on the National Planning Scenario for a chlorine tank explosion, this exercise is designed to help the private sector improve Organizational Continuity, Preparedness, and Resiliency in the event of an emergency, to respond to, recover and restore operations.”
Tabletop Exercises
You’ll also note that scenarios often go hand-in-hand with Tabletop exercises. Tabletop exercises are simulated response activities. Usually, these are held in an extremely generic hotel ballroom with stakeholders of all types hunkered down on their laptops. An exercise begins with a scenario description, and then a moderator provides additional information during the response activities to throw things into further chaos and test the limits of what people are prepared for. Some of the FEMA materials include videos to simulate news reporting, although they need to be about forty times more hyperbolic to match the 24/7 news channel intensity these days.
The 2:06 minute video below provides an interesting example of a tabletop exercise conducted by the local government in Waco, Texas in 2017. Pretty low-tech, but you get the idea of what can be accomplished. More focused exercises can subsequently be run with specific stakeholders, e.g., geospatial teams.
Click here for a transcript of the Emergency Operations Hold Table Top Exercise video.
Emergency Operations Hold Table Top Exercise
PRESENTER: Are you prepared for a winter storm? I mean, a really big storm? Well, the Waco-McLennan County Office of Emergency Management, along with Baylor University, held what's known as a tabletop exercise, where city staff from multiple departments, along with other community partners, went through a disaster scenario where most of Texas and especially Waco was hit by a major winter storm that iced all the roads, knocked down power lines, interrupting electricity to a majority of the city, taking down with it all TV and radio stations, and many cell towers over the seven frigid days of the storm.
Now, what would you do? That's some of the things that these city staff members discussed and planned for such an event. A typical ice and severe cold weather event in Waco lasts only about one or two days. But after six or seven days of continued ice and storm, emergency generators run out of fuel, and fuel delivery trucks can't provide the needed resources.
These are the things your city's emergency management team worked with at this emergency preparedness exercise held at McLane Stadium on Wednesday, September the 5th. Coordinated by Frank Patterson and Daniel Scott at Waco's emergency management office and hosted by Baylor University, participants realized that we have good plans already for such an event. But when talking it through across the table, there were new ways to improve and be prepared for a bigger than big event.
DANIEL SCOTT: It's important to bring everybody together at a time, work through some different scenarios, so when something does happen, everybody has gone through the process that we would take in an actual emergency, and we all know each other. We all know what our job is going to be. We all stay in our own lanes. And when it comes down to it, we can get it done without second guessing each other. We've done it before in practice, so we can do it in real life right there on the fly.
PRESENTER: It's exercises like this that help Waco area emergency responders be ready and prepared for all kinds of events that impact the lives of our residents.
Group Scenario Exercise
Introduction
This week we will do something a little different for our writing assignment. I would like you to work in groups (see the Lesson 7 announcement for group assignments) to develop one of three different scenarios that focus on leverage points for the use of geospatial applications and technology. You will have the opportunity to imagine a realistic situation and propose different roles for geospatial approaches during the disaster. Each group will use Esri Story Maps [4] to present the content and analysis you have developed.
For this exercise, you will work in the following groups
Group 1 - TBD
Group 2 - TBD
Group 3 - TBD
Group 4 - TBD
You will be assigned one of three topics.
-
Develop a scenario about a cyber attack that impacts the power grid in the Southeast US. Split your scenario into five 6-hour long time periods, starting with the time period 6 hours prior to the attack.
-
Develop a scenario about a major indiustrial accident (e.g.,chemical spill but you can choose something else) in an industrial site within a major urban area. Split your scenario into five 6-hour long time periods, starting with the time period 6 hours prior to the accident.
Criteria
You will notice that I have not provided detailed specifics on certain aspects of each disaster, such as how fast the wildfires are spreading, or how effective the cyber-attack was at interrupting the power supply. I encourage you to fill in those gaps in your writing and to imagine plausible answers to those sorts of questions.
- For each time period, write two short paragraphs describing what would happen to people, infrastructure, and the natural environment considering the local geography.
- For each time period, identify at least one example of how GIS could be used to prepare, mitigate, respond to, or recover from a specific aspect of the disaster.
- Embed pictures, maps, or other graphics to help tell your story. If you have ideas for geospatial workflows, include them in graphical form.
- Your scenario should be compelling and realistic in a way that would make it easy for an organization to use it as a starting point for developing a disaster preparation plan.
I know group work can be challenging if everyone doesn't do their part. As part of the assessment you will be asked to provide confidential feedback to me about how things went with your team mates. If you are having problems during the week, please let me know as well.
Instructions
For this group exercise, you will be organizing your content into an Esri Story Map. For those of you not familiar with Story Maps, they are a great way of presenting a narrative that includes a mix of text, maps, and other multimedia. They can be a powerful way of conveying a lot of complex material in a “guided tour” format. You can view many examples on the Story Maps homepage [4]. The Story Map related to Hurricane Harvey [5] is particularly nice and you saw one on the 2018 Camp Fire in Lesson 2.
There are a number of ways to get started. You can collaboratively edit in your Story Map directly or you can create a “Storyboard” in a program like PowerPoint or Word and then migrate content. I recommend you develop a storyboard. This will help you organize your content and make sure you have what you need to make the story map. As mentioned in earlier lessons, you can manage your collaboration in the course OneDrive folder.
Here are some resources to get you started.
- ArcGIS Online [6]
- How to make a story map [7]
- What Kind of Story Do You Want to Tell? [8]
- There are also many videos on the Esri site and YouTube for further advice and inspiration.
Before you get started, I recommend that you decide on a division of labor for this work. For example, one person might want to be responsible for developing the overall narrative in consultation with the group, another person might want to take on the analysis/mapping task and another may want to focus on migrating everything into the Story Map.
Collaborating
Since you are working in small groups, collaboration should be fairly straightforward, I suggest the following -
- Get organized - Review the assignment requirements and decide on what you are going to do. Come up with a division of labour e.g., someone might collect content, someone might develop the maps and someone might assemble the Story Map. Make a plan and stick with it, and keep in mind you don't have a lot of time.
- OneDrive and Office 365 Apps - Create a folder in OneDrive and share it with your group. Collect any images or other resources needed for your Story Map. Consider using PowerPoint to create a 'storyboard' to layout your content before moving it to ArcGIS Online.
- ArcGIS Online and Story Maps - Create a group and invite your classmates. You should be able to enable simultaneous editing of the StoryMap. Note that web maps / apps you create can be embedded in Story Maps along with a wide range of other content.
- Ask for help - Get in touch with the instructor if you are having any problems.
Deliverables
For this week's exercise, please submit the following items to the Lesson 7 Group Scenario Exercise Dropbox in Canvas. See our Course Calendar in Canvas for specific due dates.
- Link to the Esri Story Map. Please include the topic number in the naming convention.
Grading Criteria
I'll assign grades by group. This project is worth 4% of your total course grade and will be graded out of 20 points using the following rubric.
| Criteria | Description of Criteria | Possible Points |
|---|---|---|
| Content and Impact | Your group makes strong and logical arguments and provides analytical insights. Ideas are well organized, clearly communicated and relevant. All criteria are accurately addressed. Supporting details are shared, elaborated upon and demonstrate understanding. Examples are provided, and your StoryMap includes geospatial products, images or other multimedia that support content. | 14 |
| Clarity and Mechanics | Your StoryMap shows evidence of editing and careful proofreading. Writing is engaging and well-structured with excellent transitions between sections and visual content. Concepts are integrated in an original manner. | 4 |
| Team member evaluation | Confidential comments are provided on your experience working in your assigned group. | 2 |
| Total Points | - | 20 |
Emerging Theme: Social Media and Crisis Mapping
Informal Use of Social Media During Crisis
We have already talked a lot about volunteered geographic information (VGI) and other types of citizen involvement in emergency management, but here we will consider how social media data, like Twitter, Instagram, and Facebook, are being used informally and more formally through big (spatial) data analytics. These are potentially rich data sources but are still a bit difficult to use and have some specific problems around getting accurate and meaningful location information.
To get this section started, have a look at this NBC Nightly News Story (2:01 minutes) about how search-and-rescue used social media to help locate people needing rescue.
LESTER HOLT: By air and by boat, the rescuers continue to come. Harris County Constable, Alan Rosen, and his deputies are among many answering the urgent pleas of those waiting for aid. We joined them today as his fleet of high water rescue trucks rolled out looking for those in need. And while the size of the trucks are impressive, they can only go so far.
ALAN ROSEN: We did have one get stuck yesterday with some very high water, seven feet. We had to deploy boats.
LESTER HOLT: Rosen is relying on an unlikely source to direct his teams where to go. This is one of the biggest natural disasters of the social media age. How has that affected how you are dispatched?
ALAN ROSEN: Social media has helped us message, find out where people needed to be rescued. People were on their roofs. It helped us deploy assets.
LESTER HOLT: #SOSHarvey has been trending on Twitter since the flooding began-- users tweeting out addresses where people needed to be evacuated. "2 adults 2 children water at waist level 9015 Sandpiper #HarveySOS". Facebook has a safety check where users can alert family members to their whereabouts. Those still in need of help are urged to post their addresses and phone numbers and sit tight. Help will come.
SURVIVOR: We're going to be OK, I think.
ALAN ROSEN: We're still in a search and rescue mode. And we're going to continue to focus on saving lives until the water recedes and everybody is safe to go home and clean up their lives.
LESTER HOLT: And, as you saw, the constable working right alongside with the National Guard and their high water vehicles on that rescue. Just some of the heroism we're seeing here in Texas as a terrible situation brings out an incredible showing of humanity.
Hey NBC News fans, thanks for checking out our YouTube channel. Subscribe by clicking on that button down here. And click on any of the videos over here to watch the latest interviews, show highlights, and digital exclusives. Thanks for watching.
Mapping Social Media in Crises
In the recent past, there have been significant advances in automated tools for extracting place information from news articles and other text media. This led to a wave of map mashups that allowed for news stories to be browsed using a map. Since those earlier efforts, social media data sources have become ubiquitous, and while similar methods can be used to extract and represent places mentioned in social media reports like Tweets, there are also a lot of challenges we have yet to overcome to make these datasets truly useful in a crisis situation. Moreover, as we saw in Lesson 5, the rise of real-time geospatial systems means we need to be able to locate and understand the content of social media in near real-time, and this is still challenging!
The use of social media in disaster response really took off in the mid-2000s with the efforts of digital humanitarians like Patrick Meier, the author of your textbooks (also see Chapter 3 – Crowd Computing Social Media in Digital Humanitarians for more). In the following short video (1:31 minutes), Patrick explains how this works, particularly how we can teach machines to understand and classify tweets into actionable information.
Patrick Meier: How can social media help in disaster response
PATRICK MEIER: I work in a number of different networks and projects in social media and disaster response. One of them is a Digital Humanitarian Network, which is a global network of technology savvy, digital volunteers who basically make sense of the big data that gets generated during disasters on behalf of established, traditional humanitarian organizations because these organizations have no idea how to make sense of this big data. It's a very new world for them.
Typically, well, like the Nepal earthquake-- happening within a few hours of the Nepal earthquake, the Digital Humanitarian Network was activated by the United Nations to carry out a number of different missions. One of them was to look through social media and find urgent messages. So what we did is we used a new platform called micro macros, which crowdsources the filtering of social media information to quickly find those messages that have to do with urgent calls for help.
So what you do is you give the algorithm a lot of examples of what urgent tweets looks like. And the algorithm starts to learn what the similarities are. So if you say, OK, these 100 tweets here are all about urgent needs and you send it to the algorithm, what the algorithm does is it looks at the similarities between all these 100 tweets. And it says, OK, now I understand why all these tweets are similar. I'm going to find more tweets like these 100 tweets. So it's that simple.
A few of the challenges associated with mapping information from social media are:
- disambiguating where a tweet is reported from versus what places it talks about;
- figuring out which locations to use when the place names found could refer to multiple places (Indiana, PA vs. Indiana the state);
- symbolizing massive collections of social media reports on a map (simple overlay just causes a lot of clutter - so what else can we do?).
Here at Penn State, we've been engaged in research to develop new tools for foraging through and visualizing geographic information coming from social media reports.
The SensePlace2 project harvests tweets that include disaster-related keywords. From these tweets, we then extract place names and geocode them (along with other named entities, such as people, organizations, and resources). Please have a look at the following 3 minute video, SensePlace2: Visual Analytics and Big Data for Spatiotemporal Sensemaking.
SensePlace2: Visual Analytics and Big Data for Spatiotemporal Sensemaking
[MUSIC PLAYING]
JOSHUA STEVENS: By the time I finish this sentence, more than 500 million users on Twitter will have sent over 37,000 tweets. By the end of the day, these users will send more than 400 million tweets. There is clearly a lot of conversation happening on social media. But what can it actually tell us?
Hi, I'm Joshua Stevens, a 2nd-year PhD candidate in Geography at Penn State's GeoVISTA Center. As part of the IGERT in Big Data Social Science, I'm working on a project that attempts to make sense out of this torrent of tweets.
Humans are very social, and we are now more connected to each other and various sources of information than ever before. We enjoy talking about the events happening around us, sharing our successes, lamenting our failures, and distributing information in times of crisis. The Internet and social media allow us to do this on a global scale. This means that where people are talking about is just as important as what people are talking about.
Now, you may be thinking, doesn't Twitter already record my location and include it with my tweets? It certainly can. But less than 1% of all tweets include geolocation data. So the more difficult question and the concept we're interested in is, how do we determine the geographic context of the other 99% of tweets? And more importantly, how can we determine the locations people are talking about, not just the locations they're tweeting from?
To do this, we've created a tool called SensePlace2. SensePlace2 works by analyzing tweets to identify topics and locations mentioned in the text. We use sophisticated entity extraction and geolocation algorithms to map the places mentioned in each tweet, pairing mentioned locations with both a tweet and a timestamp. When this is done for hundreds of millions of tweets, there's simply too much information to take in all at once. This is where advanced cartography and interactive features, the key elements of geovisual analytics, come into play.
Let's take a look at SensePlace2 in action to see how this works. We'll run a search using the term "protests." You might reason that some places will mention protests more than others. But where are mentions of protests more common? And which locations tend to get mentioned with protests at the same time? SensePlace2 can help us explore these questions.
The Map View shows all the locations that are mentioned in tweets containing our search term. A Place-tree view and word cloud show the most frequent place mentions in our search results. The dark red areas and the timeline reveal that tweets mentioning protests were more frequent earlier in the year. We'll constrain our search to this time period by adjusting the Temporal Controls. Notice that the top locations are different now.
With SensePlace2, users can explore the geographic landscape of tweets in an intuitive, interactive way. By enabling analysts to understand the what, when, and where of social media, our research demonstrates how geovisual analytics can support spatial understanding and the interpretation of enormous and complex data sets. This enriches our ability to ask important questions about the topics that affect people and places and how these relationships change over time. On behalf of the SensePlace2 Team, thank you for viewing our video.
If you want to learn more, check out this 2017 journal article on the project: SensePlace3: a geovisual framework to analyze place–time–attribute information in social media, Cartography and Geographic Information Science [9]
Because so many social media sources now feature API access to their data feeds, new map mashups are now possible that can integrate multiple forms of social media with other geospatial data. Keep in mind that the quality of these vary considerably. For example, some tools just use the location feature that some (very few, it turns out [10]) enable on their devices when they use Twitter.
OPTIONAL
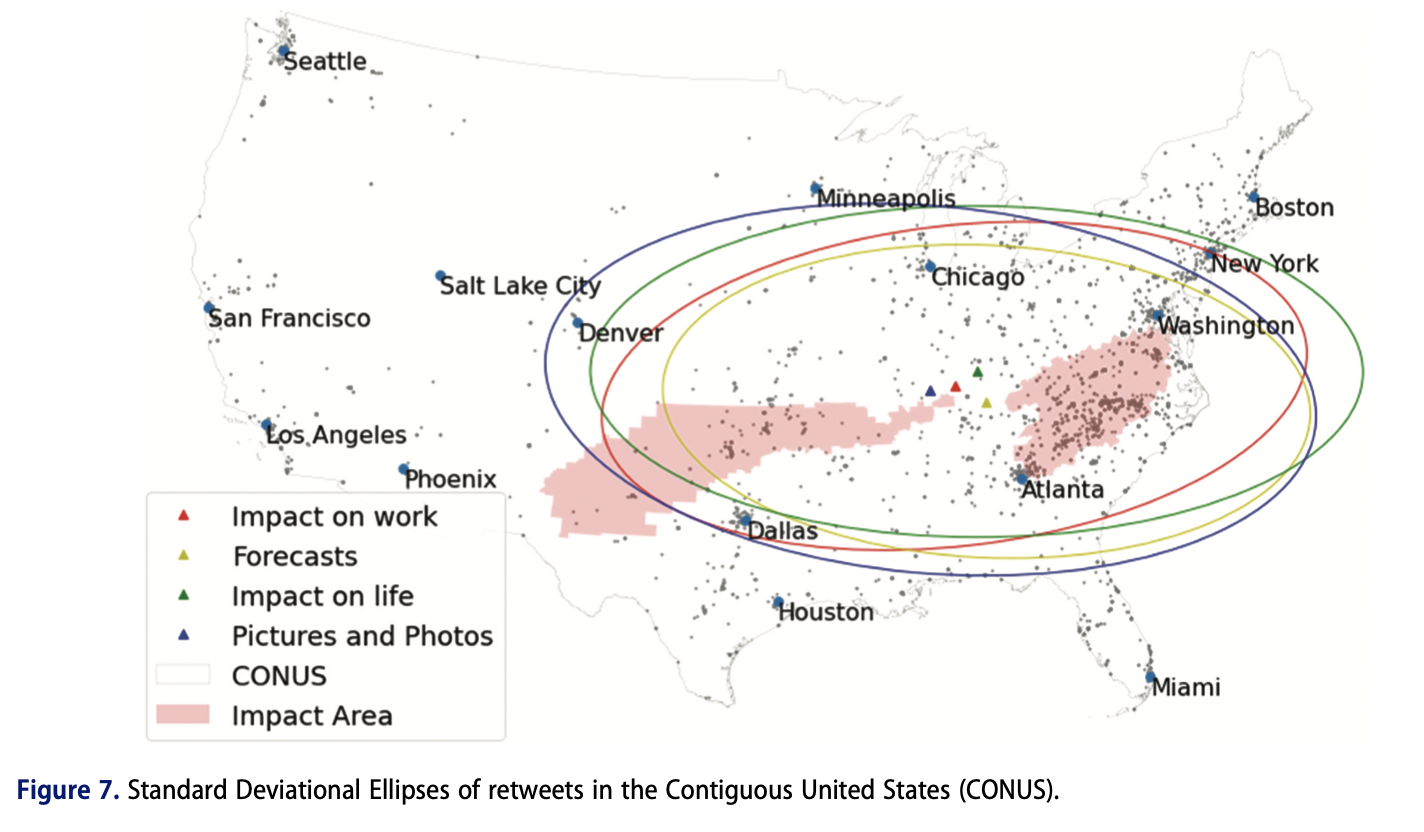
You may be interested in this study that was published just this year (2022!) on using tweets and retweets to understand information diffusion during disasters. This is just FYI, but it is worth a skim now.
Jinwen Xu & Yi Qiang (2022) Analysing Information Diffusion in Natural Hazards using Retweets - a Case Study of 2018 Winter Storm Diego [11], Annals of GIS, 28:2, 213-227, DOI: 10.1080/19475683.2021.1954086
Deliverable
- Post a comment in the Emerging Theme Discussion (L7) forum that describes how you imagine integrating social media mapping into a successful geospatial system for emergency management. How would you deal with the various aspects of uncertainty that these data sources entail? What emergency management phase do you think social media data is most useful for?
- In addition, provide a link and short description to a social media application to emergency management or public safety ‘in the news’ or that you have otherwise come across.
- The initial post should be completed during the first 5 days of the lesson.
- Then, I'd like you to offer additional insights, critiques, a counter-example, or something else constructive in response to your colleagues on two of the following 5 days.
- Brownie points for linking to other technology demos, pictures, blog posts, etc., that you've found to enrich your posts.
NOTE: Respond to this assignment in the Emerging Theme Discussion (L7) forum by the date indicated on the course calendar.
Grading Criteria
This discussion will be graded out of 15 points.
Please see the Discussion Expectations and Grading page under the Orientation and Course Resources module for details.
Term Project - Take a Break
This week, I'll be reading each of your term project drafts and providing my feedback. So, for now, you can relax a little about your project and focus on the rest of this lesson.
Summary and Final Tasks
This week, we have explored how scenarios can be used to predict and plan for how GIS can be used for emergency management situations. Scenarios are stories developed around a hypothetical disaster situation, and they are used quite commonly in planning activities as a way to predict what will happen in a real situation.
You have worked with your classmates in this lesson to develop your own scenarios to see for yourself how scenario-based planning works. I hope you found it valuable to attempt this task with your colleagues. Most people who are charged with the task of planning a GIS for emergency management will not be working on that task alone, so the challenges posed by group work in this situation are quite relevant.
Scenarios are not easy to pin down. There are no universal rules as to what they should or should not include, and there are no automated tools available yet that can generate them. Scenario writing requires the synthesis of multiple types of knowledge, and, ultimately, it demands a fair bit of creativity on behalf of the author(s).
Next, we will apply what we have learned so far about the dimensions of emergency management and ways to plan GIS systems to support emergency management tasks. In the next lesson, we will work together on a case study research project to understand how GIS was used in the mitigation, preparation, response, and recovery from a recent disaster.
Reminder - Complete all of the Lesson 7 tasks!
You have reached the end of Lesson 7! Double-check the to-do list on the Lesson 7 Overview page to make sure you have completed all of the activities listed there before you begin Lesson 8.