Lesson 2: Hazards and Disasters
Overview and Checklist
Overview
Threats to people and their property can take many forms. Many of the situations we concern ourselves with in this course are linked to natural events. But it is also important to consider a wide range of social and economic triggers that could cause emergency management situations. In this lesson, we'll take a look at a variety of disaster types and their associated geographic attributes.
What You Will Learn
By the end of this lesson, you should be able to:
- identify the wide array of emergency situations in which geospatial tools could be used;
- evaluate possible term project topics and related datasets, choose a topic, write an abstract and present to the instructor;
- learn more about the growing technological trend of UAV systems and how they relate to geospatial analysis and crises;
- complete a hazard/risk assessment using GIS and UAV date and evaluate the results.
What You Will Do
Lesson 2 is one week in length. To finish this lesson, you must complete the activities listed below.
| To Read |
|
|---|---|
| To Do |
|
Please refer to the Course Calendar for specific due dates.
Questions?
If you have questions about the content or lesson activities, please post them to the General Questions and Discussion forum in Canvas. While you are there, feel free to post your own responses if you, too, are able to help a classmate. If your question is of a personal nature, please email me directly through Canvas.
Hazards and Disasters
There is a very wide range of hazards and disasters we must consider when planning and implementing geospatial solutions for emergency management. It is easy to focus on the very large and obvious events - things like hurricanes, earthquakes, and disease epidemics. For many geospatial managers, however, there are day-to-day emergency situations on a local level that deserve plenty of attention: house fires, auto accidents, and violent crimes - just to name a few.
In this lesson, you will consider some of the characteristics of disaster and emergency events in three main ways. On this page, you will explore how different organizations track and provide up to date information on emergencies around the world - A key message that will become evident is that there are many diverse disasters and emergencies occurring at any given time. On the following pages, you will read about some specific hazards and disasters and how they are understood from a geospatial perspective, and you will do a hands-on hazard and damage assessment.
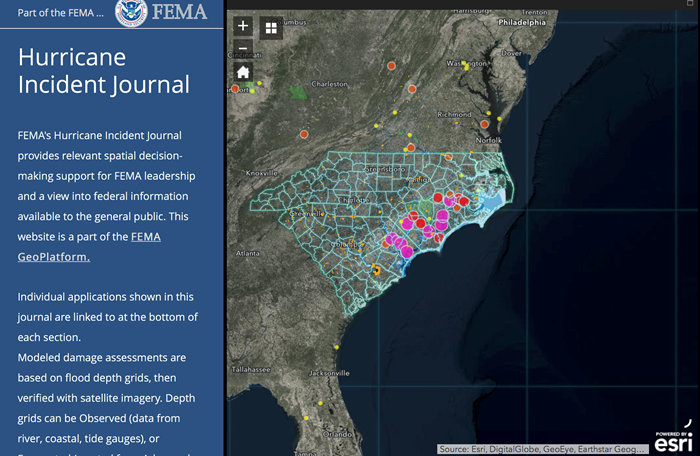
Let's jump in! The Federal Emergency Management Agency (FEMA) keeps a running tab of declared disaster events in the US [3]. You've probably heard of these on the news when the President declares a location a "Federal Disaster Area". In addition to these alerts, FEMA now publishes quite a few interesting summary maps of recent disasters at their GeoPlatform. Please spend some time looking at the various components of the FEMA GeoPlatform [4]. While there, think about what information is provided - DataHubs like this are becoming popular and useful tools for providing external facing data and mapping services. Who is the target audience for this? Is this a potential data source or is it locked down? Some of these pages rely on Esri Story Maps, a tool you will use later in the course. You might want to bookmark this to come back to as we talk about different types of Hazards and Disasters and when new events happen in the United States as we work through this course.
Next, have a quick look at the following presentation prepared for a daily FEMA Geospatial Coordination Conference Call for Hurricane Lane as it passed near Hawaii in the summer of 2018 [5] (You looked at a similar one of these in Lesson 1 focused on Hurricane Maria). These briefings describe the state of Situation Awareness, particularly from a geospatial readiness perspective. We’ll revisit this concept in coming lessons but for now, note the range of actors and their different roles/viewpoints on this event. This is also a much more technical view than what is provided in the GeoPlatform, and you can find some of the data behind this on their GIS portal.
Finally, a complementary example identifying and tracking emergencies and disasters can be found on a map developed by the Emergency and Disaster Information Service (EDIS) to provide information on a wide range of hazards and disasters around the world. Take a look at this application called EventMap [6].
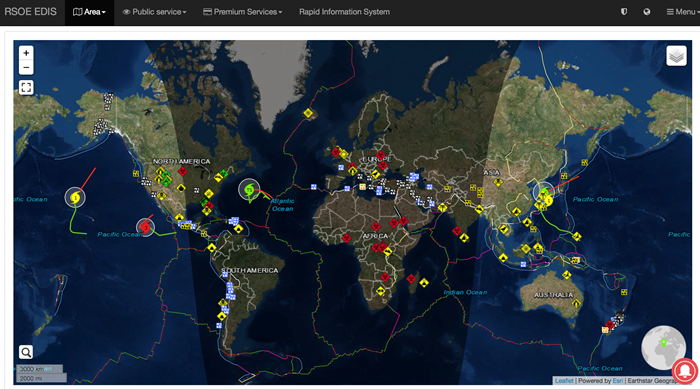 [6]
[6]
There are other examples like this that we will come across during this course and as part of future lessons, and we will also look at geospatial tools for understanding particular events on a much more detailed level. Next, you will consider some hazards and disasters in greater detail through this week's readings.
Reading Assignment
How Reading Assignments Work
Here is a quick recap of how the reading assignments work. For each lesson, I will ask you to read parts of your textbooks, online materials I select, or articles I've found. As you can see below, I'll try to make it as clear as possible what you're expected to do by always identifying specific reading assignments in a separate box.
Part of your class participation grade will be making responses on our discussion board to questions I pose about the readings. Whenever you see a RESPOND prompt, you need to respond to that question as directed. Occasionally, I'll mark items THINK ABOUT when I simply want to direct your thoughts as you read.
You can access most of the readings via the links on this page. Some are also available as files in the Lesson 2 Module of Canvas.
Lesson 2 Reading Assignment
The readings for this week are selected to continue the introduction to spatial data science for emergency management and to hazards and disasters in particular. These are some fundamental concepts you will very likely refer back to as you engage with the course material and develop your own term project. The first reading is from your GIS for Disaster Management textbook and provides a broad background on disaster management and GIS. It also introduces the important point that there are different levels of responsibility for responding to events, some overlapping some distinct. You should think about the role of government (local, state, and federal), non-government organizations, industry and private sector, and the research and education organizations in each phase of emergency management. It is a complex landscape, and this course often considers the ways these actors intersect.
The second reading is a report/handbook developed by the Association of Southeast Asian Nations (ASEAN) on different hazard and disasters, their complex characteristics and how to address them. You will read just a part of the handbook, but it is likely to be of use as you move through the course and encounter different topics you want to learn more about (It could also provide inspiration for your choice of term project topic!).
1. READ
"GIS for Disaster Management" - Chapter 5, "Disaster Management and Geographic Information Systems" (see Library Resources link in Canvas).
Respond
In your view and based on the readings, what are the major challenges in GIS and emergency management for the three major areas of government: local, state, and federal? How do the issues at one level affect those at another? What are the barriers to a cohesive, integrated approach to emergency management across the levels? Finish your evaluation with a couple of sentences about what happens when you overlay a pandemic like what we are experiences with COVID-18. Be critical!
2. READ
From the 2017 ASEAN report “Specific Hazards: Handbook on Geospatial Decision Support in ASEAN Countries [7]” read the Preface, pages 1 – 13 and then pick one of the chapters on specific hazards (e.g., “Landslide”). The other chapters will be a good reference as you consider other hazards in this class.
Think About
What are some of the general principals, approaches, and technologies applicable across the range of hazards considered in this report? Then, think about how these play out for a specific hazard, particularly with regard to:
- the spatial and temporal characteristics of the hazard,
- how quickly geospatial information can be assembled to aid in decision support.
3. READ
The 2021 report "Hitting Home: The Compounding Costs of Climate Inaction [8]" by the Climate Council highlights describes how climate change is influencing the timing, frequency, and severity of different disasters. Play attention to what they say about future trajectories, and think about whether we are heading in the right direction with our approaches to emergency management.
Deliverable
- Post a comment in the Reading Discussion (L2) forum that addresses the conditions mentioned in the RESPOND prompt above. Post your initial comment during the first 5 days of the lesson.
- Then, I'd like you to offer additional insights, critiques, a counter-example, or something else constructive in response to your colleagues on three of the following 5 days.
- Brownie points for linking to other technology demos, pictures, blog posts, etc., that you've found to enrich your posts.
NOTE: Respond to this assignment in the Reading Discussion (L2) forum by the date indicated on the course calendar.
Grading Criteria
This discussion will be graded out of 15 points.
Please see the Discussion Expectations and Grading page under the Orientation and Course Resources module for details.
Emerging Theme: GIS and UAVs
Unmanned Aerial Vehicles (UAVs)
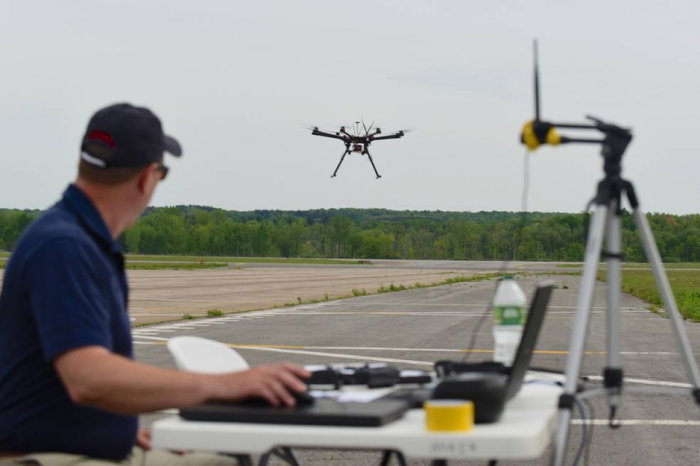
We are probably all familiar with drones, or UAVs, as they are virtually everywhere these days. UAVs are remote controlled airplanes and helicopters that are capable of providing surveillance and attack capabilities for military and civilian uses (no attack capabilities in the civilian case, unless you mount a potato gun). Their development grew out of the need for airborne reconnaissance on missions that are either too dangerous or too tedious for piloted aircraft. Today, UAVs have evolved to the point that some platforms are small enough to be easily deployed by a small support team and require only a hand launch or a very short runway. They are often referred to more generically as Unmanned Aerial Systems (UAS), as the vehicles themselves are just one piece of the overall puzzle in most geospatial workflows You may also be interested to look at another one of the GIS courses we offer, GEOG 892: Geospatial Applications of Unmanned Aerial Systems (UAS) [9]. It is focused explicitly on how UAVs and GIS working together.
UAVs for Emergency Management
In the emergency management context, UAVs are already used in a variety of ways and new applications continue to emerge.
UAVs are capable of surveying areas very quickly to provide imagery to - or other types of - remotely-sensed data. Satellite data is always valuable and desirable, but satellites cannot always be overhead at the right times on demand. UAVs can be deployed very quickly and can be easily directed toward different areas as the situational picture develops. It is worth noting that UAV footage combined with new approaches to image processing means emergency responders can have high-quality imagery and maps in a matter of hours rather than days.
Click on the image below to see a great example of how UAV footage was used to create a compelling story and reference document about the 2018 Camp Fire in California.
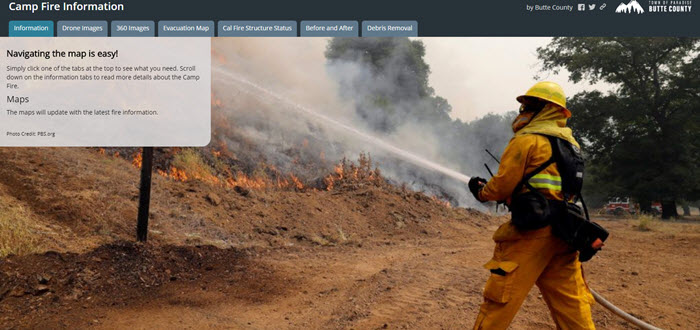 [10]
[10]
Drone Mapping of the California Camp Fire
The following 2:28 minute video provides a good illustration of the links between drone mission planning/field operations, image processing, and delivery of products for use in response and recovery activities. Note the time frames involved in this, and how much shorter they are than other traditional aerial or remote sensing efforts. However, the time required to process imagery from those platforms is rapidly shortening as well.
Click here for a transcript of the Disaster drone mapping of the Camp Fire video.
GREG CRUTSINGER: My name's Greg Crutsinger. I was the drone data analyst for the Public Safety UAS teams associated with the tragic campfire in Paradise, California over the past week. I was called in to be the drone data coordinator, so playing the role of coordinating the data side of around 15 to 16 public safety teams made up of law enforcement and fire.
Over a period of two days or so of full flights and another half day of kind of preliminary flights, we were able to map about 26.2 square miles or around 17,000 acres over about 518 drone flights using primarily DJI Phantom 4 Pros. That produced around 70,000 photos, representing about 460 gigs of information. From air, those data were run by runners down to San Francisco and processed by drone deploy and turned around in 24 hours. So each day, they would process for 24 hours. And it would be done by the end of-- so by 48 hours, we were finished with all of those data.
Around 12 hours later or so, that was all accumulated into one big map and put online and made public for public agency use for local and state and federal agencies to get very high-resolution information for the town of Paradise. It's also going to be used by utilities and insurance companies and then, of course, the residents that are impacted by this tragic event. So there's lots and lots of lessons that were learned from this event. And those will be shared over time. I think that the drones finally really showed that they're a valuable tool and just another part of these kinds of disaster responses.
So it's Thanksgiving Day. I got my coffee. I finally slept a little bit. I haven't slept in about seven days.
The information can be found on the Butte County website. And I'm going to take it easy. So Happy Thanksgiving, everyone.
We are all pretty familiar with the use of drones for imagery, but here are a few additional emerging uses for drones in emergency stations. The next video is a bit of a ‘vision’ for drone use and this is followed by a few specific examples of how drones are being used in emergency response.
The following 3:30 minute video: Disaster Response Support with Drones, provides a nice overview.
PRESENTER: Numerous hikers have gone missing after a strong storm yesterday. Currently, three people are still missing. They were hiking separately on hiking trail 34. Drone special teams start the search with search parties and drones from the nearest farm.
[SIREN BLARING]
[DRAMATIC MUSIC PLAYING]
[ON SCREEN TEXT WHILE DRONES ARE FLYING AND RESCUE TEAM SEARCHES AND REVIEWS THE DRONE FOOTAGE: Disaster response support with Drones. Mission and path planning. Aerial Surveillance. Image Processing. Wireless multimedia communications. Drone-based delivery. Coordination and swarming. Autonomous navigation Human drone interaction. Precise landing.]
Payload Drones
It’s not just about Amazon delivering goods to your door… Payload drones are increasingly being used in crises as illustrated in the following videos from WeRobotics and Zipline.
Watch WeRobotics Amazon Rainforest Cargo Drones (2:35 minutes)
Click here for a transcript of the Amazon Rainforest Cargo Drones Video.
NARRATOR: The Amazon rainforest is home to thousands of indigenous communities spread across very remote areas. Their only means of transportation is by riverboat. It can take many hours, and even days to reach the next village.
When local doctors run out of medicines, new supplies have to be shipped by boat. So for example, if a villager is bitten by a snake and a doctor is out of antivenom, the villager may not live to see the medicine when it finally arrives. Snake bites are a major concern in the Amazon. Doctors report an average of 45 snake bites per month in the Contamana region alone.
WeRobotics was invited by the Peruvian Ministry of Health and local doctors to explore whether drones could support medical delivery efforts in the rainforest. WeRobotics Peru Flying Labs took the lead in the field testing and were highly successful.
JUAN BERGELUND: Actually, we were able to transport medicine, the antivenom, and medicine from the Contamana city to Pampa Hermosa city.
NARRATOR: The cold pack with the antivenom was placed into the drone and then hand launched. It took the drone 35 minutes to reach the village of Pampa Hermosa, about 40 kilometers away. A regular boat would have required six hours to reach the village. In Pampa Hermosa, villagers witnessed the first ever drone delivery in their village. The local doctors asked a boy to simulate a snakebite so they could demonstrate the importance of drone deliveries. That night, the drone flew back to Contamana.
JUAN BERGELUND: We flew both sample a special refrigerated vessel, and then we flew back to Contamana and they were able to get that one. We go to the main square and we show to the whole population about the importance of using these UAVs for humanitarian reasons.
NARRATOR: The first ever cargo drone deliveries in the Amazon rainforest were a success. As a result, the Ministry of Health and local doctors have invited WeRobotics to carry out additional deliveries to even more remote villages.
[MUSIC PLAYING]
If you have some time it is worth checking out WeRobotics [11] [11]on their website or YouTube. Patrick Meier, the author of Digital Humanitarians, is also a co-founder of WeRobotics.
Now watch the 4:05 minute video about airdrops of medical supplies to African Villages.
Click here for a transcript of the Zipline drones airdrop medical supplies to African villages video.
Zipline drones airdrop medical supplies to African villages
[MUSIC PLAYING]
KELLER RINAUDO: Zipline designs, manufacturers, and operates robotic aircraft that deliver medicine to people in hard-to-reach places and save lives as a result. We primarily work with governments, particularly governments in the developing world that often have challenges delivering medical products to people who live in rural or isolated communities, things like blood, rabies vaccine, normal vaccines, oxytocin-- things that if patients need, you really need it in that moment because your life is on the line. We started working on Zipline as a product about 2 1/2 years ago. And we are actually just beginning to operate at a national scale in Rwanda this month. And so that represents the world's first drone delivery service that's actually operating in a routine way and at a national scale.
DRONE PILOT: Kigali Tower, Zip 24, how do you read me?
AIR TRAFFIC CONTROLLER: [INAUDIBLE] contact 24, Kagli Tower. I read you 5 by 5.
KELLER RINAUDO: So we're standing by a launcher which has a Zip on it. And the Zip is actually ready to fly and go make a delivery. The reason we use launchers and the recovery system-- that we're going to look at in a sec-- is that these vehicles don't have landing gear on them. And it's actually not possible to build a runway in every place that we might want to deploy a system. So the Zip basically attaches to the launcher here, and then this launcher will tension. There's a bungee in the middle of this structure. And then when you press that button, it will basically accelerate the vehicle. And the vehicle's flying autonomously and ready to make a delivery.
LORA KOLODNY: Why was it designed like this? What were some of the safety considerations?
KELLER RINAUDO: So as I mentioned, one the challenges of everything that we do is that if you want to be able to fly beyond line of sight and you want to fly over populated areas-- which are two things that oftentimes regulators are uncomfortable with-- you really have to be able to show that these kinds of vehicles can operate at a level of safety that's equivalent to a general aviation aircraft.
LORA KOLODNY: Where are these things set up-- the launchers?
KELLER RINAUDO: So basically, the launcher, the recovery system, as well as the shipping containers all form the distribution center. And we set up a distribution center usually near a medical supply warehouse so we don't have to stock all the medicine ourselves. Really, the distribution center is designed to be kind of a magical technology that enables that warehouse to make hundreds of deliveries-- instant deliveries-- per day to any location within a 75-kilometer radius.
Today in Rwanda, we're focused exclusively on blood. And that might sound simple, but it's actually really complicated. The government of Rwanda delivers about 65,000 units of blood a year. 50% of that is going toward moms who are suffering from postpartum hemorrhage. And then, 30% is going to our kids under the age of five who suffer from severe anemia due to malaria.
So this is really important. It's a complete emergency. Someone's life is on the line when you need one of these products. But it's very difficult to stock these products reliably because you have red blood cells, platelets, plasma. You need all three. They all have different storage requirements, different shelf lives. And then with red blood cells, you've got eight different types-- A, B, AB, and O, and positive and negative Rh factor of each.
So it's basically an impossible logistics challenge. And what's so great about this is it allows them to go from trying to make these impossible predictions of what's needed where to keep the blood in one place and send it when you have a patient whose life is in danger. It's a vast simplification of the supply chain that actually saves the government money and can save thousands of lives in the long run.
LORA KOLODNY: We talk about drone delivery for convenience. And it's a lot of fun flying a Slurpee across the desert or a burrito to a college campus, but Zipline has the potential to save lives.
Cooperating Drones
Drones are also able to work together to complete tasks. You may have seen the insane “swarm” drone light display at the opening ceremony [13] of the Winter Olympics in Pyeong Chang in 2018. Other applications are being developed such as the three drones working together to build a rope bridge that can support humans in the following (3:26 minute video).
Building a rope bridge with flying machines (3:26)
AI and Drones
Finally, I’d like you to consider how drones are being incorporated with other emerging technology such as artificial intelligence. In the video example below (from Australia!) drones are able to identify swimmers, swimmers in need, sharks, stingrays, and many other things. (2:05 minutes)
Click for a transcript of the Little Ripper Lifesaver video.
[WAVES]
[MUSIC PLAYING]
EDDIE BENNET: Australia has a very long coastline, and that presents us with some unique challenges. Drones provide us with a great opportunity to get a lifesaving service outside of where we traditionally have those services now. In 2015, we used the first drone to fly along a beach and look for people in trouble and to save lives.
We used the drones in three ways. The first is for surveillance. So we're able to get vision and understand situations, understand when people might be getting into trouble. We have warning devices, loudspeakers fitted to the drone so that we can actually warn people that they are about to get into trouble or what to do if they are in trouble. And the third thing is that we can intervene and deploy an automatically inflatable rescue device from the drone which can support up to four people. And it keeps them afloat in the surf, in the water, until they can be rescued.
Earlier this year, on the Central Coast, a sandbank collapsed and 12 people were washed into deep water. A lifesaving drone was sent to the area and quickly located exactly where they were. Lifesavers responded to the area very quickly and all 12 people were saved.
TONI BURKETT: If we could get that longer flying time, it would be really helpful for our job as lifeguards as well as being able to fly in all weather, such as high winds and rain, because that's when we're going to need that aerial perspective. And if the integration of the lifesaving technology in the drones could be improved, such as the sharks' water, that would be really helpful in our jobs as well.
EDDIE BENNET: So if we can use artificial intelligence to help us detect people and respond to situations, then that is going to be a wonderful opportunity to save lives. Little Ripper Lifesaver has very advanced lifesaving drones. Intel has very advanced artificial intelligence. Imagine a world if we combine those two together. What a great opportunity to save a life anywhere in the world.
Work with GIS and UAV Data, Exercise Overview
We've covered a lot so far in this lesson, and now you will start putting things together through an applied exercise. You will be working with GIS and UAV data to help develop situation awareness for first responders and search and rescue teams approaching an impacted area - NOTE that this will be a common theme throughout this exercise. These teams need to know quickly whether it is safe for them to proceed and what the conditions on the ground might be like. Imagine you are a geospatial professional supporting these efforts with existing GIS data and UAV data coming in from the field in near real-time.
Note: You will be setting up some software and downloading some relatively large datasets. Please do this early in the lesson even if you are unable to begin the exercise right away.
Here is a quick overview of what you will be doing and how it links with what we have learned so far.
- Part 1: You will gain experience using UAV-derived data products, in particular very high-resolution orthomosaics and 3D textured mesh models. Three case study areas from Switzerland are examined. Note, these represent situations with the technology and capability to develop these products rapidly and represents the cutting edge of what can be done with drone images and photogrammetry. The imagery you will look at does not come from a place with an active event but, as mentioned above, you will assume the role of a geospatial analyst developing an analysis for first responders and search and rescue teams moving into an area with an active incident. Most of your work will focus on the interpretation of an orthomosaic of a large industrial area. Then, you will consider the additional insights you can get from 3D textured mesh data but focused on smaller areas for the purposes of this exercise.
- Part 2: You will shift your focus to the use of UAV data in the immediate aftermath of the direct hit by Hurricane Irma on the small island nation of Antigua and Barbuda. The imagery is similar to what you examined in Part 1 but is coupled with a high resolution "before" satellite image. You will examine the scope of the damage done to the study area and provide some guidance to search and rescue and damage assessment.
- Deliverable: You will write two short reports for Part 1 and Part 2 that provide advice to emergency responders on what you have observed from the image analysis. As part of this, you will reference and provide some maps/screenshots of relevant parts of the UAV derived scenes.
See the following pages for more details.
Exercise: Part 1, Mapping for Situation Awareness
Introduction
In this section of the exercise, you will work with two types of UAV-derived geospatial products, orthomosaics, and 3D textured mesh datasets. Your goal is to evaluate ways to use these data to support situational awareness for first responders and urban search and rescue teams. For example, think about suggested plans for an evacuation of the area and providing guidance for where search and rescue teams and damage assessment efforts should focus first. Remember to imagine that this is early data coming in from an emergency situation and that you are tasked with quickly providing spatial products for field operations.
Analysis Steps to Support Field Operations with UAS
Import and process UAV mission data using ArcGIS Pro and Pix4D
- Install ArcGIS Pro and Pix4D
You will use ArcGIS Pro and Pix4D to manipulate and interrogate 2D and 3D UAS datasets- You probably have ArcGIS Desktop and ArcGIS Pro already installed. If you don’t, this can take some time, so make sure you do it right away. Contact the instructor if you have any questions.
- You will also need to download and install Pix4D Mapper. Instructions are provided in Canvas.
- Access the Data
I have already processed the raw UAV data with Pix4D for each step in this section because the computing time can be significant. I advise that you do the lesson with the pre-processed data first. However, feel free to experiment with the data processing steps. There is also an optional exercise that will provide an opportunity for you to process the data on your own using Pix4D.- Begin by accessing the data and associated metadata in the OneDrive folder I shared with you via the the emailed link. Let me know right away if you haven't already downloaded the data.
- The datasets include:
- A Pix4D Project named Building Scene -- This is also a 3D Textured Mesh, but in this case, it provides a detailed 3D view of a cluster of buildings.
- A Pix4D Project named Forensic Scene -- This is a 3D Textured Mesh that provides an introduction to what can be done with drone imagery these days. You will contrast this interactive 3D view with the more common 2D view.
- An ArcGIS Pro Project named Orthomosaic Industrial Area -- This is a very high-resolution mosaic of many individual photos taken by the UAV. You will start by interpreting and interrogating this dataset before learning more about how these images are created using photogrammetric techniques in Pix4D.
- Explore the Data
As you copy and unzip these datasets, take a moment to review and identify key information from the metadata document (i.e. the mission report). What do you think is most important to understand about the mission and the data? For example, what is the coordinate system and map projection, and do they match the other datasets you might use?
Pix4D Quick Start
Pix4D is used to develop high-resolution imagery products (2D maps and 3D textured mesh images) based on captured images and their associated location information. So, it is a tool that could be used to develop spatial products in a relatively short period of time. Here, I have provided a quick start tutorial using the buildings dataset.
-
Double click to open the Pix4D project building_1.p4d. If prompted, navigate to the images folder associated with this project.
-
Explore the Map View. This shows the general study area and the locations of where the UAV images were taken, denoted by the red circles. Go ahead and click on one of the circles to see the corresponding image and parameters.
-
Open the Processing Options by selecting the button on the lower left of the display. This is where you set up the parameters for processing the raw imagery. Some of the options for outputs include point cloud, 3D mesh, Digital surface model, or Orthomosaic. There is also a panel that shows Resources and Notifications. You can view the resources available on your computer to do the processing.
-
Look at Processing panel (also at the lower left of the display). This shows the selected options and allows you to launch the model. NOTE: Because Pix4D can be really resource intensive, I have already generated output for you to consider. However, feel free to have a go at running this yourself – it just might take a while.
Now have a look at the processed results and explore some of the options for interrogating the data.
- Select rayCloud view from the left hand options. Zoom in and note what is being displayed – toggle layers on and off.
- Deactivate the Tie Point layer and look at the Cameras layer. This shows you the location and orientation of the camera at the time of acquisition by the UAV.
- Activate the Point Clouds (and Point Groups) layers. This shows the point could be generated from the imagery and location information.
- Activate Triangle Meshes and deactivate all other layers. This 3D textured mesh combines the 3D geometry with the imagery.
- Explore the 3D textured mesh with the available tools in the Navigation and View toolbars.
- Traditional pan and zoom with the standard navigation
- 3D trackball navigation
- Focus on the Selection tool
- View from Top tool
Interrogate 2D Orthomosaic imagery
- Open the ArcGIS Pro Project and have a look at what’s there. Examine the flight trajectory map and refer back to the mission report if you need to. Note the area covered and any variation in the quality of the mission. It is worth noting that you may not have complete coverage of the impacted area. That's where some historical imagery can be useful, as it allows you to provide advice about other potential nearby hazards, e.g., what do you do if the SAR teams are moving into places that are downstream from floodwater or hazardous facilities?
- Note that these high resolution images have already been orthorectified and mosaicked by the drone data processing software (in this case Pix4D Mapper). So, soon after the mission, the data are provided to you in ready-to-use form. There are other courses and training you can do if you are interested in photogrammetry and image processing. There are a lot of services that can do this for you as well, and you have the option to work with Pix4D Mapper below.
- Familiarize yourself with the content of the scene by panning and zooming around the image. Think about the advantages of having such high-resolution imagery when going into an uncertain environment. Start with some general observations about the industrial park, e.g., entrances and exits and then consider specific types of activities that are evident in the imagery through observing things like forklifts, loading areas, and liquid nitrogen stacks.
- Create a point feature class in ArcGIS Pro and map five or more locations within the study area that you think are important for first responders and search and rescue teams to know about. These locations could include things like barriers (e.g., narrow access points, obstacles, dead ends), access points for responders and equipment, or potential hazards. There are no wrong answers here. The point is for you to get a sense for just how much information you can quickly gain from UAV data products.
Interrogate 3D Textured Mesh Data
- In this part of the exercise, you will work with UAV-derived 3D Textured Mesh Data data in Pix4D Mapper.
- You will be using this program as a way to explore the data rather than processing the raw imagery. Processing large UAV datasets can take considerable time (up to several hours) and the idea here is for you to use these products to think about an emergency management problem. That said, in the next OPTIONAL section, you can take a deeper dive and process some imagery yourself if you like.
- You will look at two examples of 3D Textured Mesh models. These are high-resolution 3D models of locations that also have imagery draped over them in an accurate and realistic way. For example, you could move around a building to view a particular exit or even see fine details such as car headlights. Again, consider the implications of having access to this data product for emergency management operations and situation awareness.
- Open the Pix4D Mapper project Forensic-1.p4d
- Go to the Map View. Look at the study area and flight path.
- Go to the Ray View and note the different Layers.
- Toggle each layer on and off and note what each is representing and how it illustrates how the final products are derived. For example, note the camera locations and how they are linked to one another and the derived point cloud.
- Turn off all layers except for the Triangle Meshes dataset. Pan and zoom around the image and make some observations about what you think would be useful for emergency teams with access to this level of detail.
- Repeat these steps with the Pix4D Mapper project Building-1, but consider the greater complexity in this scene from the point of view of supporting emergency response activities.
Part 1 Deliverable
Now you will write a short (400 words + figures) assessment of the situation on the ground as observed in the orthomosaic, keeping in mind your role as a geospatial analyst supporting operations and field teams. Focus mostly on the issues raised when looking at the orthomosaic, as described above, but provide a few insights into the potential advantages of providing 3D products to emergency managers and responders as well.
Submit, along with Part 2, to the GIS and UAV Data Exercise Dropbox.
Later in the course, you will learn about using geoAI and machine learning for rapid, automated assessment of imagery like this. We will also consider how data like this can be delivered more effectively to first responders and others in the field during emergencies.
Exercise: Part 2, Damage Assessment following Hurricane Irma
Introduction
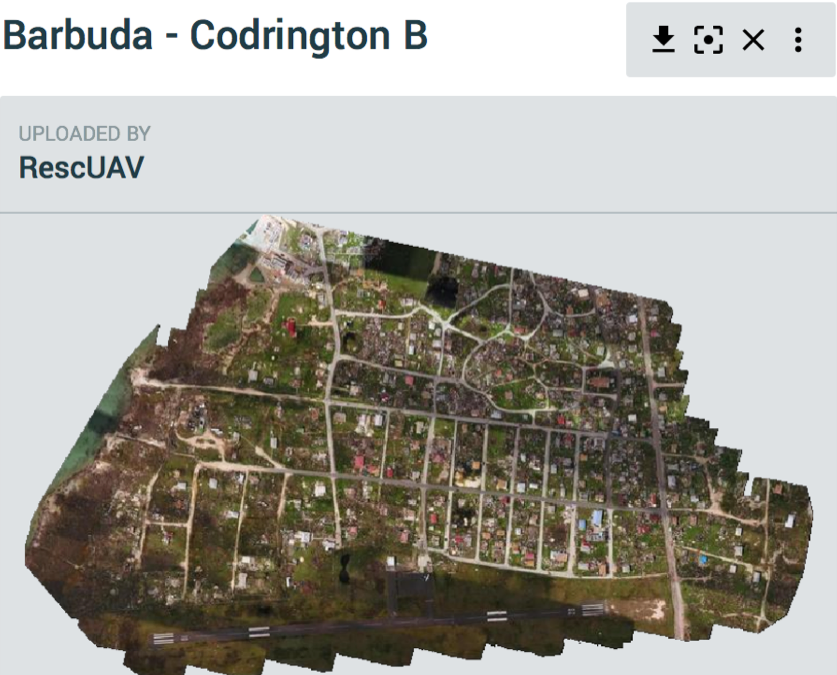
In 2017, Hurricane Irma had devastating impacts on much of the Caribbean, especially the island nation of Antigua and Barbuda. In fact, nearly all of the buildings on the island of Barbuda were destroyed, and almost the entire population was evacuated to Antigua before or immediately after the storm.
For more context, have a quick look at this reporting from the Guardian, The night Barbuda died: how Hurricane Irma created a Caribbean ghost town [19]. If you have trouble with this link, go to the next page in Canvas.
In this section, you will compare UAV imagery collected soon after the hurricane hit with ‘baseline’ satellite imagery taken before the storm. I want you to contrast the type of information you can get from high-resolution satellite imagery with that from an insanely high-resolution UAV mission. Approach this from the point of view of an emergency manager coordinating search, rescue, and recovery efforts in the immediate aftermath of the event. Also, consider the damage evident in the imagery in support of overall damage assessment and teams entering the field.
The data you will be working with came from a Canada-based group called UAViators [20] and it is distributed on OpenAerialMap [21]. If you are interested in this type of data (for your term project?), the OpenAerialMap website might be a good place to start looking.
Steps to follow:
- Begin by accessing the data and associated metadata in the OneDrive folder I shared with you via the the emailed link. Let me know right away if you haven't already downloaded the data.
- Look at the ArcGIS Pro Project that I have created to help support your analysis. There are many different layers in this project, so have a quick look to see what’s there as you consider the specific context in Barbuda. Note the analysis focuses on the main settlement, Codrington. The data have been sourced from:
- Humanitarian Data Exchange [22]
- OpenStreetMap [23] Barbuda
- Global Health Data Exchange [24] – Census Data
- The Caribbean Development Portal [25] – Antigua and Barbuda
- Think about how these easy to obtain datasets can rapidly paint a picture of conditions on the ground and the likely impacts on people and infrastructure. Is there anything major missing data-wise, and do you think you could easily find what you need in a hurry?
- Next, load the satellite and drone imagery.
- The pre-event satellite imagery from Maxxar’s Open Data Program [1] is another source of freely available data for disaster events. You might want to make note of this site when considering your term project.
- As mentioned above, the post-event UAV aerial imagery comes from UAViators [20] via OpenAerialMap [26].
- Have a look at the properties of these two images and note their spatial resolutions, keeping in mind how these may influence the information that can be derived from the image.
Part 2 Deliverable
Write a short assessment of the situation on the ground, keeping in mind your role as a geospatial analyst supporting operations and field teams.
- Conduct a simple visual damage assessment, e.g., what is the extent of the damage?
- Has critical infrastructure (such as ports, roads, key buildings) been destroyed or blocked by debris?
- Develop some broad search-and-rescue advice, e.g., what could you tell teams about conditions on the ground?
- What quick mapping products can you envisage creating from these data that could be distributed to the teams?
Submit, along with Part 1, to the GIS and UAV Data Exercise Dropbox.
Exercise Submission and Grading
For each part of this exercise, you'll write a short assessment of the situation on the ground, keeping in mind your role as a geospatial analyst supporting operations and field teams.
Each response should be about 400 words in length. Together, they are worth 50 points.
Submission Instructions
It is important for you to save your files in the following format so that I can match each submission up with the correct student.
L2_exercise_firstinitialLastName.doc For example, my file would be named "L2_exercise_mBeaty.doc"
Upload your assignment to the Deliverable: GIS and UAV Data Exercise Dropbox (L2). See the Course Syllabus or Calendar for specific due dates.
Grading Criteria
This will be graded out of 50 points and will count towards the Exercise portion of your grade. I will assess it using the following rubric.
| Criteria | Points |
|---|---|
| Content (part 1) You make strong and logical arguments and provide analytical insights. Ideas are well organized, clearly communicated and relevant to the prompt. All criteria are accurately addressed. Supporting details are shared, elaborated upon and demonstrate understanding. Examples are provided, and your essay includes images or other multimedia that support content. |
20 |
| Content (part 2) You make strong and logical arguments and provide analytical insights.[j1] Ideas are well organized, clearly communicated and relevant to the prompt. All criteria are accurately addressed. Supporting details are shared, elaborated upon and demonstrate understanding. Examples are provided, and your essay includes images or other multimedia that support content. |
20 |
|
Clarity and Mechanics (parts 1 & 2) |
10 |
| Total | 50 |
Term Project - Abstract
In Lesson 1, you were introduced to the term project for this class. This week, you will choose one of the project options and decide what your project will cover. Your abstract should be no longer than 400 words. The goal of this exercise is to pave the way for you to write an exemplary term project, therefore, each section of the abstract will be graded on a satisfactory (1 point)/unsatisfactory (0 points) basis.
Your abstract is worth 6 points and should have the following sections and address these questions:
- Problem statement – In concise terms, what is your project about?
- Background – What is the context for your work?
- Objectives – What do you aim to achieve/demonstrate?
- Data and Methods – What data and methods do you anticipate using?
- Implications – What is the significance of your work? How might it be used in Emergency Management?
This week, I would also like you to set up a time to run your ideas by me. I think this will be particularly important with regard to the data component of your project. I can provide you with some feedback on whether the scope of the work seems too big, too small, or just right, and whether I think you’ll be able to get the data you need. This can be a quick discussion or we can take a bit longer if that is helpful.
I know it might be challenging to find a time to meet since we are likely in very different time zones - you probably recall I am based in Melbourne, Australia. That said, there will probably be some overlap where we can set up a voice or video call with Zoom [27]or Skype or communicate via chat. I am fine with getting up early or staying up late to overlap with folks. Have a look at the World Clock Meeting Planner [28] where you can put in your location and my location and see the hours of overlap. Then suggest a time you'd like to talk. I am happy to help with this as well.
Deliverables
Please submit your assignment as a word document to the "Term Project Abstract" dropbox in Canvas. See the Course Calendar in Canvas for specific due dates.
Grading
The goal of this exercise is to pave the way for you to write an exemplary term project, therefore, each of the six sections listed above will be graded on a satisfactory (1 point)/unsatisfactory (0 points) basis for a total of 6 points. You will have an opportunity to revise your abstract after receiving my feedback.
Summary and Final Tasks
Summary
This week, you have been introduced to the range of potential hazards that spatial data science for emergency management must be prepared to handle. In your reading assignment, we began to explore some of the key issues associated with supporting emergency management tasks with geospatial tools. Knowing how to design an effective geospatial system for emergency management depends on understanding hazards as much as it depends on understanding the capabilities and limitations of current geospatial technology.
Now that you have a general understanding of the types of hazards relevant to spatial data science for emergency management, we will begin examining the first of the four stages of emergency management in greater detail. In the next lesson, we will explore the role of geospatial perspectives and technologies for Preparedness activities.
Reminder - Complete all of the Lesson 2 tasks!
You have reached the end of Lesson 2! Double-check the to-do list on the Lesson 2 Overview page to make sure you have completed all of the activities listed there before you begin Lesson 3.
Questions?
If you have any questions, please post to the Canvas Discussion Forum called "General Questions" or email the instructor via Canvas conversations (if the question is personal in nature).