Lesson 4: Introduction to the ArcGIS API for JavaScript
Overview
Overview
Over the rest of this course, we’ll be working with version 4.x of the ArcGIS API for JavaScript. This version represents a major change from the previous one in terms of both coding syntax and what you can do with the API. Probably the biggest upgrade in the API is in the ability to develop 3D apps that run directly in the browser without the need for a plugin. One of the best resources for ArcGIS JS API developers is the API’s software development kit (SDK) found at ArcGIS API for JavaScript. It provides a slew of sample pages that demonstrate how to accomplish various tasks with the API. A good method for learning the API, especially for novice developers, is to find a sample that does something close to what you’d like and modify it to your liking. So we’ll develop our first simple apps by taking that approach.
Objectives
At the successful completion of this lesson, you should be able to:
- import the Esri JS API library into a web page through a content delivery network or downloaded locally;
- understand the role played in Esri's JS API by the Dojo framework;
- describe how Asynchronous Module Declaration (AMD) works;
- understand when to use Esri's main.css vs. view.css files;
- orient yourself to the JS API Software Development Kit (SDK) site js.arcgis.com;
- navigate and interpret the API Reference;
- modify Esri samples in the code sandbox;
- list the most important classes in the API (Map, MapView, SceneView) and describe the relationships between them;
- incorporate web maps like you created in Lesson 1 and web scenes into a JS app;
- navigate a 3D scene;
- set object properties through their constructor or after initialization;
- use autocasting to avoid explicitly importing certain modules
Questions?
If you have any questions now or at any point during this week, please feel free to post them to the Lesson 4 Discussion Forum. (That forum can be accessed at any time by clicking on the Discussions tab.)
Checklist
Checklist
Lesson 4 is one week in length. (See the Calendar in Canvas for specific due dates.) To finish this lesson, you must complete the activities listed below. You may find it useful to print this page out first so that you can follow along with the directions.
| Step | Activity | Access/Directions |
|---|---|---|
| 1 | Work through Lesson 4. | Lesson 4 |
| 2 | Complete the two-part "Plot Your Hometown" project. On your e-portfolio index page:
|
Follow the directions throughout the lesson and on the "Plot Your Hometown" page. |
| 3 | Take Quiz 4 after you read the online content. | Click on "Lesson 4 Quiz" to begin the quiz. |
4.1 Use the API to Create Your First 2D Map
4.1 Use the API to Create Your First 2D Map
As mentioned earlier, modifying existing sample code is a common way to begin learning a new programming language or API. Thankfully, Esri offers a "sandbox" environment for experimenting with the samples found in their SDK. Let's use this sandbox to start our work with the API.
- On the SDK home page, click on the Sample Code tab.
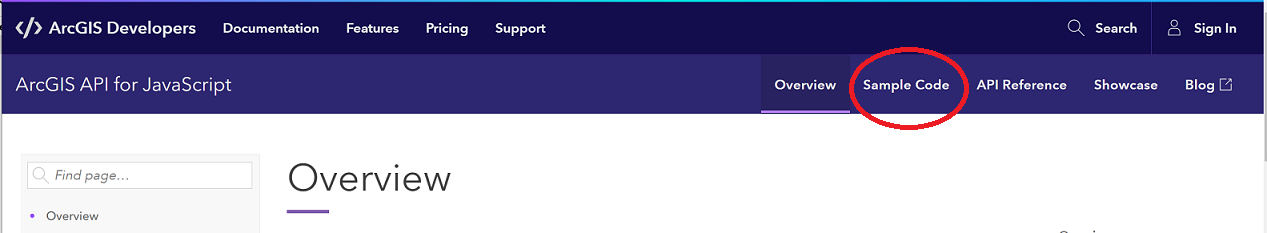 Figure 4.1 Accessing the Sample Code area of the ArcGIS Javascript API SDK
There you should see a list of Get started... samples. - Click on the Intro to MapView (2D) link. Like the other Samples pages, you should see a map embedded at the top of the page. Beneath the map, you should see buttons labeled Explore in the sandbox, Open in CodePen, View live and Download ESM sample.
- Click the Open in CodePen button. CodePen shows you the same map you just saw at the bottom of the page and the source code that produces that map on the top. The size of the "Preview" panel can be adjusted by dragging the horizontal bar separating that panel from the source code panels up or down. The power of CodePen is the ability to modify the source code and quickly see the result.
CodePen is built to encourage the separation of HTML, CSS, and JS code (a good development practice) with separate panels for each. However, note that it's OK to include CSS and JS in with the HTML, which is what happens when you open an Esri sample in CodePen.
Also note that it's possible to reconfigure CodePen such that the code panels are on the left or right rather than on the top. (I prefer having them on the left and the Preview panel on the right.) Making this change is done by clicking the Change View button (found next to the Settings button).
The sample is coded so that the map is centered over Scandinavia at a zoom level of 4. What if you wanted to display the United States instead? That’s easy! - Modify line 30 (or thereabouts - as the documentation does occasionally get updated) so that the MapView’s center property is set to a lon/lat array of [-95, 40]. You should see that the Preview panel automatically updates as you edit the code. I find this to be annoying when working on map pages, so I go into Settings > Behavior, and toggle the Auto-Updating Preview setting to off. When making this setting, you'll need to click the Run button to see the result of your code changes.
Now, let’s say you wanted to use a different basemap. - Change line 23 so that the Map’s basemap property is set to "terrain" and again click the Run button. As you can see, the CodePen sandbox makes it very convenient to “play around” with the code samples.
Note: We’ll see shortly how you’d know what other values can be used to set the basemap property.
4.2 Use the API to Create Your First 3D Map
4.2 Use the API to Create Your First 3D Map
An exciting feature of version 4 of Esri's JavaScript API is its support for 3D scenes. Let’s have a look at a basic 3D sample.
- Go back to the Sample Code Overview page and click on the Intro to SceneView (3D) link.
- Using the same approach that you used for the 2D map, view the sample code in the CodePen sandbox and change the map’s center to the same coordinates and the scale to 4000000.
Note: Most of you have probably explored a 3D map like this one, though you may not be aware of all of the navigation options available to you. Read about the various mouse and keyboard controls and their associated effects in the documentation of the SceneView class, and be sure to try them out!
Also note that in addition to the Open in CodePen option, the sample pages also offer an Explore in the sandbox option. This is Esri's own sandbox for experimenting with their samples, much like CodePen.
4.3 Separate Your HTML, CSS and JS Source Code Using CodePen
4.3 Separate Your HTML, CSS and JS Source Code Using CodePen
The samples in the SDK are written with the CSS and JavaScript code embedded within the HTML code. This is fine for simple apps, but for more complex apps it is recommended that you write the CSS and JavaScript in separate files. Among the benefits to this approach are:
- improved organization, making it easier to find your CSS or JS code rather than having to hunt in your HTML code for it;
- the ability to reuse code that is applicable across projects;
- shorter page load time through caching of the external files; and
- the ability to “minify” the code, making it a smaller download for client devices.
Let's revisit the Intro to MapView (2D) sample in CodePen, looking to follow a code separation approach.
- Return to CodePen. (Here's the CodePen homepage if you no longer have the earlier samples open.)
- If you don’t yet have a CodePen account, click the Sign Up button and supply the info needed to establish a free account.
After signing up, your browser window should open up to a new Pen (environment for authoring a new web page). - Click the Change View button in the upper right and select your preferred Editor Layout option.
- Click the Save button. This will give your pen a randomly generated name (in the upper left).
- Click on the pencil icon to the right of the pen name and assign it a new name of hello_map.
- Go back to the Intro to MapView (2D) sample sandbox. Copy and Paste the three components of the sample into their respective panels in CodePen. Note the following:
- You should omit the DOCTYPE declaration from the HTML piece.
- Do not include the style and script tags surrounding the CSS and JS code, respectively.
- Make sure that the <script src=....></script> tag is in the HTML window
- You may find it most convenient to copy the complete sample (CSS and JS included) to the HTML panel, then cut and paste the CSS and JS pieces to their respective panels. (You can remove the empty style and script elements from your HTML when done.)
- The code panels are resizable; if you’ve set the Editor Layout such that the code panels are arranged vertically to the side of the Preview panel, note that you can double-click on any of the panel headings to maximize that panel.
4.4 Move Your Code to .html, .css, .js files
4.4 Move Your Code to .html, .css, .js files
Playgrounds like Esri’s JS SDK sandbox and CodePen are great tools for experimenting with samples and developing your own apps from scratch, but when you want to “go live” with an app so that others can use it, you’ll want to host your code on a web server. You used a web hosting service in the previous lesson and we’re going to use that service again now.
When building apps, a convention that many developers follow is to create a folder on the web server for their site/app, and into that folder place an HTML file called index.html (or default.html). For example, in building my “app_to_end_all_apps” site, I’d create a sub-folder by that name in my www folder, then upload my app’s HTML markup in a file named index.html to that sub-folder. I could then view my app using the URL: http://detwilergeog863.000webhostapp.com/app_to_end_all_apps/. (Note: This app doesn't actually exist, so you should expect a File Not Found error if you follow the link.) I could omit the index.html from the URL since browsers are built to look for a file by that name when the URL ends in a folder.
- On your computer, wherever you’re storing your coursework, create a folder called hello_map. (The name for this app is a play on computer programming's Hello, World tradition.)
- Create a new blank text file, copy your HTML code from CodePen into that file, and save it as index.html in your hello_map folder. Be sure to add a <!DOCTYPE html> line at the top of the file to declare your code as HTML 5.
- Create another blank text file, copy your CSS code into that file, and save it as main.css, again in the hello_map folder.
- Finally, create a third text file for your JS code. Call it main.js.
Unlike the CodePen environment, the end user’s browser won’t know that there is a CSS file and a JS file that goes along with the HTML file unless you tell it. - To reference your CSS code, add the following line above the line that references Esri’s main.css stylesheet:
<link rel="stylesheet" href="main.css"></link>
- To reference your JS code, add the following line after the line that references Esri’s JS API:
<script src="main.js"></script>
Note: These references use relative paths to locate the files; the browser will look for the files in the same folder as the HTML file since no folders were included in the paths. Because the architecture of this app is not particularly complicated, I’m directing you to store all of the files together. But you should keep in mind that many developers prefer to store their files in sub-folders (e.g., css/, js/ or styles/, scripts/) for organizational reasons. - Open this local copy of your app in a browser (right-click on the file in Windows Explorer and select Open with). As you develop your app, you can leave it open in your browser and Refresh (F5) whenever you want to see the result of your changes.
- To publish your app to a public facing location, open a connection to your www space on the 000webhost web server (using either FileZilla or your webspace file manager).
- Replicate the directory structure you have locally by creating a folder called hello_map.
- Upload the three files associated with the app to that folder.
- Test the app by pointing your browser to <yourwebspaceURL>/hello_map, replacing <yourwebspaceURL> with your website you created in the ePortfolioname.
For extra practice, go through the process of copying the 3D sample code to CodePen and then create a site called hello_scene in your web space.
4.5 Dissecting the Esri Samples
4.5 Dissecting the Esri Samples
Now that you’ve had a chance to dive right into building your own map apps, it’s time to learn more about what’s happening in those apps before you can go further with the API. Let's examine these start-up pages and discuss their HTML, CSS and JS pieces, beginning with the HTML of the 2D sample. Be sure to open up each of the three files so you can follow along with the discussion.
4.5.1 The HTML
4.5.1 The HTML
After completing the previous lesson, you should recognize the <html>, <head> and <body> tags. You should also recognize that the <!DOCTYPE> directive declares that the document is written as HTML 5.
The <head> of the document contains two <meta> elements. The second of these is concerned with rendering the document in a user-friendly way across a variety of devices (part of the larger CSS topic of responsive web design). This is not critical for you to worry about now, but you may want to return to this topic if you are developing for mobile phones or tablets. The first meta element specifies that your document is encoded in the UTF-8 character set, one that supports all of the world's major languages. It's a good idea to include this line verbatim in all of your map pages. If you're an insomniac, you may want to read more about character encoding.
The <head> also contains the page’s title, links to two external stylesheets (your own main.css file and Esri’s main.css file), and two script elements (one referencing the Esri JS API and the other your local main.js file). We’ll discuss the CSS and JS source code in detail shortly.
Next in the HTML file comes the body of the document, in which the only thing you'll find is a div element. This element is used to create a division, or section, in a document. In a web mapping context, a div is typically used as the container for the page's map. Note that this div is assigned an id (viewDiv).
4.5.2 The CSS
4.5.2 The CSS
Looking at your main.css file, there are three elements being styled: the html element, its child body element, and the element having the id of viewDiv (indicated by the pound sign). Each element has four property settings applied to it. The height and width settings specify that the element should take up all of the space of its parent container. The padding and margin settings specify that there should be no white space inserted on the inside or outside of the element, respectively. Basically, these styles produce a map filling the entire browser window.
4.5.3 The JS
4.5.3 The JS
Learn More
At this point, you should familiarize yourself with the syntax of JavaScript (JS). The w3schools site offers a good hands-on JavaScript tutorial that should do the job. Take a couple of hours to work through the topics listed under the JS Tutorial heading and pay particular attention to the following points:
- Ending statements with a semicolon is optional. (The Esri samples use them.)
- Note the difference between placing JS code inside the page's head section and its body section. See also this discussion of JS code placement.
- JavaScript is a dynamically typed language; you do not need to specify a data type when declaring a variable.
- JavaScript variables are case sensitive.
- Variables can be initialized on the same line that they are declared.
- Code associated with a conditional statement (if or else statements) or a loop (for or while) must be enclosed in braces.
- Alert boxes can be used to debug scripts that aren't working properly.
- JS functions are reusable blocks of code with an optional return value.
- The backslash (\) can be used to insert special characters in a string (e.g., if you want a string enclosed in double quotes to also contain a double quote).
- Comments are signaled in JS using two slashes (//).
Now that you've learned a bit about JavaScript, we can examine what’s happening in the main.js file.
AMD
The first thing you should notice is that all of the code is wrapped inside a require() function. This is a result of the fact that Esri’s API is built around a JS toolkit called Dojo. Dojo uses a design pattern called Asynchronous Module Definition (AMD) to load JS resources into memory. By defining their API’s object classes in modules, Esri’s made those classes easier to maintain and re-use. Loading the modules asynchronously (in parallel rather than one at a time) means that apps built on the API will load faster than they would in a non-AMD framework. One of your recurring tasks as an Esri JS developer will be to identify the modules containing the object classes needed by your app.
In the case of the 2D sample, two Esri classes are needed: Map and MapView. These classes are accessed by loading the esri/Map and esri/views/MapView modules, respectively. The list of modules at the beginning of the require() function is then followed up by an anonymous callback function. The function is anonymous, in that it has no name. It’s a “callback” function because Dojo's module loader will call back to the function when it's done loading the modules, passing module references to the function.
In order to work with the classes held in the modules being loaded, the callback function contains a list of parameters that corresponds to the list of modules. In the 2D example, only the esri/Map and esri/views/MapView modules are required, so the only parameters defined in the callback function are Map and MapView. We’ll see other parameters associated with other modules in more complex examples later. Some notes on the callback function parameters:
- The module loader will pass the module references as arguments to the callback function in the same order that the modules were listed.
- The naming of the parameters is up to you, though the accepted practice is to name them the same as their corresponding modules.
- As with parameters in any JavaScript function, you can go on to use the parameter as desired in the body of the function.
 In the 2021-22 time frame, Esri's samples switched to a "fat arrow" syntax for function declarations. For example:
require(["esri/Map", "esri/views/MapView"], (Map, MapView) => { }
This syntax is a bit more concise than the previously used syntax:
require(["esri/Map", "esri/views/MapView"], function (Map, MapView) { }
I've attempted to update my own examples to be consistent with Esri's change, but you may still see the old syntax in places. If so, no need to worry. They are equivalent syntaxes for declaring a function. You'll also see some of Esri's samples using the old style too.
The DOM
An important web browser technology relied upon by Esri's JS API is the Document Object Model, or DOM. This is a tree-like representation of a web page that the browser creates whenever it loads that page. The DOM provides the means for JS developers to manipulate a page’s contents and behavior programmatically. In the case of developing an Esri JS app, the DOM is needed to insert a map or scene onto the page. SInce the require() callback function references DOM objects, it is critical that the DOM is loaded before the callback executes. However, we don't have to worry about this because require() has built-in functionality that waits for the DOM to finish loading before executing the callback function.
Code samples in older incarnations of the API documentation included another module called domReady! This is a Dojo module that is used to ensure that none of the code that follows in the callback function is executed until the DOM has finished loading. The fact that Esri removed references to domReady! in their samples implies that there's no longer -- or never was -- a need to worry about the callback function code executing before the DOM was done loading. In any case, I mention it here in case you run into it either in Esri's or this class's samples. Since the domReady! module -- also referred to as a plugin in Dojo's documentation -- doesn't have a meaningful return value, you'll note that it doesn't have a parameter to go with it in the callback function parameter list.
Learn More
Once again, the w3schools site offers a good JavaScript HTML DOM tutorial. This short tutorial should only take you 30-60 minutes to complete.
Using the API Reference
Earlier in the lesson, we visited the Esri JS API SDK to locate sample code that could be used to create our first apps. Now, let’s have a look at an equally important part of the SDK: the API Reference. The API Reference contains a list of all the API modules down the left side of the page. Each module heading can be expanded to see the classes defined in that module. For example, we’d find the Map class in the esri module and the MapView class in the esri/views module.
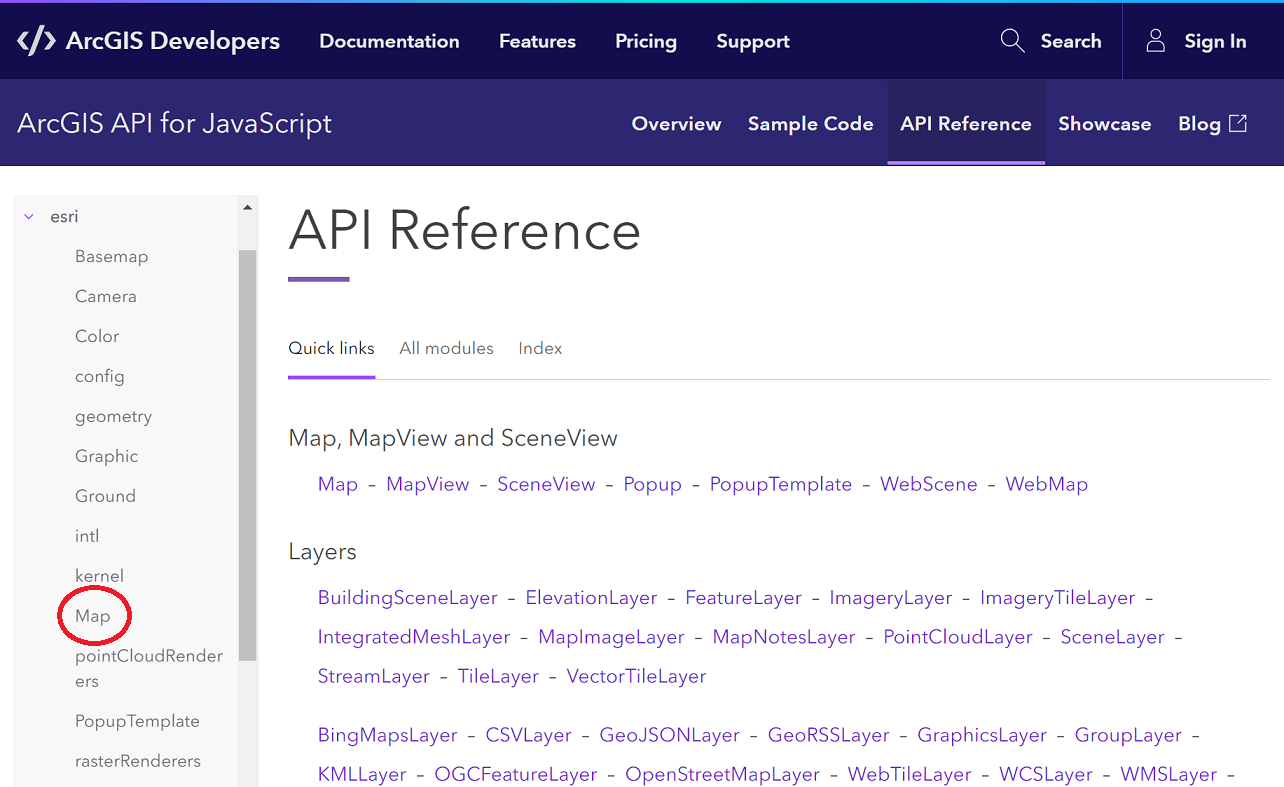
On the right side of the API Reference index page is a list of commonly used classes, generally organized from top to bottom in order of importance. We’ll cover most of these classes over the course of the term.
The first line of JS code in our 2D sample creates an object of the Map class (new Map). We can learn about that class by clicking the Map link on the API Reference index page or by entering Map into the Find page box.
Like the other class description pages in the API Reference, the page for the Map class conveys a lot of useful information:
- how you’d go about referencing the class in your code’s require() declaration
- an overview of the class (what it’s used for, a code snippet showing its usage, and links to samples and related classes)
- the class’s constructors (more on this shortly)
- the class’s properties (characteristics that uniquely define Map objects)
- the class’s methods (actions that the Map class is programmed to perform)
The Properties section of the page includes an Overview, listing all of the properties in alphabetical order along with their type (e.g., String, Number, or some object class). The property type is important to know as it tells you what you can expect to get back if you read the property (or conversely, what you need to supply if you’re setting the property). After the Overview, you’ll find a section of Details, providing more specifics on the class’s properties. For example, the details on the basemap property provide a list of acceptable values, along with a thumbnail of each.
The Methods section likewise includes both an Overview and Details section. Method parameters (pieces of information the method uses in performing its action) are listed in parentheses after the name in the Details section. If a parameter is optional, it will be listed with a question mark next to it. If a method returns a value when it is called, the method parameters will be followed by an arrow symbol pointing to the return type. Looking at the Map class methods, the add() method has a required parameter (layer), an optional parameter (index, specifying the position in the Map’s layer collection where you want the layer to appear), and no return value. The findLayerById() method has a required layerId parameter and it returns a reference to a Layer object. Note that when a parameter or return value is an object, it will appear in the documentation as a link. This helps you to navigate through the SDK as you write your code.
The part of the class documentation that we glossed over was the Constructor section. This section is intended to provide guidance on how to create a new object of the class. This is done by using the word new followed by the name of the class and a set of parentheses. In some APIs (including version 3.x of Esri’s JS API), it is possible to set just certain properties of the object you’re creating as part of the constructor statement, making it important to consult the Constructor section of the class’s documentation. However, in version 4.x, any of the class’s properties can be set as part of the constructor, which is why you’ll note that the Map class constructor says simply properties? within the parentheses.
Whatever properties you decide to set in the constructor should be expressed as a JS object literal, a term that may seem intimidating, but is actually not too difficult to grasp. Object literals are basically a list of property-value pairs, in which the list is enclosed in curly braces and the property-value pairs are separated by commas. In the case of the 2D sample, the Map was constructed with just a single property-value setting (the basemap), whereas in the 3D sample, it was constructed with two property-value settings (the basemap and the ground).
Note that you need not set all properties as part of the constructor. For example, I could rewrite the 2D sample as follows:
const map = new Map();
map.basemap = "streets";
Or the 3D sample as follows:
const map = new Map({
  basemap: "streets"
});
map.ground = "world-elevation";
One last word on constructors... When creating an object, you’re typically doing so because you need it later in your script. Thus, you will usually store a reference to the object you’re creating in a variable. In the samples, the new Map object was stored in a variable called map. That variable was later used to set the map property of a MapView object. Having multiple entities in a script with the same name can be confusing, especially for beginners, so I like to assign variable names that don’t duplicate the name of a class or property. In this case, I might use myMap or theMap. Keep in mind though that this means updating other statements in which that variable is referenced:
require([
  "esri/Map",
  "esri/views/MapView"
], (Map, MapView) => {
  const myMap = new Map({
    basemap: "streets"
  });
  const myView = new MapView({
    container: "viewDiv",
    map: myMap,
    zoom: 4,
    center: [15, 65]
  });
});
And finally, one more aspect of the Esri samples that has changed over time is in the way references to objects are stored. In the past, the samples created variables to store references to objects using the var keyword. Today, you'll see that the samples now typically employ the const keyword in place of var. As you might have guessed, const is short for constant. It is called for when you want to store an object (or primitive value, such as a number or string) in memory for use later in your code, with the important caveat that a constant can never be reassigned a new object or value. That's in contrast to variables, which as the name implies, can be reassigned a new object or value (i.e., they're allowed to vary). In the short snippet above, for example, the const myMap and const myView statements were previously written as var myMap and var myView. Using var still works and is not wrong, but if myMap is always going to refer to the same Map object, it's more appropriate to declare it as a constant.
In thinking about the difference between const and var, it's important to note that while you can't assign a new object to a constant after you've declared it, you are allowed to set properties of the object to new values. In other words, if you were adding code to the snippet above, you would not be able to do this:
myMap = new Map({...}); //or const myMap = new Map({...});
but you could do this:
myMap.basemap = "terrain" //same object, just altering a property
If you really wanted to create a new Map object and store it in myMap -- recycling that space in memory, if you will -- you could certainly do that. You'd just need to declare myMap using var rather than const. Similarly, if you want to store the number 2 in x and later change x to 3, you would need to declare x using var rather than const.
Lastly, you'll see that the course text generally refers to all named spaces in memory as variables, even those declared using const. Technically, anything declared using const should be referred to as a constant, but the term variable is so commonly used in programming that I hope you will excuse the imprecise language. Just keep in mind that most of these named spaces are actually constants, not variables.
4.6 Maps, Scenes and Views
4.6 Maps, Scenes and Views
We’ve already been exposed to the Map, MapView and SceneView classes in experimenting with and discussing the Esri samples. Now, let’s learn some more about these fundamental classes.
In version 4.x of Esri’s API, the Map class is used to store a basemap and layers. The actual rendering of the Map on the page is done through the use of a View: either a MapView (2D) or a SceneView (3D). If you look back at the two samples we’ve been working with, you’ll note that a Map object is created and its basemap property set in both cases. The only difference is that in the 3D example, the Map’s ground property is set in addition to its basemap. Setting the ground property renders the map such that the underlying terrain can be seen. The property can be set to “world-elevation” to use Esri’s default world elevation service, but it is also possible to use other elevation layers. (Setting the ground property in a Map that is displayed in a MapView has no effect since the MapView class only renders Maps in 2D.)
The other commonly used property of the Map class is its layers property. We’ll look at adding layers to a map in depth later in the course.
Looking at the documentation of the MapView class, you’ll see that it contains a whole host of properties. The most commonly set MapView properties include:
- map: set to an object of the Map class
- container: set to a string matching the id of an element on the page (or to a reference to the element itself)
- center: set to an object of the Point class
- zoom: set to a number, typically ranging from 3 (small scale)-18 (large scale)
- rotation: set to a number ranging from 0 to 360 degrees to rotate due North
Note that while center and zoom are commonly used to specify the part of the Map that’s currently visible, it’s also possible to do so using the extent and/or scale properties. Take care that you’re setting these properties logically. As explained in the documentation, if both the zoom and scale are set, then the scale setting will override the zoom setting. Similarly, an extent setting will override any center, zoom or scale setting.
3D SceneViews have the same set of properties as listed above, with the exception of rotation.
While it’s typical for a page to contain just a single View, you should keep in mind that you’re not limited to that sort of layout. It is sometimes useful to employ multiple views on the page, as in this sample that contains both a MapView and a SceneView.
4.7 Adding Overlays to a View
4.7 Adding Overlays to a View
The maps we’ve created so far have been pretty boring, so let's spice it up a tiny bit by plotting a point. We’ll see later in the course how to display features stored in one of Esri’s vector data formats. What I’m talking about doing right now is how you’d display a small number of geometries (points, lines or polygons) whose coordinates you’ve hard coded into the app, or perhaps acquired through user input.
- Create a copy of your hello_map folder (and its files) called lesson 4.
- Set the HTML doc’s title to Plotting a point.
Adding geometries the way I’m describing here involves creating one or more objects of the Graphic class. - Look up the Graphic class in the SDK using the Search box. (The result you want is the class found in the esri/Graphic module.)
As the overview explains, important properties of the Graphic class are geometry, symbol, and attributes. Attributes are important in situations where you want the user to be able to click on the graphic and see information about it in a popup window. We’re going to keep this simple, so we’ll focus on just the geometry and symbol, starting with the geometry.
Looking at the geometry property's description, you should note that in order to set it, you need to use a Geometry object. - Click on the Geometry link to go to that class's documentation page.
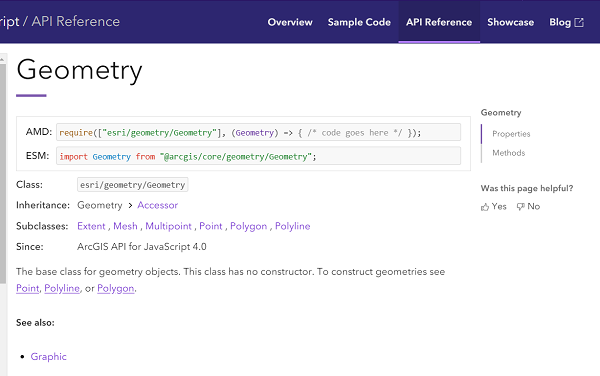 Figure 4.3 The Geometry class description in the API Reference
Its description tells you that it’s a "base class" and that it has no constructor. What this means is that you can’t create a plain Geometry object. You’d have to create a Point, Polyline or Polygon object instead. The Geometry class exists in the abstract as a way to define the properties and methods that the Point, Polyline and Polygon classes share in common (such as the extent property). (You might find it helpful to think of cars as an analogy. If you’re shopping for a new set of wheels, you don’t just buy a generic car; you buy some model of Ford, Toyota, Volkswagen, etc.)
In object-oriented programming terminology, the Geometry class can be described as the parent class or super-class of the Point, Polyline and Polygon classes (which are themselves child classes or sub-classes). These class relationships are conveyed at the very top of the class pages in the SDK. (Look for the Inheritance and Subclasses headings.) It turns out that you’ll find all of the properties and methods the Point, Polyline and Polygon classes inherit from Geometry on their pages. Not all SDKs are written this way (i.e., the SDK could have been organized such that you’d have to view the property and method lists on both the Point and Geometry pages to know all Point capabilities). - Getting back to our task, we know we want to add a point to the map, so follow the link to the Point class.
The Point class has several properties, but the ones we want here are latitude and longitude. - To the bottom of your JS code, add the following:
const pt = new Point({
  latitude: 40.792,
  longitude: -77.871
});
We’ve created a Point geometry for our Graphic, but have we forgotten something? Yes, if we want to work with the Point class, we need to include a reference to its module in our require() declaration. - Move to the top of your JS code and add "esri/geometry/Point" to the module list, then add Point to the callback function argument list (making sure you match its location in the list with the module’s location in the module list).
- With the Point geometry created, let’s move on to the symbol. In the SDK, make your way back to the Graphic class’s property list.
The symbol property must be set using a Symbol object. Following the Symbol link, you should note that, like the Geometry class, Symbol is an abstract parent class for several child classes. We’re trying to symbolize a Point here, so the subclass we need is MarkerSymbol. (We’d need LineSymbol for a Polyline and FillSymbol for a Polygon.) - Follow the MarkerSymbol link in the list of subclasses.
Reading over the MarkerSymbol class description, you should note that it is itself another abstract parent class, having subclasses PictureMarkerSymbol and SimpleMarkerSymbol. If you wanted to depict the point using some kind of graphic stored on disk, then you’d use the PictureMarkerSymbol class. We’ll keep our app simple by using the SimpleMarkerSymbol class, which will allow us to choose from a set of predefined shapes and apply a desired color and size.
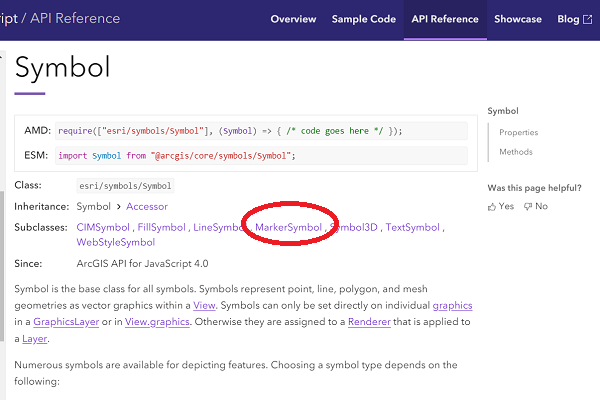 Figure 4.4 Accessing the MarkerSymbol class in the API Reference
 - Follow the SimpleMarkerSymbol link in the list of subclasses. Read over the class description and note the color, size and style properties.
- Create a new SimpleMarker as follows:
const sym = new SimpleMarkerSymbol({ color: "blue", style: "square", size: 12 }); - Update your require() declaration so that this newly added SimpleMarkerSymbol code will execute properly. Hint: the information you need is at the top of the class page in the SDK.
- With the geometry and symbol created, we’re ready to create a new Graphic object:
const ptGraphic = new Graphic({ geometry:pt, symbol:sym }); - We saw earlier in the lesson that the Map class has a method called add() for adding a layer. One way we could accomplish our goal here would be to add this Graphic to a new GraphicsLayer, then add the GraphicsLayer to our Map. However, a slightly easier alternative is to take advantage of the fact that the MapView has a graphics collection associated with it. We can simply add our Graphic to that collection as follows:
view.graphics.add(ptGraphic);
- Be sure to modify your require() declaration so that the browser will be able to find the Graphic class you just referenced.
- Test your app and confirm that a blue square is added to the map.
With that, you've reached the end of this lesson's content. Move on to the next page to access the assignment associated with this lesson.
Assignment: Plot Your Hometown
Assignment: Plot Your Hometown
The coding assignment for this lesson is in three parts. Here are some instructions for completing the assignment.
Part I
In an earlier course in our curriculum, you may have learned about the United States Geological Survey's Geographic Names Information System and the Getty Thesaurus of Geographic Names (for places outside the U.S.). Use those tools or any other resources at your disposal to locate the latitude/longitude coordinates of your hometown. (One handy way to get a location's coordinates is to pull it up in Google Maps, right-click on the location and select What's Here?)
Modify the lesson4 app code from earlier in the lesson so that the map is centered on and a marker points to your hometown. The easiest approach to this problem would be to insert your hometown coordinates in both lines of the script where coordinates are found. However, I hope you'll recognize that repeating values in different parts of a program is generally a bad practice because of situations like this where you end up having to make revisions in multiple places. So, while you're changing the location displayed on the map, revise the code so that it is as efficient as possible.
Part II
As you know, one way that web maps convey information to the user is through popup windows. We saw in Lesson 1 that layers can have popups configured using GUI-based tools in ArcGIS Online. In the next lesson, we'll see how the API makes it possible to easily incorporate layers and maps configured in ArcGIS Online into an app. And later we'll see how to configure layer popups programmatically. In this lesson, we've dealt with graphics, which don't have an attribute table associated with them. However, it's still possible to code the display of popups when the user clicks on a graphic.
For Part II, I'd like you to create a copy of the app from Part I and modify it so that clicking on a town marker will display some information about it (e.g., its name, population, when it was established, etc.). We haven't covered how to do this, but it is something that's demonstrated in an Esri code sample. You might be tempted to search the Sample Code area of the SDK for "popups," but all of the samples with that tag involve data layers rather than graphics. The sample I'm thinking of can be found under Graphics in the list of Sample Code categories.
Part III
Create a pen in CodePen that contains your code from either Part I or Part II (your choice).
Deliverables
This project is one week in length. Please refer to the Canvas course Calendar for the due date.
- Post the app containing your hometown map to your e-portfolio. (30 of 100 points)
- Post the app that displays popup info for your hometown to your e-portfolio. (30 of 100 points)
- Provide a link to your CodePen map -- or embed the pen itself -- in your e-portfolio. (20 of 100 points)
- Below one of your maps (or on your e-portfolio index page), include some reflection on what you learned from the lesson and/or any concepts that you found to be confusing (minimum 200 words). (20 of 100 points)
- Click on the Assignment 4 Submission to submit a link to your project page. (A link to your e-portfolio index page is OK too if it contains a link to your project.)
- Complete the Lesson 4 quiz.
Note: The examples you've seen so far are all likely to have shown the div element used to display the map/scene filling the whole browser window. You could add your reflection text beneath that div, but the map would still fill the whole window and it may not be immediately clear to the viewer that there was content below the map. It's probably a better idea to shrink the height of the map div to something less than 100%. If you're unsure how to go about this, here is an example that demonstrates one approach to including text on the page with the map.
Summary and Final Tasks
Summary and Final Tasks
In this lesson, you built your first apps using Esri's JavaScript API. Even the simple map that you created involves a number of different technologies (HTML, CSS, JavaScript, the Document Object Model, and the Dojo JavaScript framework) and it is important that you have a firm understanding of this material before moving on. If you skipped over the w3schools tutorials referenced in the lesson, be sure to go back and complete them. You might also use any free study time to work through other JavaScript references such as the ones recommended in the syllabus.
In Lesson 5, you'll see how to spice up the rather dull product of Lesson 4 by adding data layers. You'll also learn about a number of coding tools and strategies that will help you as a JavaScript developer.