Note: This page walks through creation of the same web map as the previous page, just with the "Classic" version of the ArcGIS Online Map Viewer. You're welcome to skip over this page if you've already completed the Jen and Barry's web map on the previous page.
1.1 Building a Web Map
Several GIS technology vendors provide the means for non-programmers to create web maps without writing any code (e.g., Google's My Maps, CartoDB, ArcGIS Online), and the capabilities of these map authoring applications are increasing constantly. In this part of the lesson, we will explore Esri's ArcGIS Online.
- Go to the Penn State home page at ArcGIS Online and click the Penn State WebAccess button to authenticate.
- Click on Map to begin work on a new map. If this opens some other map you've worked on previously, select New Map (top right) to start with a clean slate.
If you completed GEOG 483, your first hands-on GIS project involved helping "Jen and Barry" find the best place to open an ice cream shop in a parallel universe where the cities and counties of Pennsylvania have different names. We're going to work with the data from that scenario again here (and later in the course), since it contains examples of each geometry type and some good attribute data for demonstration purposes.
- Download and unzip the Jen and Barry's data. (Even if you still have these shapefiles from an earlier course, you may want to download this copy since the shapefiles are zipped and ready for upload to ArcGIS Online.)
This zip file contains a point shapefile (cities), a line shapefile (interstates) and two polygon shapefiles (recareas and counties). You can check out these shapefiles if you haven't encountered this scenario before, but hang on to the zip files since we'll be uploading them to ArcGIS Online.
- In ArcGIS Online, click the Add menu, then select Add Layer from File.
As explained in the dialog, this option enables you to upload zipped shapefiles, delimited text files, and GPX (GPS interchange) files. Note the other options for adding data in this menu. We'll use them later.
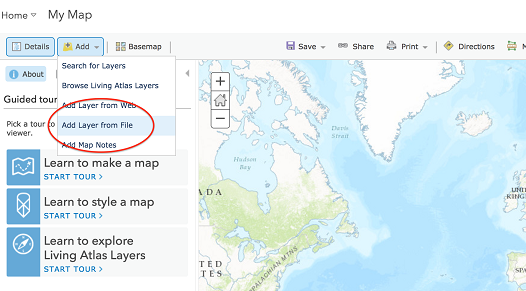 Figure 1.1 The Add Layer from File option in ArcGIS Online
- Click the Browse button, then navigate to your copy of the Jen and Barry's cities zip file.
- Accept the default Generalize features option.
We're importing these data purely for display purposes, so it makes sense to take advantage of the improved drawing speed that generalization provides. If we were conducting analysis that relied on highly accurate feature geometries, we would select the Keep original features option instead.
- Click Import Layer to complete the upload process.
ArcGIS Online will automatically get you started symbolizing your data by providing a two-step dialog for styling the cities layer. The first step involves selecting an attribute to show, while the second presents drawing style options based on the selection made in the first step.
By default, the layer is shown as graduated symbols based on the POPULATION column using the "Counts and Amounts (Size)" option. Note that symbolizing the cities with a color ramp would be done using the "Counts and Amounts (Color)" option. Let's change the display of the cities so that they are all drawn with the same symbol.
- Under Choose an attribute to show, select Show location only.
- Under Select a drawing style, default is Location (single symbol), select OPTIONS.
We'll change the symbol used for the cities in a moment, but first notice that it is possible to set the transparency and the scale range at which the layer is visible on this panel.
- Click Symbols.
Select any icon that grabs you. Note that there are a number of icon categories, that it is possible to customize the icon's size, and that you can also use your own image as the icon.
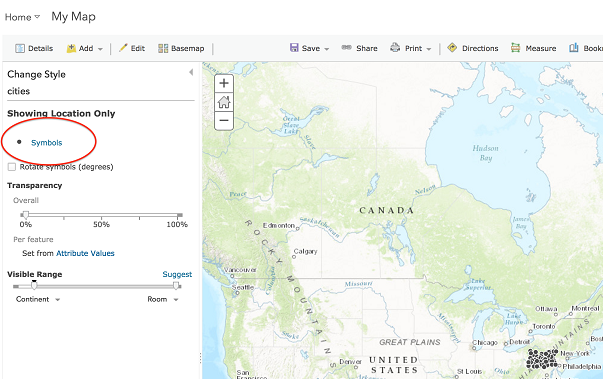 Figure 1.2 Changing layer symbology in ArcGIS Online
- Click OK to dismiss the symbology options and DONE to finish modifying the cities layer. You should see the cities layer listed under the Contents heading of the Details panel.
- Note the buttons that appear beneath the layer name, allowing you to see the layer's legend, open its attribute table, change the layer's style, perform analysis, and access a host of other miscellaneous options.
- Return to the Add Layer from File dialog and add the interstates shapefile as a layer. Again, ArcGIS Online will immediately launch into styling the new layer.
- Choose TYPE as the attribute to show and note that ArcGIS Online intelligently applies the Unique symbols drawing style (based on the field holding text strings rather than numbers).
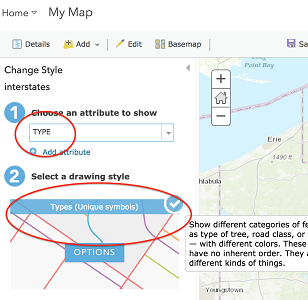 Figure 1.3 Symbolizing by an attribute in ArcGIS Online
 - Click OPTIONS. You should see a separate symbol for each of the two unique values in the TYPE field: State Route, Interstate, and Other.
- Modify the symbols to your liking. (A thicker line is intuitive for the Interstate features.)
- Again, click OK and DONE to return to the Details panel when you're finished symbolizing the interstates layer.
- Following the same sort of procedure, set the symbology of the counties layer so that the county features are drawn using a hollow fill. (Under the color palette is an empty square with a red line through it, which is used to specify "No color.") You may also want to create a darker outline color.
Next, let's explore the pop-up windows that appear when the user clicks on a map feature.
- Click on one of the cities features to bring up a pop-up window.
Because the cities features overlap counties features, the pop-up results will include features from both layers. You should see text at the top of the window like "1 of 2" or "1 of 3" indicating this.
- Click on the right arrow to cycle through the pop-up results and note that the matching feature is highlighted on the map.
There are a number of improvements that could be made to the information displayed in this pop-up.
- Click on More Options (3 dots) next to the cities layer and select Configure Pop-up.
Values from columns in the layer's attribute table are displayed in the pop-up by enclosing the column within braces. Thus, the Pop-up Title is set to display the value from the layer's NAME column using the expression {NAME}.
- Click on the Configure Attributes link just below the list of fields.
The dialog contains two sets of checkboxes: one for specifying which fields will be displayed and another for specifying which can be edited. Note that the checkbox in the header itself can be used to toggle all fields on/off.
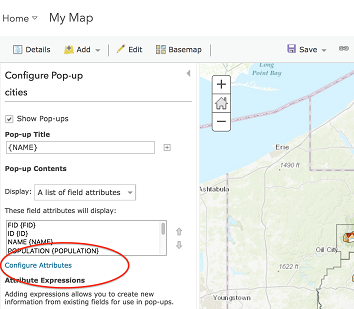 Figure 1.4 Configuring attributes in ArcGIS Online
- Editing capability isn't needed, so uncheck Edit for all fields.
- Under Display, uncheck the checkboxes next to the FID, ID, X and Y fields to exclude those values from the pop-up content.
- Click on the TOTAL_CRIM field alias and give it a new alias that makes the pop-up more human friendly. Do the same for CRIME_INDE.
The POPULATION, TOTAL_CRIM and UNIVERSITY values display with two digits after the decimal point, but that is meaningless for those fields.
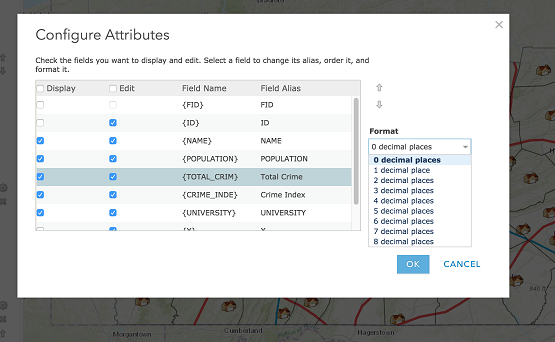 Figure 1.5 Assigning user-friendly field aliases in ArcGIS Online
- Click on the {POPULATION} field, then change the Format option from 2 decimal places to 0 decimal places. Do the same for {TOTAL_CRIM} and {UNIVERSITY}.
- Click OK to dismiss the Configure Attributes dialog, then OK again to save your pop-up changes.
Test your changes by clicking once again on a cities feature.
Note that it is possible to customize pop-ups further (e.g., to string together values from multiple columns) or to display media such as images and charts. It's also possible to utilize a different base map.
- Click on the Basemap button and choose one of the options. (A light base map is often preferable to a dark one, since your layers will stand out better.)
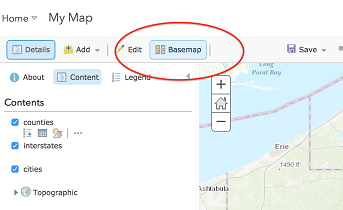 Figure 1.6 Changing the basemap in ArcGIS Online
 - Save your work by going to Save > Save As.
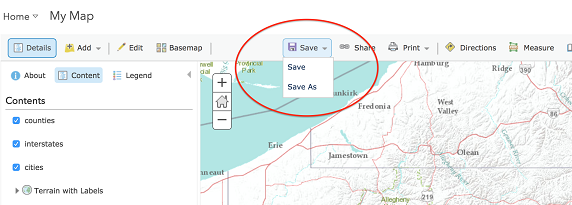 Figure 1.7 Saving a map in ArcGIS Online
 - To make it easy for me to find your map, please give it a Title of Jen and Barry - <your name>.
- Enter a logical Tag or two (e.g., GEOG 863) and an appropriate Summary (e.g., A map for GEOG 863, Project 1), then click SAVE MAP.
- Finally, make your map visible to others by clicking Share.
- Set the map's visibility to Everyone (public), as we'll be embedding this map in a web page in a moment.
- To confirm that others will be able to see your map, try opening the URL in another browser (e.g., use Chrome if you're currently working in Firefox).
In this section, we've been able to build a useful interactive web map without any programming. Move on to the next page to see how to take your ArcGIS Online map further -- still without programming -- by embedding it within a web page and using it as the basis for a web application.