Lesson 2: Creating a Field Data Collection App
Overview
Overview
In this lesson, we’ll walk through the configuration of a web map that can be viewed using Esri's Field Maps mobile app and used to record observations made in the field. This will give you exposure to another app development framework, one that has a specifically mobile device focus.
We'll actually be replicating work done recently by a Penn State MGIS student for his capstone experience. To set the stage for what we'll be doing, let's begin with a bit of background.
The Pennsylvania Department of Conservation of Natural Resources (DCNR) is the state agency charged with maintaining the state’s parks. One of their maintenance tasks is the remediation of invasive plant species. Unfortunately, limited funding makes it impossible to conduct remediation in all of the park locations where invasives are observed. For this reason, DCNR worked together with a Penn State College of Agricultural Sciences researcher to devise a methodology for prioritizing which of the infestations should receive the agency’s attention.
Within each park of interest, DCNR staff first delineate areas of similar ecological characteristics (habitat management zones, or HMZs). Each HMZ is assigned to one of 7 habitat types: Mature Forest, Pole Forest, Young Forest, Wetland, Riparian Corridor, Lakeshore, and Herbaceous Opening.
In developing an invasive species management plan (ISMP), priority scores ranging from 0-9 (?) are derived based on the following factors:
- Stewardship value – What is the HMZ’s value from an ecological stewardship standpoint?
2 = highest ecological value
1 = medium ecological value
0 = lowest ecological value - Outreach value – How much interest does this HMZ generate with outside groups (as a funding or volunteer source)?
2 = highest interest
1 = medium interest
0 = lowest interest - Extent value – How large is the species infestation?
2 = not present or in very low numbers
1 = medium presence level
0 = large infestation - Impact value – How severely does the species affect the HMZ’s native plant community?
1 = Super Bad
0 = Regular Bad
The impact a species has on the various habitat types is a known relationship that can be looked up as needed. For example, the Japanese knotweed has an impact value of 1 in an HMZ of the Lakeshore type, but 0 in the Forest types. - Restoration effort value – What level of effort will be required to eliminate the invasive?
3 = lowest effort; native plants fill in on their own after invasive is suppressed
2 = at least two seasons of suppression required
1 = elimination of invasive possible, but likely requires seeding/planting native plants
0 = highest effort; complete elimination of invasive unlikely
These values are also known ahead of time and vary based on the species and its extent value. For example, the Norway maple has a restoration score of 1 when its extent is rated as 0 (large infestation), a score of 2 when its extent is rated as 1, and a score of 3 when its extent is rated as 2 (in low numbers).
The priority score is calculated as follows:
priority = stewardship + outreach + extent + impact + restoration
The original form of this ISMP was an Excel workbook in which staff entered HMZ info and species observations into multiple tabs. VBA macros automated the priority score calculations. Unfortunately, this system had no spatial component.
More recently, a Penn State MGIS student devised a version of the ISMP for ArcGIS Field Maps. Through this application, DCNR staff can conduct their work in a spatial context by clicking/tapping an HMZ of interest on the map, recording the species found within it, and automatically obtaining a remediation priority score.
Objectives
At the successful completion of this lesson, students should be able to:
- build their own online/mobile map using Field Maps
- have a better understanding of the various map development / deployment frameworks available
- be able to choose an appropriate map framework for a particular task
- use Esri's Arcade scripting language to populate form fields automatically
Questions?
If you have any questions now or at any point during this week, please feel free to post them to the Lesson 2 Discussion Forum.
Checklist
Checklist
Lesson 2 is one week in length. (See the Calendar in Canvas for specific due dates.) To finish this lesson, you must complete the activities listed below. You may find it useful to print this page out first so that you can follow along with the directions.
| Step | Activity | Access/Directions |
|---|---|---|
| 1 | Download the Lesson 2 file geodatabase | Download here [1] |
| 2 | Download Esri's Field Maps app to a phone or tablet (compatible with Android or iOS) |
Search for Field Maps on Google Play or Apple's App Store |
| 3 | Work through Lesson 2. | Lesson 2 |
| 4 | Take the Lesson 2 Quiz after you read the course content. | Click on "Lesson 2 Quiz" to begin the quiz. |
2.1 Publishing the web layer
2.1 Publishing the web layer
Take a few moments to explore the feature classes, tables, and domains in the ismp file geodatabase that you downloaded in ArcGIS Pro. The HMZ feature class contains 14 habitat management zone polygons covering Nescopeck State Park. Note that the HMZs are assigned an integer ID and a name. The feature class also contains empty fields for the stewardship and outreach indices discussed earlier.
The Species table contains the common and scientific names of the invasive plant species that may be found in the state.
The Species_HMZ table is where observations of invasive species within a HMZ can be recorded (via the Common_Name and HMZ_ID fields). Also in this table are fields for recording the various ratings discussed earlier: the extent of the invasive, its impact rating, its restoration rating, and finally, its cleanup priority score.
The last two tables – Impact and Restoration – are lookup tables that allow for determining the impact rating of a species given the habitat type it’s found in and the restoration effort rating of a species given its extent.
Lastly, the geodatabase contains several domains, which we’ll use to place limits on what can be entered in the various fields we’ve discussed (and to provide dropdown lists of options).
-
Apply the HabitatTypes domain to the Type field in the HMZ feature class (right-click on HMZ, Data Design > Fields, then choose HabitatTypes under Domain for the Type field). Likewise, apply the StewardshipVals domain to the Stewardship field and the OutreachVals domain to the Outreach field.
-
Next, similarly open the field design dialog for the Species_HMZ table and apply domains to the fields as follows:
SpeciesNames to Common_Name
ExtentVals to Extent_Value
ImpactVals to Impact_Value
RestorationVals to Restoration_Value
Our goal for this app is for the end user to be able to tap on a HMZ polygon, record a 0-2 stewardship rating and a 0-2 outreach rating for that HMZ, then record any number of invasive species observed in that HMZ (including the various other ratings found in the Species_HMZ table). One requirement imposed by Field Maps is that each layer/table you’d like to edit must contain a GlobalID field. This is a field, managed by ArcGIS, that stores a globally unique identifier, or GUID (https://www.techtarget.com/searchwindowsserver/definition/GUID-global-unique-identifier#:~:text=A%20GUID%20(globally%20unique%20identifier,accounts%2C%20documents%20and%20other%20items.) [2], for each feature/row. -
Right-click on the HMZ feature class in the Catalog pane and select Manage. This will open the Manage tab of the Feature Class Properties dialog. Check the Global IDs checkbox and click OK to add a GlobalID field to the feature class.
-
Since we also want to be able to edit the Species_HMZ table, carry out the same action for that table.We're going to skip this step - I've struck it out because it's very likely to be unnecessary.Another important step in preparing our database will be to create a relationship class between the HMZ feature class and the Species_HMZ table. As part of this step, we’ll be specifying the primary key field for the HMZ feature class. This will be the GlobalID field we just added to that feature class. We’ll also need to specify the field in the Species_HMZ table that should be used to maintain the HMZ-Species_HMZ relationship (i.e., to link each Species_HMZ record to the correct HMZ).
-
Go into the Species_HMZ table’s field design dialog and add a new field with these parameters:
Name: HMZ_GUID
Alias: HMZ_GUID
Data Type: GuidBoth GlobalID fields and Guid fields store GUID values. The difference is that GlobalID fields are automatically managed by ArcGIS, whereas Guid fields are not. The purpose of this field we’re adding here is, as was just mentioned, to act as the linkage between the rows in the Species_HMZ table and the associated features in the HMZ feature class.
-
Create the relationship class by right-clicking on your geodatabase and selecting New > Relationship Class. In the Create Relationship Class tool dialog, make the following settings:
Origin Table: HMZ
Destination Table: Species_HMZ
Output Relationship Class: HMZ_Species_HMZ_RC
Cardinality: One to many
Origin Primary Key: GlobalID
Origin Foreign Key: HMZ_GUID
Leave all other options set to their defaults, then click Run to create the relationship class. -
If you haven’t already, add the HMZ feature class to a new map. Also add the 4 tables: Impact, Restoration, Species, and Species_HMZ.
-
Change the display of the HMZ layer so that it uses a Unique Values symbology based on the Type field (or the HMZ_ID field, your choice). (I’m partial to the Cool Tones color scheme myself.)
We’re now ready to publish the contents of the map to ArcGIS Online (AGO) so that it can be used in a Field Maps app. -
Go to Share > Web Layer > Publish Web Layer.
-
In the Share As Web Layer tool dialog, make the following settings under the General tab:
Name: ISMP Web Layer <your username>
Folder: Create a new folder called fieldmaps
Accept the defaults for all other options on this tab, but do not publish yet. The reason we're calling our layer something like "ISMP Web Layer aaa123" is that all of our layers need to have a unique name in AGO. -
Under the Configuration tab, click the pencil icon next to the Feature layer to access a number of configuration options. Check the Enable editing checkbox, leaving all of the edit types checked and the Attributes and geometry option selected.
-
Click Analyze to run a check of whether the map can be successfully published.
You should get 2 warnings of “Layer’s data source is not supported.” This is in reference to the two background layers that are included in ArcGIS Pro maps by default. It’s not strictly necessary, but remove these layers from the map.
The other issue you’ll see noted in the Analyzer results is an error that “Unique numeric IDs are not assigned.” Let’s take a moment to reflect on what we’re doing here. We’re hoping to make all the items loaded in the map -- the polygon layer and standalone tables – available for use in AGO. The singular name of “web layer” may seem confusing since our map could have any number of layers/tables in it, but that is the term for what is being produced in AGO. Each layer/table found in this Pro map is going to be published to AGO. One of the requirements before we can publish is that each layer/table needs a unique ID assigned to it. This can be done through a Map Properties setting, which we can access via a shortcut in the Analyzer results.
-
In the Analyzer results, hover your mouse over the error, click the … button, then select Open Map Properties to Allow Assignment.
-
Under the General settings, put a check in the Allow assignment of unique numeric IDs… checkbox, then click OK to dismiss the Map Properties dialog.
You should see the red X in the Analyzer results change to a green checkmark.
-
Click Analyze again. You should now receive no errors or warnings.
-
Click Publish. The Share As Web Layer tool will churn for a minute or two, before you should see a message that the web layer published successfully.
You should now be able to browse to your AGO account and see a hosted feature layer and service definition both with the name ISMP Web Layer.
Field Maps operates on web maps, so before we can create an app with Field Maps we’ll first need to create a web map containing our new web/feature layer.
-
While looking at the items in your fieldmaps AGO folder, click the … next to the feature layer and select Open in Map Viewer.
-
At this point, we could modify the layer’s symbology or how info is displayed in its popups. However, let's hold off on doing any such configuration for now. Simply click the Save and open button, assign a name of ISMP Web Map, specify that you want to put it in the fieldmaps folder, then click Save.
-
Return to your AGO Content page ("hamburger" icon in the upper left > Content), where you should now see the newly created web map. Click the … next to it and select Open in Field Maps Designer.
Note: I attempted two variations on this workflow, but neither was successful:
- Using the Share as Web Map tool in Pro instead of Share as Web Layer. This both creates the new AGO feature layer and a web map containing that layer, cutting out the need to add the new feature layer to the Map Viewer and save a web map as separate steps. However, feature edits in a web map created in this way didn't work for me as required.
- Creating the relationship class as many-to-many rather than 1-to-many. Each HMZ can have many species and each species can appear in many HMZs. Creating the relationship class in this way would automatically create an intermediate table that would store the HMZ-species combinations. However, again, feature edits didn't work as required when I attempted to go this route.
With the necessary data published to AGO and a web map created from it, we're now ready to configure the web map for staff who will be opening it in the Field Maps app on their mobile devices.
2.2 Configuring forms in Field Maps
2.2 Configuring forms in Field Maps
The primary type of configuration that is required in building a Field Maps app is creating forms for the end user to record their observations.
-
Click on the Forms button. You should see the HMZ layer under the Layers heading. And if you expand the Tables, you should see the map’s four tables, with only Species HMZ being enabled for form creation. (Note: Field Maps removes underscores from layer/table names, for whatever reason, so your table will show up as Species HMZ rather than Species_HMZ.)
-
Re-expand the Layers listing and click on HMZ to select it. You should see a design canvas appear in the middle of the window delineated by a box with a dashed outline. To the right of the design canvas, you’ll see a Form builder panel containing several different types of Form elements (or controls). Scrolling down through the Form builder controls, you should see the layer’s Fields at the bottom. One option for configuring a form is to drag and drop controls from the Form builder panel onto the design canvas. However, what we’ll do here instead is ask Field Maps to create a form from the layer’s popup.
-
Click the blue Convert pop-up button in the middle of the design canvas. You should see fields from the HMZ attribute table have been added to the canvas as text boxes (for fields without an associated domain) and as combo boxes (for fields with an associated domain).
-
Click the Save button in the upper right of the design canvas to save the form.
-
Expand the Tables listing and go through the same process to create a form for the Species_HMZ table.
You may not realize it, but you now have an app that you can test!
-
Open Field Maps on your mobile device. After logging in to your AGO account, you should be presented with a list of web maps.
-
Find your ISMP Web Map and tap it to open it.
Unless you happen to live in the vicinity of the Nescopeck State Park, you won’t be able to see the HMZ features. -
Open the Field Maps menu using the … button in the upper right and choose Bookmarks > Default Map Extent. This will zoom you to the park.
-
Tap the Campground Management Area (the square-ish polygon in the north-central part of the map) to select it.
You should see a popup appear showing the data associated with that HMZ. A DCNR employee using the app would want to record the Stewardship and Outreach ratings for the HMZ. -
To do that, tap the Edit button at the bottom of the screen (pencil icon). You’ll have the ability to modify the HMZ’s boundary, though there is no need to do so.
-
Instead, drag the popup panel up so that you're able to focus on attribute entry, then tap on the Stewardship box and choose 2 - highest eco value from the options (which came from the domain you configured).
-
Then tap on the Outreach box and choose 0 - lowest interest from the options. Click Submit to commit your entries to the geodatabase.
The DCNR staffer would next want to record the invasive species observed in the HMZ. With the popup panel up, scroll down past the HMZ attributes. You should see a Related heading followed by a Species HMZ link. -
Tap that link to access the related records from the Species_HMZ table. There aren’t any records as of yet, but you should see an Add button, enabling you to enter a new record.
-
Upon tapping Add, you should see a form containing the Species_HMZ fields. The HMZ_ID field will hold 0. You can either change that to the appropriate value (12) or just ignore it for now. We’ll come back to this in the next section. Make the following entries in the form:
Common_Name: exotic biennials
Extent_Value: 2
Impact_Value: 0
Restoration_Value: 2
Priority: 6
Note that the HMZ_GUID value will be automatically populated with the Campground Management Area’s GlobalID value, which happens because of the foreign key setting we made when configuring the relationship class. -
Tap Submit to commit this data to the Species_HMZ table as a new record.
With that, you will hopefully have successfully tested your app!
2.3 Populating fields automatically with calculated expressions
2.3 Populating fields automatically with calculated expressions
As you were testing, you probably saw some aspects of the app that could be improved. We already noted that the HMZ_ID of a new Species_HMZ record defaulted to 0 and in this section we'll correct this shortcoming by configuring a calculated expression written in Esri's Arcade scripting language.
Also, returning to the project background, you may recall that the Impact rating is based on the HMZ’s habitat type. Similarly, the Restoration rating is based on the species and its extent. So after the relatively simple HMZ_ID expression, we'll up the ante a bit to create more complex expressions that populate the Impact_Value and Restoration_Value fields by querying the Impact and Restoration lookup tables. We’ll also then be able to carry out the Priority score calculation using the various ratings entered by the user and derived from the lookup tables.
2.3.1 Getting the HMZ_ID
2.3.1 Getting the HMZ_ID
Recall that maintaining the relationship between the HMZ polygon feature and the Species_HMZ records associated with it depends on the GlobalID of the HMZ being entered into the Species_HMZ table’s HMZ_GUID field. That was a result of the relationship class we created. While this does maintain the record associations, the HMZ_GUID value (randomly generated by ArcGIS) will have no meaning to someone who views the Species_HMZ records in isolation. That's what drove the inclusion of HMZ_ID in the Species_HMZ table; it’s an ID assigned by the DCNR staff. However, as we saw, this field won’t be automatically populated for us. So let’s see how we can use Arcade scripting to populate this field.
-
In AGO, re-open your ISMP Web Map in the Field Maps Designer.
-
Return to the Form designer interface and re-open the Species HMZ table’s form.
-
Click on the HMZ_ID control to select it. You should see its Properties appear in the panel to the right.
-
Scrolling down that panel, you should see an area labeled Logic that has a Calculated expression property. Click the gear icon to access the calculated expressions stored with the web map. (There won't be any at this stage.)
-
Click New expression.
A dialog will open for building an Arcade expression, with a large box on the left for the expression and a collapsed panel on the right providing helpful shortcuts. The shortcuts are in the form of Profile variables and Functions.The profile variables provide a number of potential starting points for expression building. These include:
$feature – the feature whose attributes the user is currently viewing (or as in this case, a record from a standalone table rather than a feature from a feature class)
$map – the web map the user is currently viewing
$layer – the layer/table that the current feature/record is coming from
$featureSet – the complete set of features/records associated with the current layer; similar in concept to an array, common in programming languages; can be iterated over using a loop
$datastore – the complete set of layers/tables that are built into the web map
The Functions tab gives access to many general purpose functions found in many languages (e.g., Left, Right, Length, Count, etc.) along with spatial functions (Area, Centroid, Distance, Extent, etc.).
In order to retrieve the HMZ_ID value, we need to get at the HMZ feature associated with the currently open Species_HMZ record. We can do that by a) getting the HMZ_GUID, b) querying the HMZ layer for the HMZ feature with that value in its GlobalID field, and c) asking for the value in that feature’s HMZ_ID field. -
Start with step a) by entering the following:
var hmz_guid = $feature["HMZ_GUID"]
Note that:
- The var keyword is used in Arcade to define variables.
- Field values are accessed from features/records by quoting the field name and putting it in brackets.
- You can expand the $feature profile variable to the right to see a list of the fields available and to insert the field reference automatically (by clicking the appropriate link).Let’s confirm that we’re on the right track before moving on to the next step.
-
Add the following statement to the expression:
Console(hmz_guid)
-
Click the Run button in the upper left of the Expression box.
Field Maps may churn for a few seconds, but eventually you should see a new section appear in the interface beneath the Expression box. The Output tab will show the result returned by the expression – which we haven’t gotten to yet. What we want to look at now is the Console tab, which is where the Console function sends its output. Assuming all is well, you should see a GUID. (Recalling that $feature refers to the record currently being viewed, you may be wondering which record it’s referring to when testing here in the expression builder. I presume Field Maps is grabbing the first record it finds in the applicable table, Species_HMZ in this case.)
Returning to the expression, we can now work on step b) of the steps outlined above. Arcade has a FeatureSetByName function that can be used to get a reference to a FeatureSet (layer or table) through the global $map variable. -
First, remove the Console statement.
-
Next, get a reference to the HMZ layer, as follows:
var hmz_lyr = FeatureSetByName($map, "HMZ")
Please note that your layer might not be called just "HMZ" it's likely called "ISMP Web Layer aaa123 - HMZ" so you'll need to amend your code accordingly. To find out what your layer is called open it in Map Viewer and use the name in the Layers list.
Now we want to query the HMZ layer for all features where the GlobalID is equal to the value in our hmz_guid variable. -
Carry out this operation using the Filter function:
var qry = "GlobalID = '" + hmz_guid + "'"
var feat_set = Filter(hmz_lyr, qry)
Here we’re passing the Filter function a reference to the HMZ layer and a query expression. Note that GUID values must be quoted, so in creating the qry variable, the concatenation operator (+) is used to enclose the GUID in single quotes. When querying a layer in this way, the Filter function will return a FeatureSet object, which we’re storing here in the feat_set variable.
In other contexts, we might use a for loop to iterate over the Features in a FeatureSet. However, given the nature of GUIDs, we know that this FeatureSet will hold exactly 1 Feature.
-
Use the First function to get at the 1 returned Feature:
var feat = First(feat_set)
With a reference to the HMZ feature associated with the current Species_HMZ record, we’re ready to specify our Arcade expression’s return value (i.e., the value that should go into the HMZ_ID field). This is done in Arcade using the return keyword followed by the desired value.
-
Define the expression's return value, as follows:
return feat["HMZ_ID"]
Your complete Arcade expression should look like this:
var hmz_guid = $feature["HMZ_GUID"]
// remember that your layer might not be called "HMZ" so you
// might need to amend your layer name to be something like :
// ISMP Web Layer aaa123 - HMZ
var hmz_lyr = FeatureSetByName($map, "HMZ")
var qry = "GlobalID = '" + hmz_guid + "'"
var feat_set = Filter(hmz_lyr, qry)
var feat = First(feat_set)
return feat["HMZ_ID"]
-
With that, you can again click Run.
As the expression contains no Console statements, you should expect to see nothing under the Console tab. However, with the addition of a return statement, you should now expect to see something under the Output tab. Specifically, if you added a single Species_HMZ record associated with the Campground Management Area in your testing of the app at the end of the last section, you should see that the output returned by the expression is 12. -
Before leaving the expression builder, set the Title of the expression to getHMZ_ID.
-
Click Done to close the expression builder and return to the form designer.
Back in the form designer, you should now see a "Calculated" label beneath the HMZ_ID field and your getHMZ_ID expression listed under the Calculated value area of the Properties panel. -
Click the Save button in the upper right of the form designer to commit your changes.
-
At this point, you can return to Field Maps on your mobile device to test the change you just made. If you’re looking at the list of Maps available, you’ll probably see your ISMP Web Map listed under the Current heading. It’s probably a good idea to tap the … button next to it and then Reload Map to ensure the changes have made their way to your device.
-
Open the map and open the popup for the Campground Management Area again.
-
Access the related Species_HMZ form and click Add. The form associated with that table should appear and instead of defaulting to 0, the HMZ_ID should be set to 12. (It may take a second or two for the calculation to complete.) There’s no need to submit another species at this point, so you can tap Cancel and then Discard to back your way out of adding a new species.
That wasn’t a mission-critical calculation, but it did give a good introduction to writing calculated expressions with Arcade. You can learn more about the topic from the Field Maps documentation [3] (https://doc.arcgis.com/en/field-maps/android/help/configure-the-form.htm... [3]). In the next section, we'll build the expressions that are needed to compute the priority score for each Species_HMZ record.
2.3.2 Deriving the Impact and Restoration values
2.3.2 Deriving the Impact and Restoration values
Recall from the scenario that one of the ratings that contributes to a Species_HMZ record’s priority score is the Impact_Value ("regular bad" or "super bad"), which is dependent on which species is present and what type of habitat it’s invading (Mature Forest, Wetland, etc.). The application could be built with the expectation that the staffer would look up the impact value and enter it manually, but that lookup can be handled automatically with another calculated expression since we have the data needed in the Impact table. For example, looking in that table, we can see that the garlic mustard species in the Wetlands habitat type has an impact value of 1 (super bad).
Hopefully you’re already thinking through the steps that are required for this calculation. As in the previous one, we’ll want to obtain a reference to the associated HMZ feature. We can then get the value from the Type field. Another data point we’ll need is which species we’re dealing with. That we can access through the $feature variable. Having those two data points, we can query the Impact table to get the impact value associated with that species+habitat type combination. We’ll get to the Impact table through the $datastore variable.
One wrinkle involved in this query is that the Impact lookup table has been populated such that it contains only those species+habitat type combinations that have an impact value of 1 (the "super bad" ones). Thus, if a species+habitat type combination cannot be found in the table, it can be assumed that the impact value is 0 (i.e., that it’s a "regular bad" situation).
- Back in Field Maps, pull up the Species_HMZ form again.
- Click to select the Impact_Value field.
- Create a new Calculated expression for that field. (Note that the Calculated expressions area of the Properties panel will list all expressions you’ve written for this web map, not just for the field you currently have selected.)
- Copy and paste this expression (or type it manually, if you prefer):
var species = $feature["Common_Name"]
var hmz_guid = $feature["HMZ_GUID"]
// remember your layer might not be called "HMZ" but
// "ISMP Web Layer aaa123 - HMZ" so adjust it accordingly
var hmz_lyr = FeatureSetByName($map, "HMZ")
var hmz_qry = "GlobalID = '" + hmz_guid + "'"
var feat_set = Filter(hmz_lyr, hmz_qry)
var feat = First(feat_set)
var habitat_type = feat["Type"]

var impact_tbl = FeatureSetByName($datastore, "Impact")
var impact_qry = "Habitat_Type = '" + habitat_type +
    "' and Common_Name = '" + species + "'"
var impact_rows = Filter(impact_tbl, impact_qry)

if (Count(impact_rows) == 0) {
    //no match on this species+habitat, so impact is 0 (regular bad)
    return 0
} else {
    //there is a match on this species+habitat, let's get the impact value
    var impact_row = First(impact_rows)
    var impact_val = impact_row["Impact_Value"]
    return impact_val
}
Hopefully you’re able to follow everything going on in this expression. Here are a couple of points of clarification:
- Based on the design decision to omit records where the impact value is 0, note the use of the Count function to determine whether the query on the Impact table found any rows. The expression’s return value is set to 0 if a match is not found; otherwise, the return value is set to whatever is held in the Impact_Value field. (This field only holds values of 1, so alternatively the expression could just be set to return 1 when the query finds a match, but explicitly retrieving the value has the advantage of offering flexibility in the event that the impact rating scale were to change from something other than just 0-1.)
- The expression contains a couple of comments intended to clarify the logic involved. These are the lines that begin with double slashes (//). -
Assign a name to the expression of getImpact, then close out of the expression editor and Save your changes to the web map.
-
Return to the Field Maps app on your mobile device to test. (Remember to reload the map first.)
-
Again, select the Campground Management Area, and add a new species.
When the Species_HMZ form first opens, you should see the Impact_Value field automatically take on a 0 - regular bad value because the species name has not been specified yet. -
Choose a species found in the Impact table associated with the MF habitat type (wavyleaf basketgrass is one) and confirm that the Impact_Value field updates itself to 1 - super bad.
-
Cancel out of the edit once you’ve confirmed your expression is working as intended.
Recall from the scenario that the restoration effort rating is another field on the form that is derived from other user-supplied values. Specifically, it depends on the species in question and the extent of its infestation. Unlike the calculation of the impact value, which required obtaining one value from the Species_HMZ form and another from the HMZ form, the values needed for the restoration calculation are both found in the Species_HMZ form. So this expression will be a bit less complicated. -
Return to Field Maps in AGO and re-open the Species_HMZ form for editing.
-
Select the Restoration_Value field and open up the expression builder.
-
Take a crack at writing the expression yourself.
As noted above, you’ll need the user-entered species name and extent rating. You can then query the Restoration lookup table to get the restoration value associated with the species+extent combination. Like the Impact lookup table, combinations that yield a 0 value have been omitted from the table. Unlike it, however, the possible restoration values range from 0-3 rather than 0-1, so you would not have the option of assuming a value of 1 if a match for the species+extent combination is found.Code that completes the task can be found here:
var species = $feature["Common_Name"]
var ext = $feature["Extent_Value"]

var rest_tbl = FeatureSetByName($datastore, "Restoration")
var rest_qry = "Common_Name = '" + species +
    "' and Extent_Value = " + ext
var rest_rows = Filter(rest_tbl, rest_qry)

if (Count(rest_rows) == 0) {
    return 0
} else {
    var rest_row = First(rest_rows)
    var rest_val = rest_row["Restoration_Value"]
    return rest_val
}
We’ve now written expressions to automatically populate two of the important ratings fields, eliminating the need for a staffer to look them up manually. Recall that the ultimate purpose of populating those fields, and of the map itself, is to derive an overall remediation priority score. We’re now ready to build one last expression to carry out that calculation.
-
In the Field Maps form designer, select the Priority field and open up the expression builder.
Recall from the discussion earlier that the priority score is computed as the sum of the following five values:
Stewardship and Outreach (from the HMZ table)
Extent, Impact, and Restoration (from the Species_HMZ table). -
Using your expression building experience, see if you can come up with the code needed to populate the Priority field with the correct score.
Code that completes the task can be found here://Get the extent, impact, and restoration vals from the current Species_HMZ record var extent_val = $feature["Extent_Value"] var impact_val = $feature["Impact_Value"] var rest_val = $feature["Restoration_Value"] //Get the stewardship and outreach vals from the related HMZ record var hmz_guid = $feature["HMZ_GUID"] var hmz_lyr = FeatureSetByName($map, "HMZ") var feat_set = Filter(hmz_lyr, "GlobalID = '" + hmz_guid + "'") var feat = First(feat_set) var steward_val = feat["Stewardship"] var outreach_val = feat["Outreach"] //Sum and return the result var priority_val = steward_val + outreach_val + extent_val + impact_val + rest_val return priority_val -
Save the expression with a name of calcPriority.
-
Save your changes to the Species_HMZ form.
-
Return to the Field Maps app on your mobile device and go through the addition of a Species_HMZ row (woody vines, extent of 2, and butterfly bush, extent of 1, are other species found in the Campground Area). Confirm that both the Restoration_Value and Priority fields are populated automatically.
2.4 Applying finishing touches
2.4 Applying finishing touches
Tools like those built into Field Maps often set UI element properties to commonly used values in order to minimize the effort needed to produce a working app. However, just as a cartographer shouldn't leave .shp in the names of layers being shown in a legend, a developer should consider what changes can be made in default settings to produce a more professional and user-friendly UI.
If you haven't already, take a few moments to examine how the ISMP Web Map looks when open in Field Maps on your mobile device. Are there any fields being shown that would not be of interest to the end user? Are there any control labels that could be better tailored to the map's purpose or made more user friendly? Are the dropdown options presented in an intuitive order? On this page of the lesson we'll address the issues that I noted. If you think there are any other ways to improve the map, feel free to post your ideas to the discussion forum.
The first thing we'll do is look for fields in the HMZ form that aren't needed and only serve to clutter it. Looking at the map in the Field Maps app on your mobile device, the OBJECTID, GlobalID, Shape_Area, and Shape_Length fields offer little, if any, value, so let's get rid of them. But how? We have a few different options:
- Open the map in the AGO Field Maps form designer and remove the unneeded fields from the HMZ layer's form. This would cause the fields to no longer appear in Field Maps, but they would still appear in other contexts where the map is found.
- Open the map in the AGO Map Viewer and remove the unneeded fields from the HMZ layer's popup. This would cause the fields to no longer appear anywhere the map is found.
- Open the feature layer with the Map Viewer and remove the unneeded fields from the layer's popup. This would cause the fields to no longer appear everywhere the ISMP Web Map is used and in any other maps that include the layer.
All of a layer's fields are included in its popup by default. Interestingly, if you open the map with the Field Maps form designer, you'll see that the fields I mentioned (OBJECTID, etc.) do not appear on the form. Recall that we populated the form with controls by choosing to convert the layer's popup. The fields I mentioned aren't on the form and also aren't available to add. And yet, they do show up when the map is opened in the Field Maps mobile app. I don't know if this is an intentional design decision or a bug. In any case, to get these fields off the form, it means we'll need to modify the layer's popup.
- Open the ISMP Web Map in the AGO Map Viewer.
- The HMZ layer should be selected by default. Click the Pop-ups button found on the strip of buttons running along the right side of the map. A popup preview showing data from an example feature should appear over the map along with a panel of properties that can be set.
- Click on the Fields List button to expand the list.
- Click the X next to the OBJECTID field. You should see it disappear from the popup preview.
- Repeat for the GlobalID, Shape_Area, and Shape_Length fields.
- Close the Pop-ups panel.
The Save and open button running along the left of the Map Viewer (folder icon) should now have a blue dot over it, indicating that there are unsaved changes.
- Click that button, then Save.
There are likewise a few unneeded fields that appear on the Species HMZ form -- OBJECTID, GlobalID, and HMZ_GUID.
- Click the Tables button on the left side of the Map Viewer to access the tables included in the map.
- Select the Species HMZ table, then go through the same process used above to remove the three unneeded fields from the popup.
- Save your changes.
One thing you may not have noticed when configuring the forms in Field Maps is that the controls were all embedded within a Group layout element. On each form, this element was assigned a default label of Control 1. This label appears in the Field Maps mobile app, but interestingly, only for the Species HMZ form, not for the HMZ form. (The group label for the HMZ form is Fields, not Control 1, for whatever reason.) The mobile app user can tap this label to expand/collapse the field controls found within that group.
- Exit out of the Map Viewer and open the ISMP Web Map in Field Maps again.
- Open the Species HMZ form and select the Group control (the item on the design canvas with the label Control 1).
- In the Properties panel to the right, change the Display Name to Species-HMZ Attributes.
- Click the Save button in the upper right of the design canvas to commit your change.
One last improvement that we'll make concerns the selection of the species. The Common_Name dropdown list, which is populated based on the SpeciesNames domain you applied in Pro prior to publishing the web layer, is not in alphabetical order, making it quite tedious to find the desired species. There doesn't appear to be a convenient way in AGO to order the names. It can be done using the Python API for ArcGIS, but diving into that coding platform would be outside the scope of this class. Fortunately, there is a tool in Pro built for this purpose. And most importantly, making such a change won't require going through the entire workflow again. We can simply re-publish the web layer, choosing to overwrite it, and the change will be reflected in our web map (and any other web maps that happen to include the web layer).
- Return to ArcGIS Pro and open the geoprocessing toolbox (Analysis > Tools).
- Searching on the keyword sort, locate and open the Sort Coded Value Domain tool.
- Browse to your ismp geodatabase, selecting the SpeciesNames domain, and Run the tool so that the Code-Description pairs are sorted by Code in Ascending order.
- Re-publish the web layer by going to Share > Web Layer > Overwrite Web Layer.
- Looking within Portal > My Content, navigate into your fieldmaps folder and select your ISMP Web Layer.
A message will appear, warning that what you're about to do will cause you to lose changes that were made after the layer was initially published. This means losing the features/records that were added to the HMZ layer and the Species_HMZ table. This isn't really problematic as those were just test edits. Perhaps more consequential is the possibility of losing changes made in popup configuration. We just made changes of that kind, though recall that we made them by opening the ISMP Web Map in the Map Viewer rather than the ISMP Web Layer. That meant that we were taking the popup settings the web layer brought with it and overriding them within the current web map only. It also means that the changes we made should "survive" an overwrite of the web layer.
- You could click Cancel to back out of the overwrite now if you wanted, but go ahead and click OK.
- In the Overwrite Web Layer panel that appears, accept all of the default settings and click Publish.
- Go back to the Field Maps mobile app, reload the map, and test again. Confirm that the Common_Name dropdown list is now sorted and that the unwanted fields are not being shown. (You should expect any data edits you had made in earlier testing to have been lost.)
WIth that, we've finished our walkthrough of configuring a field data collection app. In the next section, you'll be prompted to take what you've learned and apply it to a different scenario.
Assignment: Configure a Field Maps Solution of Your Own
Assignment: Configure a Field Maps Solution of Your Own
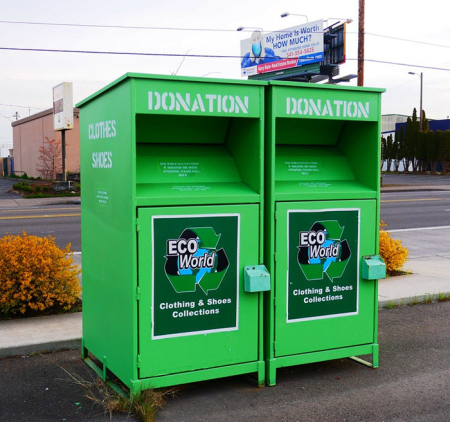
If you're like me, every so often you bag up a bunch of old clothes to donate. But figuring out where to take them can be a challenge. Donation bin locations change fairly frequently and I've had limited success finding them through online searches. The scenario for this assignment is that you work for some organization -- perhaps a local government agency or a nonprofit -- interested in compiling the locations and other attributes of such donation sites in your local area.
Following a workflow similar to what you saw in the lesson, devise a Field Maps-based solution that can be used by staff working on tablets to compile the data. Here are some details on what is expected:
- You are welcome to expand this to include other household goods (e.g., electronics), but the basic requirement is to account for clothing and shoes.
- In addition to bins like the ones picture above, you should also build in support for capturing data on stores (e.g., Goodwill) and consignment shops. At minimum, this will require recording the name of the organization taking the donation, its hours of operation, and whether dropoffs can be made outside of those hours.
- This should be a less complex scenario than the invasive plant species one you just walked through, so don't overthink your solution.
- There is no need for complex Arcade expressions like those from the invasives scenario. However, I do want you to store the ID/name of the signed-in user and the date when an edit is performed. Guidance on how to do this, using Arcade, can be found in the documentation.
- Be sure to share your web map with the GEOG 863 AGO group for the current term so that your grader can access it!
Deliverables
This project is one week in length. Please refer to the Canvas course Calendar for the due date.
- Submit a document (Word or PDF) that contains the URL of your web map to the Assignment 2 Submission area in Canvas. (80 points)
- Include in the document some reflection on what you learned from the lesson and/or any concepts that you found to be confusing (minimum 200 words). (20 of 100 points)
- Complete the Lesson 2 quiz.