Administering ArcGIS Enterprise
For this week's assignment, we're going to perform a few admistrative tasks to be sure our Server and Portal sites are running smoothly. Return to your AWS Console and start the EC2 instance you used in Lessons 2 - 4.
There a number of ways to access configuration options for ArcGIS Enterprise. Two of these options are via a web browser. Depending on how your Enterprise installation is configured, you may need to use a browser on the EC2 instance itself through a Remote Desktop connection rather than from your local computer. In these cases, administrative access has been disabled from remote client machines. This is a setting you could change on your server, as well as confirming the appropriate firewall ports are open. For now, visit these sites from a browser on your EC2 machine:
- ArcGIS Server Manager (e.g., baxtergeog865####.e-education.psu.edu/server/manager), which allows us to manage map services but has limited administrative control of the underlying site.
- ArcGIS Server Administrator Directory (e.g., baxtergeog865####.e-education.psu.edu/server/admin), which provides access to many of the underlying configuration settings of the Server, WebAdaptor, DataStore, and Portal installations. Be careful when exploring this site, as one erroneous alteration could render your Enterprise server unusable.
- ArcGIS Pro (or ArcGIS Desktop), from which you can make a connection to your server and explore its properties and contents.
Let's explore the ArcGIS Server Manager site. Visit your Manager site with a url like, baxtergeog865####.e-education.psu.edu/server/manager.
Under the Services tab, you should see the various services you've created so far in the course lessons. Click the pencil icon next to one of your services to see the options you have to administer them. Explore the various sections by clicking the tabs along the left of the window. A few things to look for in particular:
- Under Paramaters, you'll see a setting for Maximum Number of Records Returned by Server. This is a setting for vector services that will limit the number of individual features rendered for a client request. For example, if you have a large roads layer, with hundreds of thousands of individual line segment features, the server will stop rendering the map when it reaches the number of features specified in this setting. If a client zooms out sufficiently far when viewing the service, not all of the road features will appear on the map. This setting can be useful in preventing the server from getting overloaded by a client request that inadervtently calls for the rendering of so many features that the server maxes out its CPU capacity trying to draw everything. Setting this number low protects the server from becoming overwhelmed and slowing down any other requests, but does so at the expense of all features being displayed on a requested map.
Similarly, the Maximum Image size settings put a limit on the size of the map image the server will generate for a client request. If a client with a very high resolution monitor and large pixel dimensions, a map image of that very large size will be requested of the server; the larger the image, the longer it takes the server to process the request and the more resources (CPU, RAM, etc.) will be utilized. Capping image size at a certain pixel range will guard against excessively large images being requested and bogging down the server.
- Under Pooling, your service is probably set to utilize a Shared Instance Pool. Check out this documentation page to learn about Pooling and service instances [1]. Basically, each client request for a service is processed by a service instance on the server. By default, ArcGIS Server creates a set of shared instances that can process a request for any service that is configured to use the shared pool. These instances can be seen on your server using the Windows Task Manager. When connected to your EC2 instance via Remote Desktop, open the Task Manager by right-clicking the task bar along the bottom of the screen and choosing Task Manager. Activate the Processes tab, and expand the ArcGISServer EXE background process.
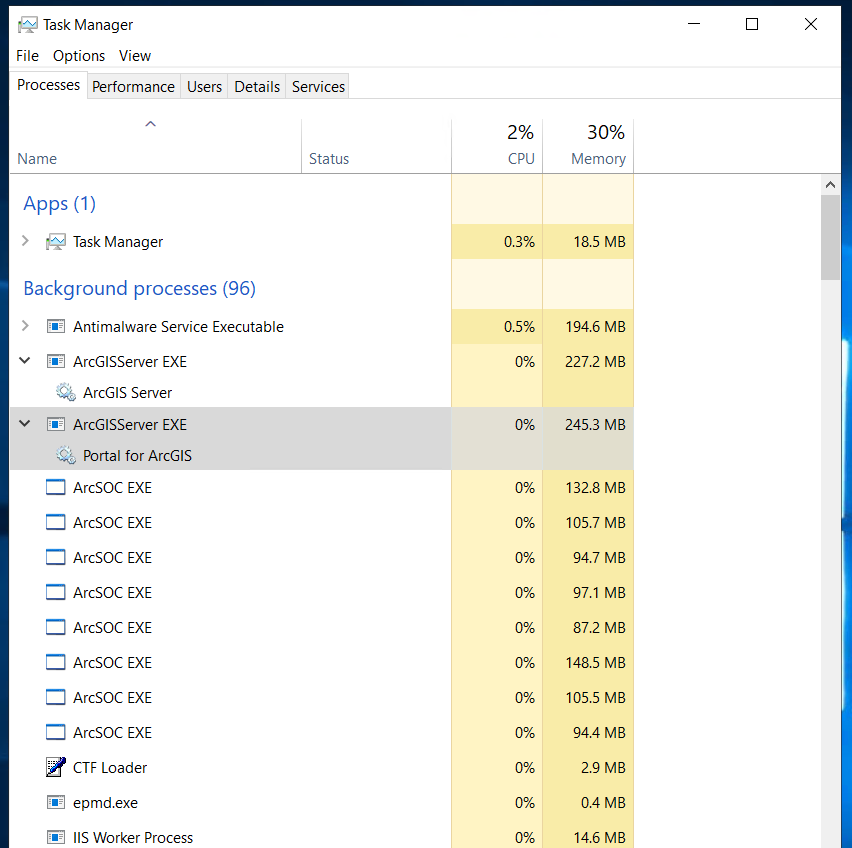
Each of the ArcSOC EXE items you see listed represents one service instance. Some are part of the default pool of shared instances, and others are dedicated to a specific map service. Let's configure a service to utilize its own dedicated instance(s) and see how it appears in Task Manager. First, count the number of ArcSOC EXE processes you see in Task Manager. Next, back on the ArcGIS Server Manager site, change a service's Instance Type setting to Dedicated Instance Pool. After doing this, you will be able to specify the maximum and minimum number of instances for the service. Set the minimum to 5 and the maximum to 10. Return to the Task Manager on your EC2 machine and you should see several more ArcSOC EXE processes listed. Initially, you'll probably see 5 new ArcSOC processes. Your server can now process 5 concurrent client requests for this service in parallel. If, say, there is a time when there are 8 concurrent client requests for this service, ArcGIS Server will spin up three more ArcSOC processes to handle the requests. This can continue up to the maximum number of processes you allow (in our case 10). Beyond that, concurrent requests in excess of 10 will need to wait until prior requests are processed before being addressed. There are tradeoffs of changing these settings and there's no configuration that is ideal for every scenario. It depends on how many client requests you expect services to receive, how long it takes requests to be processed, and how much CPU and RAM resources your server machine has when deciding how to configure things. In any case, you can see some of the options you have for tuning your particular server environment.
For this week's assignment:- Take a couple screen grabs of your Task Manager and ArcGIS Server Manager before and after changing a service's instance type settings and include them in your assignment submission.
- Also, write a paragraph that describes a scenario in which you might configure services with different pooling options and what the ramifications of those setting might be.
Under the Site tab in the ArcGIS Server Manager, you'll see a few sub-sections that contain many of the properties of your Server's configuration. Among these are:
- Directories: paths to the folder locations on your server where various files are stored.
- Machines: a list of all of the physical or virtual machines in your architecture. In this class, we have only set up a single machine, but you may have an architecture that includes several machines that help distribute heavy loads from clients.
- Data Stores: a list of all the folder and database locations where the data behind your map services are stored. You should see the Data folder and Geodata database we set up in an earlier lesson. You'll also see the default Data Store locations for relational (raster and vector) and tile cache data.
Another useful page on this site is the Software Authorization sub-section. Click that heading and you'll see the licensing information for you installation. This can be useful when determining when you need to renew licenses or remember which extensions you have access to.
- For this week's assignment:
- Take a screen grab of your Server Authorization page.
Finally, click on the Logs tab of the ArcGIS Server Manager site.
The View Logs sub-section is a place you can go to view error logs generated by your ArcGIS Server. This can be a very useful place to look when services aren't working properly. You can change the level of log detail to view by changing the Log Filter dropdown; the Debug option will show you the most information. You can also change the way logs are generated and stored on your server by clicking the Settings button. The Debug option will result in the most comprehensive log files, which you can filter any way you'd like when viewing, but it's not recommended to leave your logs configured to Debug for very long because the log files stored on your server will get very large and take up a lot of space. But when troubleshooting a problem it's good practice to set the log setting to Degub temporarily to investigate the problem and to then revert it back to Warning or Severe afterwards to save space.
The Statistics sub-section is a very useful resource for monitoring the client usage of your server. You will see graphs of a few default reports on the statistics page that you can click and interact with. Click on the Total Requests for the Last 7 Days graph. You will see all of the services running on your server listed along the left. You can toggle the visibility of them individually to see their usage on the graph. You also have the option to specify the timeframe of the statistics report. Often, when running your own ArcGIS Server installation you will want to understand how your services are being utilized by clients, or you may need to generate numbers for other people in your organization to demonstrate the value of the services you provide. These dynamic graphs are a useful tool, and you may export the data as a .csv spreadsheet and extract information using a tool like Excel. Back on the main Statistics page, you can click the New Report button to create a custom view and save it as a thumbnail. You might create a custom report of a handful of your services and a relevant timeframe for your organization, maybe the last month, and export a report regularly to monitor usage over time.
You can also generate reports using a custom toolbox in ArcGIS Pro. This can be useful if you need to create a report that the web-based interface won't support. For example, the Statistics page in the ArcGIS Server Manager will only list a limited number of services in the toggle list. If you need to generate a report of more services, you'll need to run a custom tool in ArcGIS Pro to create and save the report. Below, we will see where custom reports are stored in the adminstrative section of ArcGIS Server.
- For this week's assignment:
- Create a new report, save it to your Statistics page, and take a screengrab of the Statistics page showing thumbnails of the default reports and your new custom one.
Open a new browser tab and visit the ArcGIS Server Administrator Directory (baxtergeog865####.e-education.psu.edu/server/admin). Log in with your siteadmin credentials. I don't recommend making any changes here, but feel free to explore the various sections to see the types of information that's available.
From the root page, click on the usagereports link. You will see a list of some default reports; if you create custom reports using ArcGIS Pro, they will appear on this page. You have the option to export the data from any of these to an .html, .json, or .csv file.
Back on the root page, click on the System link. From here you can view the licensing information of your installation, web adaptor configurations, and the directories where logs, tile caches, and other files are stored, among other things. Click on the webadaptors link. You will probably only see one web adaptor, with a long alpha-numeric name, listed. Click on the web adaptor name and you'll see that it specifies the name of the machine, its IP address, and the port (80 or 443) that it uses. In a production setting, the web adaptor will specify the fully-qualified domain name (e.g., baxtergeog865####.e-education.psu.edu) of your server and its public IP address (your Elastic IP). Recall that the web adaptors link our ArcGIS sites with the machine's web server, which in our case is IIS (Internet Information Services). There will be a separate web adaptor configured for the server and portal portions of your site. In the cloud formation template, we specified a name for our server site ("server") and our portal site ("portal"). The cloud formation template didn't do that for us here (although our sites still work), but in a production setting, you will have web adaptors listed here that link both the server and portal urls to your installation.
Finally, let's open our web server to see that both the server and portal folders have been created for us. From the desktop of your EC2 instance, click the Start button and type IIS. Click on Internet Information Services Manager when it appears in the list. Expand your server to view the contents of the Default Web Site. You should see two virtual directories listed: server and portal.

Virtual directories link a url folder name to a physical folder location on our server. The urls for these two directories take the form:
- https://baxtergeog865####.e-education.psu.edu/server
- https://baxtergeog865####.e-education.psu.edu/portal
Enter each of these in a new browser window and you will see that they take you to your server and portal sites. Back in IIS, right-click on either the portal or server virtual directory, choose Manage Application, and click Advanced Settings. You will see a path on your server's C: drive that contains the web content for each site. You can use Windows Explorer to browse to those folders and see their contents. In summary, the web adaptors link the two urls above to the virtual directories in the web server. When installing ArcGIS Enterprise in a production setting or using tools other than cloud formation, there is a post-install setup procedure to get this all configured. Esri provides documentation [2] detailing how that process works. Not something we want to mess with here, but something you'll need to do when configuring ArcGIS Enterprise in your production environment.