Designing a map for tiling
You'll find during this lesson that a rasterized tiled map service takes a lot of planning. Let's look at a few of the considerations needed to get a map ready for publishing as a tiled service. You'll download and examine a predesigned map and publish it as a service in preparation for making some tiles yourself.
To cache or not to cache?
The first question to settle is whether or not to make a tile cache at all. If the map is going to put strain on your server or take a noticeable amount of time to draw (these two often go together), then you need to consider making a tile cache. Most vector basemaps that give geographic context to your web map contain a lot of layers and fall into this category. This is one reason that splitting up your layers into basemap services and business layer services is a good idea; you can potentially cache the basemap while leaving the business layers uncached.
Is it necessary to cache the business layers, since that kind of data changes more frequently? Google used to do it with the Wikipedia layer in Google Maps [1]. With so many features (Wikipedia articles) to show, and with the amount of traffic Google Maps receives, it was burdensome on the servers to draw those points on the fly. (Sadly, the Wikipedia layer is no longer offered.)
In addition to high traffic scenarios, you can also consider caching business layers when the map covers a relatively small extent, the data doesn't change very often, or the data is displayed at small scales only. Layers like weather radar need to be updated frequently, but are rarely viewed at large scales and require relatively few tiles in the cache, thus the update can be performed in a reasonable amount of time.
Choosing scales
There are a lot of decisions you need to make about how to set up your tile cache, but the first choice is the set of scales at which you are going to generate tiles. These scales represent the snapshots at which web users will see your map. They also determine how long it's going to take to create the cache, and which other web services the cache will be able to overlay. Ideally, you'll decide on your set of cache scales before you start designing your map.
Keep these things in mind when choosing a set of scales:
- If you already know that your map is going to overlay, or be interchangeable with, another tiled map service, then you should match the scales of that map service. Many server administrators set out to build caches that will overlay Google Maps, Bing Maps, or ArcGIS Online. In these cases, the choice of scales is easy. You have to match the Google/Bing/Esri scales, which are thankfully the same and are built into ArcGIS Server as an option.
- Larger scales require more tiles to cover the extent of the map. It takes four times as many tiles to cache a map at 1:1000 than at 1:2000. Thus, avoid building tiles at scales zoomed in farther than you need to see. It's worth noting that you can put scales in your "tiling scheme" (the Esri term for a set of scales and other cache properties), but you don't necessarily have to build tiles at all those scales. For example, in this lesson, you'll choose to use the Google/Bing/Esri tiling scheme which includes scales all the way down to approximately 1:1000, but you won't build tiles at the largest scales, because those aren't necessary for your map.
- Most tiled web maps halve the scale's denominator when zooming in (for example, the next scale beyond 1:48000 would be 1:24000, then 1:12000 and so on). The Google/Bing/Esri tiling scheme follows this pattern, and if you decide to enter your own scales, you might choose to follow it as well. Scale sets that increase slower than this rate tend to make the user feel some tedium when zooming in, and can cause you to create a lot more tiles than you really need.
Designing the map
Creating detailed vector basemaps of the type that are typically cached presents a grand cartographic challenge. In contrast to paper cartography, in which the map has to be designed at just one scale, the web basemap has to be designed to look good at every scale in your tiling scheme.
Designing this type of multilevel basemap can require you to include varying symbols at different levels of your map. For example, a road might be represented with a 3-point line width at a large scale, a 1-point width at a medium scale, and may not be visible at all at a small scale. Since ArcMap does not allow scale-dependent symbols, you'll sometimes need to add multiple copies of the same layer into your map, set different scale ranges on them, then assign appropriate symbols for each scale range.
It's also important to choose muted colors for the base map that look good, but do not overwhelm other layers placed on top. Go to Google Maps: Designing the Modern Atlas [2] to see some examples of how the Google Map design has toned itself down over time to be more accommodating to overlays.The Esri Light Gray Canvas basemap is another study of designing a basemap specifically as a backdrop for more important thematic or operational layers.
When web mapping exploded during the past two decades, some cartographers expressed their chagrin at the simple, uniform maps churned out by websites. Some may have thought their very jobs and livelihood were threatened. However, the years have shown that cartography holds a critical place in web mapping. Projects like the OpenStreetMap terrain layer [3] and the Esri World Topographic Map [4] incorporate very advanced cartographic techniques. In a sense, map tiling gave cartographers a ticket to ride in the web world, since these detailed maps would be too slow to serve dynamically.
No wonder some GIS professionals shrink at the thought of trying to design such a map on their own. Some organizations that lack an in-house cartographer have just limped along with the same symbols they used when more primitive map server technology was available. Others have imitated the colors and symbols of the ubiquitous Google Maps in their own basemaps (perhaps in response to a manager's demand, "Make our maps look like that!").
In response to queries about how the ArcGIS Online basemaps were constructed, Esri has released sample ArcMap documents using all the ArcGIS Online base map symbols. People can insert their own data into the map or simply copy the symbol settings into their own maps. Examining one of these maps provides a good lesson in multilayer basemap design.
Examining and publishing a street map
In this part of the lesson, you'll download and examine a map template that Esri has provided for the ArcGIS Online street map. This sample map covers the Little Rock, Arkansas region. You'll then publish the map as a service and get it ready for creating tiles in the next section of the lesson.
- If necessary, start your ArcGIS Server site. You will need to use your instance a few steps down the road.
- On your local machine, open a web browser to the ArcGIS.com map viewer [5] (which you used in Lessons 2 and 3) and then choose the Streets basemap.
This is an approximation of the map you'll be working within this part of the lesson (I say approximation because Esri has updated some of the symbols slightly since they released the template you're going to download). Zoom in and take note of some of the layers that appear and disappear as you do so. Also, note how the symbols for features like rivers and cities change as you zoom in and out. - On your EC2 instance, extract the street map template files found in the Course Resources module in Canvas into a location under C:\data. The cleanest way to organize it may be to place the map and data directly under a folder named C:\data\LittleRock. Notice that the files include an MXD and a file geodatabase with a bunch of sample data.
- On your EC2 instance, import and open StMap_Template_LittleRock_WebM.mxd in ArcGIS Pro.
- Save your ArcGIS Pro project.
The first thing you should notice is how long it takes this map to draw and label. Take a look at the number of group layers and sublayers in the table of contents, and you'll see why. In addition to the sheer number of layers available, a lot of the layers are symbolized with complex symbols such as multilayer lines that take more time to draw. The performance of this map on the web will not be acceptable unless it is tiled.
The map coordinate system is WGS 1984 Web Mercator (essentially the same as WGS 1984 Web Mercator (Auxiliary Sphere), which you used in previous lessons). This is the projection used by ArcGIS Online, Bing Maps, and Google Maps. It was not designed for geographic accuracy nor aesthetic purposes, rather for convenience. You could fit the whole world on a square tile. You'll go ahead and use this projection in this lesson, even though you can certainly make a tile cache in whatever projection you want.
As you examine the table of contents, notice that this map is organized with group layers, each corresponding to a scale range. This particular map is designed for viewing at about 1:1,000,000 scale down to 1:4,500 scale. Any other scale is not going to result in a map being drawn. The layers were painstakingly copied, symbolized, and grouped so that the map would look good at each scale.
To view the map at the ArcGIS Online, Bing, and Google scales, click the scale dropdown at the bottom of the ArcGIS Pro map and click Customize.
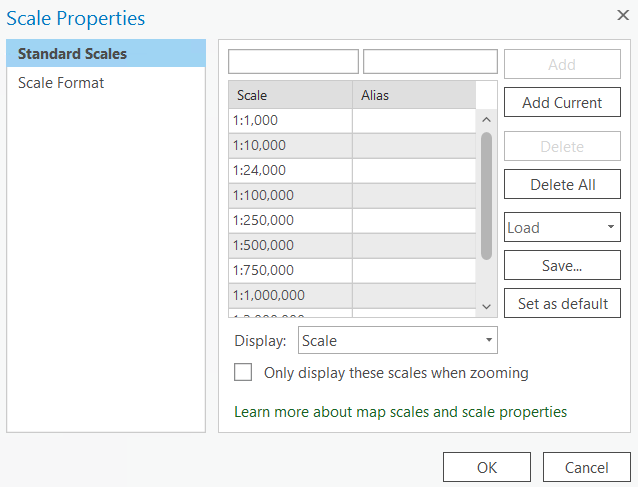 Figure 4.1 Customizing the scales list
Then click Load, and click ArcGIS Online / Bing Maps / Google Maps. Click OK, and you will see the ArcGIS Online, Bing, and Google scales appear in the dropdown. Take some time to jump between them and examine the layers and symbols that will be in your tile cache.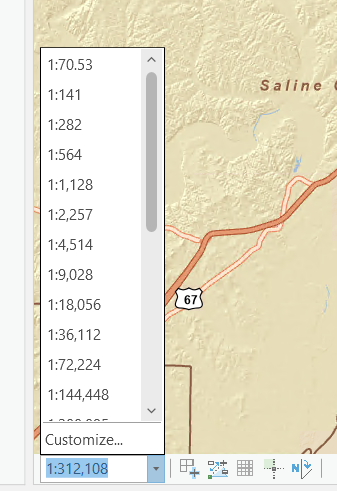 Figure 4.2 The ArcGIS Online, Bing, and Google scales appear in the dropdown menu
- Navigate your map so that it covers the full Little Rock region and then save the ArcGIS Pro project.
- Leaving ArcGIS Pro open, move on to the next part of the lesson.