Lesson 6: Project Resource and Cost Estimation
Lesson 6 Introduction
Lesson 6 Introduction-Project Resource and Cost Estimation
Lesson 6 Overview
It's time for the bottom line. A large part of project success is completing planned work and deliverables within an established budget. That budget results from an estimation of labor time and direct monetary expenses attributable to the project.
Learning Objectives
By the end of this lesson, you should be able to:
- describe the basic principles and concepts of cost management;
- describe key inputs into cost estimates and budgets;
- assign resources (team labor time and monetary costs) to project tasks; and
- understand earned value management (EVM) as a means to track and manage project resources.
See the checklist page for readings, quiz, and assignment work in this Lesson.
Questions?
If you have any questions or would like to brainstorm ideas, please contact the instructor by phone or email. Also, feel free to communicate with your fellow students via the Discussion Forum or email.
Lesson 6 Checklist
Lesson 6 Checklist
Lesson 6 is one week in length. (See the Calendar for specific due dates.) To finish this lesson, you must complete the activities listed below. You may find it useful to print this page out first so that you can follow along with the directions.
| Step | Activity | Directions |
|---|---|---|
| 1 | Reading | Lesson 6 online course content |
| 2 | Reading | Croswell Chapter 5 (Sections 5.1, 5.2) |
| 3 | OPTIONAL Reading | ISD Project Management White Paper--What is the status of your project? [1] |
| 4 | Quiz 4 | Complete Quiz 4 in Lesson 6 |
| 5 |
Complete Assignment #5 (Project Budget) |
See assignment instructions and Canvas Course Calendar for due date |
| 6 | Participate in Week 6 Discussion Forum:
|
Access Lesson 6 Discussion Forum. Suggested topic - Why do some GIS projects take twice as long as estimated to complete? |
Cost Management
Cost Management
Project cost management includes preparation of the project budget as part of the project planning process and financial management during project execution. Projecting budgeting involves making an estimation of resources required to complete a project. In a project management context, a resource is a tangible entity to which a value may be assigned. Resources may be people (expressed in labor time with an associated dollar rate), monetary (money used for project expenses), and equipment. In preparation of a budget, each of these types of resources is expressed in monetary terms (i.e., direct expenditures and costs for labor time or equipment usage). Depending on the type of project, there are a range of cost categories that should be included in cost estimation. For GIS projects, it is good practice to examine and tabulate all costs that are attributable to the project, such as:
- labor time of the organization's existing staff or new staff hired for the project (normally measured as a monetary rate by time--hour, day, or month);
- contracted staff (cost for project team members provided through a contract with an external organization or company);
- contracted services--costs for specific deliverables provided, under contract, by a consultant or contractor (e.g., GIS consultant providing GIS design and development services, GIS contractor performing database collection or development, firm providing aerial data collection and processing);
- computer hardware, network, equipment, and system maintenance and administration services (costs for the purchasing or leasing of computer servers, network devices, desktop computers, mobile devices, survey equipment, etc., and paid services for system maintenance);
- computer software (costs for licensing of server and desktop software and mobile device apps required for the project). Also, may include ongoing costs for Web-based software and applications. This includes cloud-based services, also known as "software as a service" (SaaS). Applications and services provided by the Esri ArcGIS Online service is a prominent example;
- network and Web services (costs for provision of cellular or broadband communication services, Web hosting services, and related costs);
- GIS data (costs for the purchasing, licensing, or subscriptions to existing spatial data provided by an outside party);
- training (costs for specialized training, such as software training for team members, which is necessary for the project); and
- travel expenses (costs for ground and air transportation, lodging, meals, and other costs associated with travel required for the project).
Direct and indirect costs are related concepts explained below:
- Labor costs reflect the costs, and value, for people working on a project. Labor is typically measured in time--specific time in which a team member is working on the project (usually in hours or days). In most organizations, labor time has a monetary value that can be quantified on the basis of that person's total compensation (pay rate and benefits). Such quantification is typically calculated for employees in private-sector firms (e.g., dollar rate per hour) but is less often formally done for government agency employees. But the point is, labor time has a cost to the organization, which can be derived based on the employee's compensation and work time.
- Most of the items in the list above present typical direct costs, which are monetary costs for tangible products or services acquired and tracked specifically for the project. Direct expenditures are easy to understand in the case of travel expenses or computer hardware and software purchased or leased specifically to support the project. Direct costs also include monetary expenditures for purchased services (e.g., costs for a GIS contractor for data collection or application development) as well as other monetary costs specifically assigned to the project.
- Indirect costs represent costs that are incurred by an organization carrying out a project, but which are not specifically accounted for or tracked as part of a project. As such, indirect costs are often tallied for the entire organization and not assigned to individual projects. Indirect costs are sometimes called overhead, and includes a range of things such as: building rent and operational costs (utilities, maintenance, custodial services); insurance fees; tax payments; employee training not attributable to a specific project; and costs for office furniture, equipment, and computer hardware which is not accounted for through specific projects. In private companies, staff time which is not billed to a specific project, and therefore does not bring in revenue (administrative staff, marketing and sales staff), is also considered overhead. An indirect cost in one organization may be managed as a direct cost in another. For example, some organizations may have copy machines that keep track of identity numbers and allow copies to be billed back to individual projects. In the past, some GIS labs with processing capability that was high end at the time accounted for and billed projects based on central processing unit (CPU) usage. Many government agencies and private companies account for overhead costs as a "multiplier" applied to employee billable rates. For instance, private GIS consulting companies typically establish hourly or daily monetary rates that take into account the employee's base salary, benefits (like health insurance), and a portion of the company's overhead costs.
When organizations are calculating the monetary rate to for labor time expended on a project, it is typical to start with the cost of an employee's total compensation also called the base rate (pay and direct benefits). Then, apply some additional costs expressed as multipliers. A multiplier is a factor applied to the base rate to reflect other costs of the organization beyond the employee's compensation and to determine the billing rate for that person or for an entire job classification. Here's an example: An employee's base rate (total compensation) is $40 per hour, and the overhead multiplier used by the organization is 1.5. The billing (or "billable") rate for that person would be $60.00 per hour. Private companies may also apply another type of multiplier to take into account expected profit. The profit multiplier is normally expressed as a percentage of the base rate. Using the example above, if the targeted profit is 20%, add another $8 to the rate yielding $68 per hour. In practice, some organizations may have other types of multipliers that are also applied to calculate labor rates. Also, private companies, in setting their billable rates, take into account market forces, level of demand, and other factors.
Project Resources and Cost Management
Project Resources and Cost Management
Project managers must account for the cost of all resources that will be necessary to meet the scope of the project within the scheduled time. This is a difficult thing to do well. If enough resources are not allocated, the project will exhaust the budget before completion. Some unseasoned project managers, seeking to get funding approval to carry out a planned project, are apt to underestimate costs in order to make the project more attractive and increase the likelihood of approval. That approach is counter-productive because it often results in a shortfall of necessary funds or staff resources to complete the work. It is much better to fully estimate costs and apply a reasonable contingency to account for project risks that could impact resource requirements. It is vastly better to complete the project under-budget than be forced to "pass the hat" to obtain more funding to complete project work.
Organizations have many strategies for most effectively using project resources while managing costs. Some government agencies and private companies have put in place a project management office (PMO). A PMO establishes best practices for project planning and management, provides templates for planning and monitoring, assembles a library of information on past projects, and provides support to project managers and teams.
Estimating labor time and direct expenses for projects is challenging--particularly for an organization or an assigned project manager that has limited experience in similar projects. Sound project budgeting can take a considerable amount of research and time, but that is a worthwhile investment. Some general practices that can help in estimating project resources are:
- examine work plans and budgets for similar, past projects in your organization, and consult with personnel involved in those projects;
- communicate with peers and colleagues in other organizations about their experience on similar projects;
- do necessary research on direct expense items (costs for travel, computer software, equipment);
- contact vendors and contractors to get input about potential costs for contracted services (e.g., field data collection) based on their experience in similar projects;
- use a cost estimation tool (like a formatted spreadsheet) with sufficient detail to capture labor time and rates and all direct cost items;
- use the cost estimation tool to generate high-cost and low-cost versions and use that as a basis to prepare a final budget.
Estimating resources and preparation of project budgets is tricky, but becomes easier as your experience in project planning increases. But in many cases, it is necessary to do some research to gather figures and not just "pull numbers out of the air". The success of your project and of you as project manager depends on doing as effective job as possible with budgeting. Estimating labor time can be particularly challenging. In most GIS projects, you need to focus on actual work time for project team members, not the duration (calendar time) of a task. For instance, a project may have a task called "prepare geodatabase design". The work and completion of that task may occur over a 2-week period (taking into account some delays, wait time for review and comment, etc.) but the actual labor time might be only 30 hours or less. The point is that for many GIS projects, team members may not be assigned full-time to one project or a specific task. It is more typical for an employee's time to be allocated to multiple projects or support tasks. Task duration (calendar time) and labor time are related, but they are DIFFERENT and measured or tracked separately.
Cost Control and Earned Value Management
Cost Control and Earned Value Management
Cost control includes monitoring cost, task completion, and time. If the total cost of a project at a given time is over the cost baseline, cost control measures may be necessary. Such project management actions may range from ensuring that only tasks within the scope of the work are being performed to alerting stakeholders of potential cost overruns. As a project manager, it is important, professional, and ethical to identify and report on these issues as soon as they are identified. Effective techniques exist to help you in this matter.
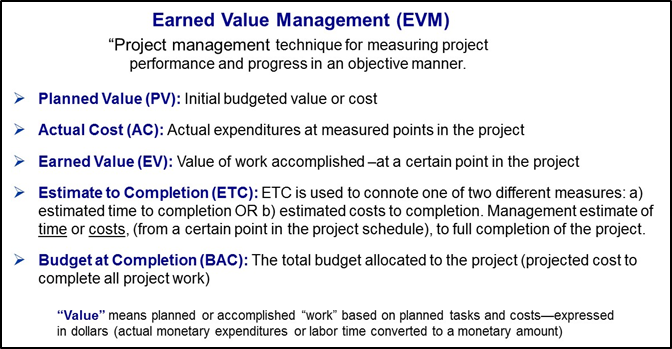
Earned value management (EVM) is an effective technique for tracking costs and examining project expenditures relative to completed work. Its strength is that it looks at cost, time, and task completion within the scope of the project simultaneously. It uses a WBS and budget created during the development stage, but tracks these metrics during the implementation stage of a project life cycle. The basic measures in EVM are explained in Figure 6-1.
Click for a text description of Figure 6-1: Earned Value Management Measures
This figure is mainly text and explains Earned Value Management concepts. The title, centered at the top with a centered text, reads, “Earned Value Management (EVA)”. Below this title line is a text explanation below the title with the text, “Project management technique for measuring project performance and progress in an objective manner”. Bullet points below this text lists the following five left justified bullet points defining key EVA terms:
- Planned Value (PV): Initial budgeted value or cost
- Actual Cost (AC): Actual expenditures at measured points in the project
- Earned Value (EV): Value of work accomplished –at a certain point in the project
- Estimate to Completion (ETC): ETC is used to connote one of two different measures: a) estimated time to completion OR b) estimated costs to completion. Management estimate of time or costs, (from a certain point in the project schedule), to full completion of the project.
- Budget at Completion (BAC): The total budget allocated to the project (projected cost to complete all project work)
A definition of “Value” is shown at the bottom. Value means planned or accomplished “work” based on planned tasks and costs—expressed in dollars (actual monetary expenditures or labor time converted to a monetary amount)
EVM uses tables and charts, such as is shown in Figure 6-2, below. The y-axis of the chart represents cost and the x-axis represents time. The planned value throughout the project can be plotted from values of cost and time contained in the project plan's WBS. In other words, if you plan to complete Tasks 1, 2, and 3 by the end of Week 4, the planned value at that time is the budgeted cost associated with these tasks. As the team implements the project, the actual cost can also be graphed. At any given time during the project, the actual cost is the total of direct and indirect costs incurred to complete tasks. If Tasks 1, 2, and 3 take more time or resources to complete than planned for, the actual cost will exceed the planned value, which, of course, is not good. On the chart, the actual cost line will begin to track above the planned value line.
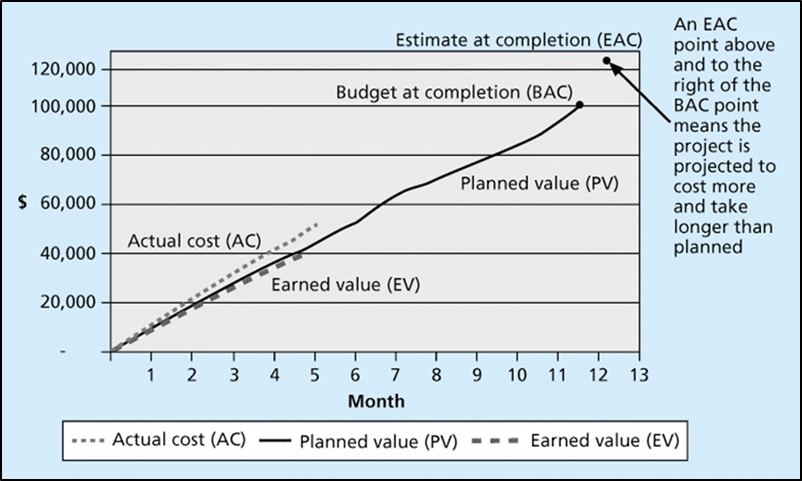
Click for a text description of Figure 6-2: Earned Value Management (EVM) Concepts
Another way to express this is that the value your team has earned is below the value that you as project manager planned. If Tasks 1, 2, and 3 are 90% complete after four weeks, you have earned 90% of the value you planned to earn. Earned value--the value of the tasks completed, can also be graphed on the same chart. In this bad news example, the earned value line would track beneath the planned value line. Because multiple tasks may be occurring simultaneously within a given project, it is necessary to track actual cost and earned value for all tasks to accurately access the earned value of the project.
Earned value and actual cost give different but complementary snapshots of how a project is going. For example, say your organization takes on a project that requires twice the resources planned for. Earned value could still track planned value if twice as many person-hours are assigned to the project. Actual cost, however, would be twice as high as planned value. Alternatively, the planned person-hour resources could be assigned to the project. In this case, actual cost would track planned value, but earned value would only be half of planned value.
Once a project goes awry, it is difficult to get actual cost or earned value back on the planned value baseline. Usually, the best that can be accomplished is that EV and AC will cease diverging from PV. By making necessary adjustments in resource allocation and scope, a project manager can lower actual costs from a specific project point to minimize the difference between the planned value (PV) and actual cost (AC).
EVM is important in that it synthesizes the planning, executing, and controlling process groups of project management. EVM is impossible without a project plan with a detailed WBS and budget. EVM also requires regular tracking during the implementation phase of the project life cycle. It can identify problems or issues early, when intervention or clarification from the project manager can be most useful to team members. It can be an aid to project managers required to file status reports. It is an important control management tool that a project manager has at her disposal during the critical part of the project life cycle when work is being completed.
A summary of important EVM project performance measures is provided in Table 6-1 below.
| Performance Measure | Formula | Description |
|---|---|---|
| Schedule Variance (SV) | EV-AC | Indicates the difference between the budgeted cost and the actual value of work completed at a given point in the project. A positive number indicates that project expenditures are less than expected. |
| Cost Variance (CV) | PV-AC | Indicates the difference between the budgeted cost and the actual cost at a point in the project. A positive number indicates that project expenditures are less than expected. Note: This performance measure does not necessarily indicate a project that is under budget or over budget, just the financial status relative to the project's schedule. A CPI or SV greater than "1" would indicate an under-budget project. |
| Cost Performance Index (CPI) | EV/AC | Compares expenditures to actual value at a point in the project. Values greater than 1 indicate a positive situation in a project with expenditures below budgeted amounts (under budget). |
| Schedule Performance Index (SPI) | EV/PV | Compares the expected value, planned work, and project results at a point in the project to the actual value of work achieved. Actual value at a point in the project. Values greater than 1 indicate a positive situation in a project, with the volume of work (productivity) exceeding the plan. |
Assignment #5 - Project Budget
Assignment #5 - Project Budget Overview
Submittal: See Canvas Calendar for Submittal Date
Total Points: 50 points - see rubric for details
It's time to apply the practices covered in this lesson to prepare a project budget (Assignment 5) for the Metropolis geodatabase project--taking into account the cost of labor time and all direct monetary costs that are attributable to the project work (e.g., travel expenses, equipment purchased specifically for the project, etc.). This project budget ONLY covers costs of the contractor hired by the City to perform the services defined in the City's RFP
You are the project manager for the contractor selected to carry out the City of Metropolis Geodatabase Development Project. You are now tasked with creating a detailed budget that covers all the costs your company will incur (not any other costs that the City Team may incur). Note: In actual practice, the budget would be prepared as part of your company's proposal in response to the City's RFP (and perhaps amended as part of contract negotiations). For the purposes of this Assignment, assume that the City has accepted your company’s proposed budget between $170,000 and $220,000, and now you are refining that and providing a more detailed breakdown by task and project team member.
Your Submittal for Assignment #5
For Assignment #5, you, as the Contractor’s Project Manager, will set up a budget table and enter data to generate cost estimates (labor costs and direct monetary expenses) for the project. Cost estimates will be presented by task and subtask. The best and most thorough way to do this is to start with your WBS task hierarchy (from Assignment 4) and go down each task and make an estimate of labor hours and direct costs (e.g., travel expenses, equipment costs, etc.) associated with that task. The best tool to use is a spreadsheet like Excel. To give you an idea of an acceptable format for project cost estimation, take a look at the sample project spreadsheet [2]. This is an Excel spreadsheet tool to calculate costs based on figures entered by task You may use this example as a template for this Assignment or come up with your own format. You will need to set "billable rates" for your project team members (identified in Assignment 3) and make estimates for direct expenses (purchase of equipment or software, travel expenses, etc.) that are likely to be needed for this project. Take some time to apply some formatting to make the budget presentation attractive and easy to read (apply appropriate fonts types, spacing, borders, etc.).
NOTES: While it is important to use your WBS task hierarchy (Assignment #4), as a basis for this the project budget, it is OK to generalize the task hierarchy For example, if your WBS hierarchy was at a 3-level or 4-level task detail, you can summarize up to the 2nd-level tasks. Include subtotals for each high-level task. It is expected that you will review instructor comments on Assignment #3 (contractor team), and make some adjustments in your team and rates reflecting instructor comments. Also, make sure the functional role (e.g., "field data collector") of each team member is explained somewhere (e.g., in a footnote). Do your best to estimate hours for team members for particular parts of the project. Keep in mind the discussion about billable time vs task duration or "calendar time". As you apply hours for specific tasks, make sure this is your estimate of time actually working on the task--not calendar time. For instance, you might have a task for "pilot project planning". Such a task might occur over a period of 2 weeks, with time for City team review and comment, but the actual labor (work) time for one or more contractor team members might only be 22 hours.
As in all assignments, your document should include a title, identification of the Assignment number and name, your name, and date. In header rows above the table or spreadsheet, you should also identify the project name, your contractor name, and some brief notes explaining this budget submittal.
Assignment Submittal and Grading
Upload your spreadsheet at the Assignment #5: Budget page. See Canvas Calendar for submittal date. The grading rubric and information below.
Assignment #5 is worth 50 points. The grading approach is explained in the table below.
Your submittal will be graded based on:
- completeness of budget preparation (Does the estimation take into account the major labor and direct expenses required?)
- presentation format (level of detail and presentation format)
- accuracy of budget estimation. NOTE: There is not a single dollar amount that is correct for the Metropolis project budget. Grading for "accuracy" is based on evidence that you have done some research of industry costs for this type of project.
The instructor may deduct points if the Assignment is turned in late, unless a late submittal has been approved by the Instructor prior to the Assignment submittal date.
| Grading Category | Basis for Scoring | Total Possible Points |
Point Award Explanation |
|---|---|---|---|
| A. Completeness and Organization of Budget |
|
20 |
|
| B. Accuracy of Costs |
|
18 |
|
| C. Budget Table Formatting |
|
12 |
|