Lesson 8: Project Risk Management
Lesson 8 Introduction
Lesson 8 Introduction-Project Risk Management
Lesson 8 Overview
If project circumstances remained the same from start to finish, GIS managers could prepare a good plan, assign resources, and watch the project run smoothly to completion. But projects are executed in a dynamic environment in which conditions change, and risks are present that can affect timing, cost, scope, methods, and project team members. GIS managers should, therefore, adopt effective practices for change and risk management—with the goal of preparing for changes and risk events and then taking action early to avoid, or at least reduce, negative impacts.
General Dwight Eisenhower was quoted as saying, "In preparing for battle, I have found plans to be useless, but planning to be essential." While your instructor would not agree that plans are useless for GIS projects, Eisenhower's point is that going through the exercise of planning--defining objectives (and deliverables), laying out an approach (WBS), assigning resources, and having in place effective monitoring and communications methods provides an organized basis for executing the project, making adjustments as necessary, and delivering results. Risk management and change management is an important part of project planning and execution.
Except in extreme cases, projects can accommodate changes without major disruption, if project planning anticipates potential impacts and strategies are put in place to respond to them in effective ways. This lesson deals with a critical aspect of project planning and management--proven practices and methods for managing risk and project changes in a way that will keep projects on track and deliver results that meet specifications.
Learning Objectives
By the end of this lesson, you should be able to:
- understand the purpose and basic concepts of risk management and how it is a part of project planning and execution
- learn how to identify and categorize project risks
- prepare a risk management matrix including assignment of levels of risk impact and probability
- understand risk response strategies from the PMI (avoidance, mitigation, transference, and acceptance)
- carry out a risk analysis including a detailed risk analysis, identification of triggers, and specific risk response actions
- get familiar with the concepts of "change management" (the "first cousin" of risk management)
See the checklist page for readings, quiz, and assignment work in this Lesson.
Questions?
If you have any questions or would like to brainstorm ideas, please contact the instructor by phone or email. Also, feel free to communicate with your fellow students via the Discussion Forum or email.
Lesson 8 Checklist
Lesson 8 Checklist
Lesson 8 is one week in length. (See the Calendar for specific due dates.) To finish this lesson, you must complete the activities listed below. You may find it useful to print this page first so that you can follow along with the directions.
| Step | Activity | Directions |
|---|---|---|
| 1 | Reading | Lesson 8 online course content |
| 2 |
Re-reading |
Croswell, re-read Chapter 9 (Section 9.3) |
| 3 | OPTIONAL Reading | ISD Project Management White Paper Series--Whose fault is it? [1] |
| 4 | Quiz 6 | Complete Quiz 6 in Lesson 8 |
| 5 |
Complete and submit Team Assignment #6 (Quality Management) |
See assignment instructions and Canvas Course Calendar for due date |
| 6 | Start work on Team Assignment #7 (Risk Management) | See assignment instructions and Canvas Course Calendar for due date |
Understanding Risk Management
Understanding Risk Management
Overview on Project Risk
Consider a project case involving the acquisition and processing of digital imagery and LiDAR data for a large in the spring (leaf-off coverage). You are managing the project and have hired an aerial survey firm to conduct the work. The contract with this firm takes into account some weather problems (e.g., storm conditions and cloud cover) that require the contractor to do some schedule adjustment for the aerial mission. However, during the contracted period of acquisition, the weather conditions are very bad--extended storms and cloud cover conditions that create major schedule problems for the flights (potentially beyond contract terms for schedule adjustment) and present obstacles for acquiring cloud-free coverage in the entire area. In addition, there is some major flooding in some parts of the acquisition area covering some roads and properties. This situation could impact the project cost, schedule, and possibly the quality of the products. In this case, the weather is a risk event which, as the project manager, you must address. How do you handle this?
Risk is unavoidable in GIS and other IT projects. The central theme of this lesson is to take into account potential risk events, which may impact project schedule, cost, quality, etc. in project planning and execution. The purpose of risk management is to position you to better identify risk events early and take action that can eliminate or reduce negative effects of those risks on the project.
Since 1994, the Standish Group, a well-known research and consulting company, has conducted major studies of IT projects in a large number of organizations and examined the success of those projects in comparison to their planned objectives, timing, and budget. The products from these studies, known as CHAOS reports, have consistently shown that many IT projects (more than 50 percent) had substantial overruns in schedule and budget and that about 30 percent of them were failures and were canceled—and this is the case in the most recent version (Standish Group, 2020). The Standish Group also studied the reasons for IT project failures and concluded that the greatest causes had to do with inadequate planning (including the lack of a sound assessment of requirements) and poor project management during execution.
The good news from this study is that these problems can be overcome by proper project planning before the implementation begins and putting in place effective project monitoring, reporting, work delegation, and communications. Is it safe to take conclusions from the Standish CHAOS Reports and apply them to GIS projects? Yes, "mainstream IT" and GIS projects are generally complex and incorporate the most recent technology tools, methods, and the need to involve users and subject matter experts in design and development. Many other risks associated with design and analysis should be capable of being translated from the world of IT to GIS.
Risk Management Terminology
- Risk - an uncertainty that can have a negative or, less frequently, a positive impact on meeting project objectives.
- Risk Event - a potential event or condition that cannot be fully predicted and which may have an impact on the schedule, cost, quality, or overall scope of a project.
- Risk Management - a systematic process of identifying, analyzing, and describing potential risks and active monitoring and response during project execution.
- Risk Category - Risks are normally classified into several categories, appropriate for the project, to help understanding and monitoring of risk events. The number of categories should be low (e.g., from 3 to 6).
- Risk Identification Register - Identification of the full set of risk for a project, usually in table form, that includes, at a minimum, the name of the risk, a risk ID# (usually with a alpha code corresponding to a risk category), and a description of the risk. Sometimes, risk registors include other information to characterizing risks (triggers, probability of occurence, impact level, etc.). See Figure 8-1.
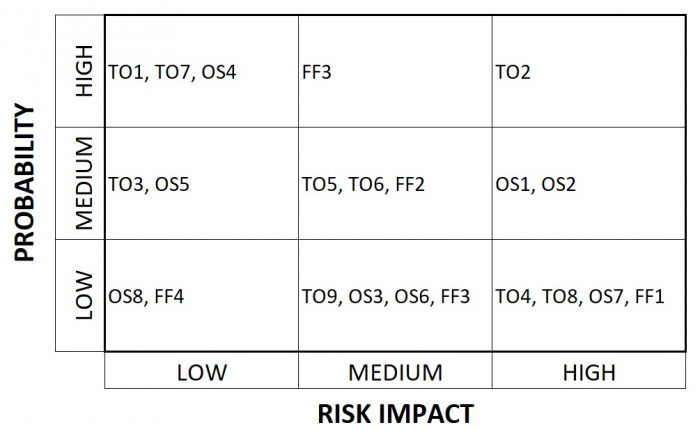
- Risk Matrix - a 2-dimensional grid that organizes risks (from the Risk Register) into classes of probability (of the risk event occurring) and the level of impact on the project. See Figure 8-2.
- Risk Analysis- the processing of identifying and describing potential risks, the probability of occurrence, and the potential project impacts. The results of the risk analysis are presented in a risk matrix.
- Risk Response Strategy - a type of action that can be taken to respond to the risk and control the impacts from risk events--usually lowering negative impact on a project's scope, schedule, deliverable quality, or cost. The PMI categorizes risk response strategies--the main ones being: avoidance, mitigation, and transference.
- Risk Management Plan - an assignment of responsibilities for risk monitoring and a description of actions to be taken in response to risk events.
Why should you carry out risk planning and put in place sound risk management practices? Because it:
- raises the profile of a GIS project by conveying its importance to the organization and helping to sustain support and necessary resources from senior management;
- puts the project in a much better position to deal with problems and changes early and to take action so that negative impacts are avoided or reduced;
- gives the project team confidence that unforeseen events will be handled in an organized way.
Risk Identification and Preparation of a Risk Matrix
The level of detail, time, and rigor required for risk planning depends largely on the size, budget, and complexity of the project. For simple projects with a small project team and budget and short time frame, risk identification may be quick and risk monitoring can be handled much more informally than with larger projects. A suggested first step in risk identification is to describe categories for organizing risks. In GIS projects, risks and risk events can often be organized into the following categories:
- Technical/Operational: Includes risks associated with the technological and operational aspects of the GIS program or project, including hardware and software, network configuration, database development, security breaches, and the procedural workflows associated with technology acquisition and implementation. These risks reflect potential technical obstacles in system development that could impact costs or the schedule.
- Organizational/Staff Resource: Includes all aspects of organizational relationships, management, assignments, GIS governance structure, high-level legislative and executive support, legal and policy rulings, and all types of political and media influences on the organization and the GIS project and program. This category also includes staffing allocation and participation issues.
- Funding/Finances: Includes risks associated with allocating and sustaining funding for GIS operations. This includes internal decisions inside the organization that impact funding streams for GIS, as well as external economic changes that impact resources available for GIS.
The risk categories for a specific project may vary but it is a good idea to limit the number of categories to no more than 5 or 6.
Consider a major project for field data collection and application development (like the Metropolis Geodatabase Project that we are using in course assignments). This type of project has risks associated with each of the three categories above. An example of risks/risk events that fall into "Technical/Operational" (TO) and Organizational/Staff Resource (OS) categories is shown in Table 8-1 below. In this table, the "Triggers/Indicators" column represent events or circumstances that can be monitored and may arise that allow a project manager to take action to address the risk.
| Risk/Risk Event Examples | Description | Triggers/Indicators |
|---|---|---|
| TO1: Field Conditions Inhibit Quick and Accurate Positioning with GNSS Collection Devices | The GNSS data collection devices being used encounter satellite reception problems in some areas of City resulting from weather problems or "urban canyon" (tall buildings) conditions. These problems cause problems with simultaneous signal acquisition of enough satellites to get a quick, accurate position at the location which can impact occupation time at that site, the need to revisit the location, or other technical work-arounds. |
|
| TO2: City Signs Blocked Or Obscured in Field | In some cases, City signs are difficult to find or access which complicates the process for position and data acquisition. This problem is aggravated by quality problems with the original City source data which is out of date and inaccurate. Some signs, because of their location (alleys, behind buildings), are difficult to find. In other cases, signs may be blocked by vehicles or other obstructions which may cause problems in getting accurate positions. |
|
| OS1: Contractor Team Member Leaving Leaves Participation in the Project | A member of the contractor's team leaves the team or employment with the company. This could result from: a) employee makes decision to leave employment with the contractor company, b) employee is moved moved to another project by the contractor because of company workload issues, c) employee behavior or performance problems result in removal from project or termination from company. This potential disrupts project work. |
|
| OS2: Inadequate Participation by City Team | A member or members of the City's project team are not meeting expectations in the level of participation or required timing in the project. This results in poor response for information needed by contractor (e.g., providing City source data, answering contractor questions), inadequate review comments during quality assurance work, or other project activities requiring City participation. This potentially impacts the project schedule or quality of deliverables. |
|
Other Common Technical and Operational Risks:
- unanticipated installation or deployment problems with new software package
- system crash or other unanticipated hardware problems result in delays, lost data, and unanticipated costs
- users state requirements for additional data (not originally in scope)--"scope creep"
- source materials being used for database development are missing or are of lower quality than anticipated
- technical problems with access/integration with the external system
- performance/response time problems with the software or custom GIS application
Like other aspects of project planning, a sound, comprehensive risk analysis takes time and some research--particularly for larger, more complex projects. Brainstorming with subject matter experts (e.g., IT system or database administration staff) and other experienced project managers, inside and outside of your organization will help in the risk analysis. A project manager also needs to decide how detailed or "granular" the identification of risks should. Just like breaking project tasks into subtasks, risks can be defined at different levels of detail. The general rule is to define risks at the lowest level of detail needed to support comprehensive risk management--and don't make it any more detailed than is necessary.
Types of Project Impacts from Risk Events
How can project risks impact projects? Answering this question is part of risk analysis, which helps examine how risks can have an effect on:
- Budget: impacts on the anticipated (planned or budgeted) monetary cost, staff levels, or other tangible resources for the project or program;
- Schedule/Timing: impacts on the planned schedule and timing for completion of deliverables or milestones;
- Work scope and services: impacts on the nature, volume, contents, specifications, etc., of the products, services, and results planned for a project or defined for a GIS program;
- Quality of work and deliverables: impacts on the quality of products and services, which may relate to accuracy, amount of error, reduced performance (e.g., GIS application), etc.
Qualitative Risk Analysis
Qualitative Risk Analysis
Several qualitative approaches exist to characterize risk probability once they are identified. All of these will depend on someone or some group's judgment about the probability and impact of identified risks--augmented by information from past, similar projects if studies are available. Risk probability analysis can fall on one person, and that person may likely be the project manager. Alternatively, a project manager could compile a list of significant risks, and then ask the project team, clients, end users, sponsors, or experts in the field to rank each item in the list. In this way, each item can be ranked in a form of timely consensus.
A risk matrix takes such information on all identified risks and orders or assigns a probability to the risk and weight factor to the potential impact of the event occurring. In qualitative risk analysis, once all risks are ordered or assigned, probability and impact of various risks can be simply classified as high, medium, or low. In some cases, a "very high" classification is used. Risks of most concern should be those of high probability and high negative impact on the project. Risks of the least concern are those of low probability and low impact. The general format for a risk matrix is shown in Figure 8-1, below. As part of presenting a risk matrix, it is important to define the Probability and Impact categories. NOTE: This is just an example of a graphical tool (with a 3 by 3 grid) to display risk impact and probability. For Assignment #7, you may choose to create a more detailed grid with a larger number of impact and/or risk probability categories, perhaps assigning a qualitative scoring using number score (e.g., 1 to 5 or 1 to 10). Avoid making it more detailed than necessary to support an ability to analyze risk and apply risk response strategies during project execution.
Quantitative risk analysis is more complex than qualitative approaches. Quantitative risk analysis requires more data on past project performance and more rigorous analysis methods. Schwalbe (subsection 11.6--not required reading) discusses the use of quantitative methods that might be applicable to some types of projects. However, for IT and GIS projects, qualitative approaches are more frequently applied and may be preferable to quantitative methods, especially if factors such as probability and impact are difficult to quantify. It may be of no benefit to the planning of a project to spend additional time creating inexact metrics of risk if no such information exists.
Strategies to Respond to Risk
Strategies to Respond to Risk
The PMI PMBOK discusses approaches to project risk management and describes four main types of risk response strategies. With the exception of "risk acceptance" these strategies involve actions to eliminate or reduce the negative impacts of risk events and threats. The four strategies are
- Avoidance: adjusting a project plan (tasks, timing, resources, etc.) to protect objectives from negative impacts.
- Transference: transferring the consequences or responsibility of a risk to a third party. Transference does not eliminate a risk, it only shifts responsibility. The most common strategy for risk transference is through well-designed contracts for certain elements of the work.
- Mitigation: reduction in the probability and/or consequences of an adverse risk event to an acceptable level. Usually includes project controls for identifying risk events early in a project and taking formal action before impacts are great.
- Acceptance: the project manager and team understands the risk event or threat, but chooses not to make changes to the project plan or resources to respond to the risk.
Table 8-2 gives some examples of risk response strategies which are appropriate for different types of GIS projects. As in the case of risk identification, a project manager can define specific risk response actions in as detailed a manner as needed to support project management.
| Avoidance Strategies (Prepare plan and project controls to avoid or reduce impact) | Transference Strategies (Shift risk and responsibility to other party) | Mitigation Strategies (Reduce probability or impact by identifying risk event early and taking action) |
|---|---|---|
|
|
|
Change Management
Change Management
Change Management Context
The easiest way to control change of scope during a project would be to have no changes required. To this end, many organizations seek formal acceptance of the scope of a project from all interested stakeholders, a process called scope verification. This can work well if all stakeholders can be identified, and all of their potential needs documented. Important stakeholders, and the true clients of the project deliverables, are the end users. Special care should be taken to get input from team members and users, include stakeholders in scope definition, work closely with users during project execution, and query users upon delivery to improve future scoping work.
As the project progresses, additional work may be recognized that could be beneficial to GIS users but is not within the scope of the project. Although human nature often urges us to do the work because it is important, it is vital to keep the organization's and project's system boundaries in mind. The PMI uses the term, "gold plating", referring to a tendency to the addition of scope features to a project without any formal process to adjust tasks, resources, or schedule. This is a recipe for a failed project. There may be decisions to adjust scope during project execution (e.g., adding functionality features to a custom GIS application), but if this is done, formal changes to the project plan should be made and changes should be communicated to project stakeholders.
Additional work, agreed to by project stakeholders, can be included by formally changing the project scope/deliverables--along with changes to the schedule, budget, and team members assignments that are necessary to accomplish the revised scope. Change request forms can be used to redefine the scope, sometimes with corresponding changes in compensation and resources. Alternatively, a new project could be proposed by the client or GIS contractors to define and complete the additional work. In both cases, new system boundaries between the organizations have been drawn.
Change Management Explanation
"Change management" is a topic that may be considered a first cousin to "risk management". The term "risk management" is mainly used in project planning and management, whereas "change management" generally applies to overall programs. As described in Croswell, subsection 3.5, "change management" is defined as, "a structured approach to change in individuals, teams, organizations, and societies that enables the transition from a current state to a desired future state". There are two important perspectives for examining change in a GIS environment: a) Changes that impact a GIS program or project, AND b) Changes to the organization and its business processes that are induced by the adoption of GIS technology. Establishing effective change management practices first involves the identification of "change agents" and their sources. Change agents are events or conditions that exert change on a GIS program or project. As describe in Table 8-3 below, change agents may be internal to the organization or have an external source:
| Internal Change Sources and Forces | External Change Sources and Forces |
|---|---|
|
|
Successful change management works with project risk management to create an effective environment for identifying and handling changes to GIS projects and programs. This touches on a range of technical, organizational, and human resource issues. It means having plans put in place to respond positively to changes and, in many cases, to use GIS implementation as an opportunity to "force" worthwhile changes to programs and projects. An approach that addresses inherent inertia and resistance to change in many organizations and which looks at change as an opportunity for making improvements is ideal. Table 8-4 below lists some key ways to prepare for change and practices for effective change management.
| Preparation for Effective Change Management | Practices for Implementing/Managing Change |
|---|---|
|
|
Changes that impact project scope, cost, and timing can rarely be avoided. The important thing is to recognize changes and take appropriate action--make necessary, formal changes to the project plan and resource allocation and communicate these changes to staff, management, and stakeholders.
Assignment #7 - Risk Identification and Analysis
Assignment #7 - Risk Identification and Analysis
Assignment #7 Overview
Timing: See Canvas Calendar
Target Word Count: 1500-2500 words (this is just a target to provide a general idea on level of detail)
Total Points: 70 points - see rubric for details
Assignment #7 will also be completed as a team assignment. Teams for Assignment #7 will be the same as those assigned for Assignment #6. At the beginning of or prior to Week 8, the team should assign a different team leader to coordinate the team's work on Assignment #7. This Assignment follows work that you have already carried out in planning and preparing for the City of Metropolis Geodatabase Development Project in past assignments. Assignment #7 is to identify project risks, prepare a risk probability matrix, and carry out an analysis of selected risks (one for each team member). As described in Assignment #6, you may use any appropriate communication and group collaboration tools to support your work on this Assignment.
Your team represents the City’s contractor selected by the City to carry out the City of Metropolis Geodatabase Design and Development Project. Your company's senior management and the City's Project Manager have requested that you prepare a risk management plan that identifies potential risks and identifies risk management strategies. From the course content and readings, you know that the overall purpose of risk planning is to anticipate possible risk events and be ready to take appropriate action when risk events occur—to eliminate or reduce negative impacts on the project.
Your Submittal for Assignment #7
You may wish to begin this exercise with a brainstorming session about potential risks to get candidate risks “on the table” for consideration by the team, and then identify and refine that wording for risks that have some realistic chance of occurring in this project. For example, potential weather problems present a real obstacle to completing field data collection by the planned completion date. It is also an issue that the project manager will ultimately have to plan for, as opposed to other issues that may more align with company policy, such as employee retention policies. Also, a major disaster (e.g., your office burning down), is not a high-enough probability event that requires much time in planning. As described below, you will select several of the identified risks and carry out a risk analysis.
Your team will use the distilled list of risks to make a risk matrix (see Figure 8-1 for an example). The matrix will have at least three classes (high/medium/low) for probability and impact, but you may include more classes if you like. All team members should contribute to identifying risks and organizing them into the matrix. Remember that it is important to name risks effectively—use words that describe the risk event and point to the impact on the project (e.g., “injury of field technician disrupts data collection work”) After completion of the risk matrix, each team member should then select one of the identified risks which the team finds critical to the project. The team members will carry out and document a risk analysis for their selected risk.
In summary, the Risk Management Plan you submit should cover the following main parts:
- Cover page with prominent title and all necessary information identifying the course, assignment, author, and date. The main title of the document should be "RISK MANAGEMENT PLAN". The Cover Page should also reference "City of Metropolis" and the full project name and the name of your company. At the bottom of the Cover Page (right side is best), include the course name and number, assignment number, Team number and team members, and date.
- Table of Contents.
- Summary of the project and its deliverables so the reader can understand the context for risk management in this project.
- Explanation of risk management with a description of key terms (e.g., risk, risk event, risk response strategy, etc.). Make reference to the PMI PMBoK.
- Risk identification register which includes a comprehensive set of risks (for all aspects and deliverables of the project) organized into risk categories (e.g., "Technical/Operational"). This list should show, at a minimum, the risk ID number, a descriptive name* of the risk, and a short description. You can decide on your own risk categories. You should use an alphanumeric risk numbering scheme where the alpha code represents the risk category and sequential numbering within each category (e.g., TO1, TO2, etc.). You can decide on your own categories but the categories should be described. A table format works best for this. That description can be one or two sentecnes that explain the risk event, condition, or circumstance and how it could impact the project.
- Risk matrix similar to that shown in Figure 8-1 with classification for Impact and Probability. Be sure to include and introduction on what the purpose of the matrix is and how it suports project planning and provides a basis for managing the project. It is importnt to includes a description of what "Probability" and "Impact" mean in the context of the project. The classes (e.g., Low, Medium, High) should be described. If you want to add a "Very High" category that is OK. While these categories (H, M, L) are qualitative in nature, your description of them should give a picture of what they mean relative to the project. For instance, "High Impact" could be defined as, "Occurrence of this risk will cause major disruption of the project schedule, qualty, or budget and response sction should be taken immediately to eliminate or reduce the level of disruption". It is a good idea to describe the Probability categories as a projected likelihood of occurrence--e.g., "High Probability" means that there is an approximately 85% likelihood or greater of occurrence.
- Risk analysis (one selected risk for each person on the team). This is a detailed evaluation of each selected risk that should include: a) description of the risk, b) triggers/indicators, and c) description of appropriate risk response strategies--making reference to the PMI's response strategy types (Acceptance, Avoidance, Mitigation, Transference).
*The risk name should be descriptive with enough words that a reader can understand the basic nature of the risk without the need the look at a more detailed explanation. Make sure to avoid the trap of defining a risk as the result of the risk. Focus on the actual condition or event that impacts the project. For example, "delay in field data collection" is not a risk--this is the potential result of one or more risk events.
Important Notes:
Remember that this assignment relates to the project as a whole--not just specific deliverables as in Assignment #6. So step back and consider risk events, conditions, and circumstances that could impact any aspect of the project and understand that a single risk could impact work on one or more deliverables.
You may have discovered that the Project Management Institute (PMI) identifies both “negative” and “positive” risk. To simplify your work on this Assignment, deal only with negative risk—those potential risks that could have a negative impact on the project schedule, cost, quality, etc.
The team leader will have the main responsibility for assembling contributions from team members into a final deliverable and submit the assignment for the team.
The risk probability/impact matrix and the risk analysis write-ups on selected risks should be about 1500 to 2500 words in length. As is the case for all written assignments, the word count is a target to give you an idea about the level of detail expected. As a general rule, it is best to keep it concise and as brief as possible while still covering the necessary topics. No points will be deducted for submittals if they exceed the maximum word count by a small amount.
Refer to the grading rubric below for guidelines about the expected format and content of this Assignment.
As in all written assignments, you should include a cover page which includes the following information: a) course number and name, b) assignment number and name, c) your name, d) submittal date. The cover page should also have the full project name and document title ("Risk Management Plan"). Your submitted assignment should be formatted as specified in the Format Quality of this assignment’s rubric below to earn maximum points. As you prepare this assignment, START WITH AN OUTLINE, with sections and subsections that cover the topics above. We recommend that you use the Outline/Heading feature of your word processing software in document preparation. It is expected that you will organize the document into numbered and named sections. It is best practice today, for technical and management documents to use a "decimal" outline numbering scheme (1., 1.1, etc.) as opposed to the older Roman Numeral numbering approach.
Assignment Submittal and Grading
View specific directions for submitting Assignment #7. See Canvas Calendar for due date. Grading information and rubric is below.
This Assignment #7 is worth 70 points. The points awarded from the Instructor’s grading of this Assignment will be given to all members of the team.
The instructor may deduct points if the Assignment is turned in late, unless a late submittal has been approved by the Instructor prior to the Assignment submittal date.
| Grading Category | Basis for Scoring | Total Possible Points |
Point Award Explanation |
|---|---|---|---|
| A. Inclusion of Required Content |
|
22 |
|
| B. Overall Document Organization |
|
16 |
|
| C. Quality/Clarity of Writing | Writing quality and clarity refers to how well and effectively words and sentences to convey meaning to the reader including the following:
|
20 |
|
| D. Format Quality | Well-formatted document helps convey content and meaning to the reading. Important format parameters include:
|
12 |
|