Section Two: Symbolize Layers and Edit Features
Section Two: Symbolize Layers and Edit Features
Introduction
You probably noticed during your map-exploration that it was hard to distinguish some of the features because of how they were symbolized. In this section, you will symbolize your map, for example, to enhance readability.
2.1 Symbolize the UP_BUILDINGS layer
2.1 Symbolize the UP_BUILDINGS layer
First, you'll give the buildings layer a more appropriate color.
- If necessary, open the UniversityParkCampus project in ArcGIS Pro.
- On the contents pane, uncheck all layers but UP_BUILDINGS. Click the colored rectangle symbol under the UP_BUILDINGS layer.
The Symbology pane opens to the Gallery.
 Credit: 2021, ArcGIS [1]
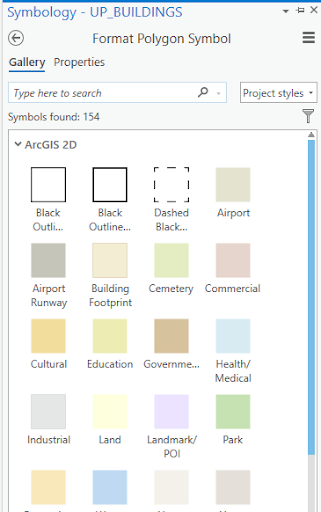 Enter caption hereCredit 2021, ArcGIS
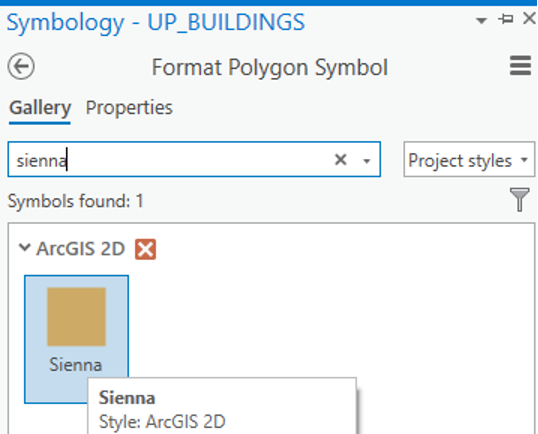
 - In the search box, type sienna and press Enter.
 Credit: 2021, ArcGIS [1]
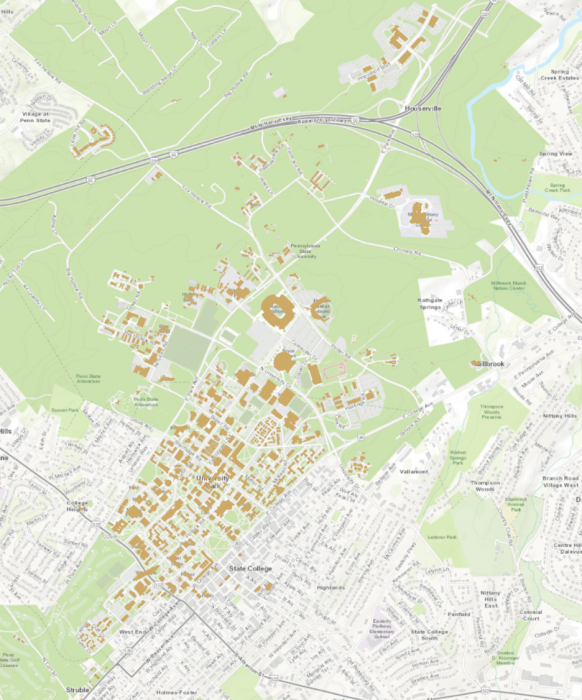
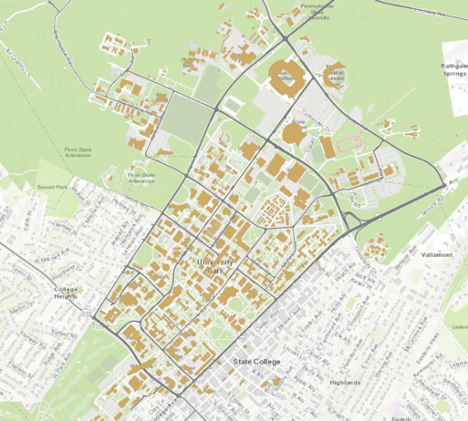
 - The result is that the symbology for buildings will change to orange-brown. Feel free to explore further color options.
 Credit: ChoroPhronesis Lab [2]
2.2 Symbolize the UP_Major_Roads and UP_Minor_Roads layers
2.2 Symbolize the UP_Major_Roads and UP_Minor_Roads layers
Next, you will change the major roads symbol.
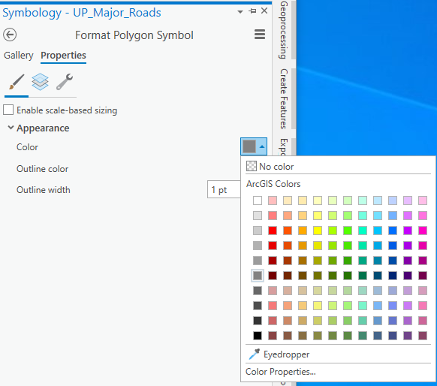
- On the Contents pane, turn on the UP_Major_Roads layer. Click the colored rectangle symbol under the UP_Major_Roads.
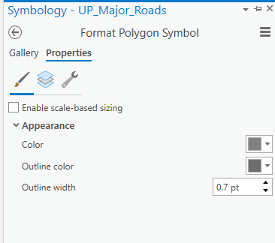
- On the Symbology pane, click Properties.
 Credit: 2021, ArcGIS [1]
 - Under Appearance, click the drop-down arrow next to Color and choose Gray 50%. For the outline color, choose no color.
Hover over a color to see its name.
 Credit: 2021, ArcGIS [1]
 - At the bottom of the Symbology pane, click Apply.
 Credit: ChoroPhronesis Lab [2]
Repeat the previous steps for UP_Minor_Roads. Change Minor roads’ symbol to ‘Gray 40%’ with no outline color.
2.3 Symbolize the UP_Sidewalks
2.3 Symbolize the UP_Sidewalks
Next, you will change the UP_Sidewalks.
- On the Contents pane, turn on the UP_Sidewalks. Click the colored rectangle symbol under the UP_Sidewalks.
- On the Symbology pane, click Properties.
 Credit 2021, ArcGIS
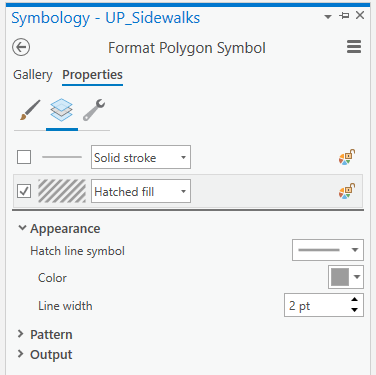
 - Under Appearance, click the drop-down arrow next to Color and choose Gray 40%. For the outline color, choose no color.
- Then click on the Layers tab. Un-check the first option, which is for outline style. Click on the second option and choose hatched fill.
For the hatch line symbol, choose simple stroke (2.0 pt). Hover over to see its name.
Choose 2.5 pt for the line width.
- At the bottom of the Symbology pane, click Apply.
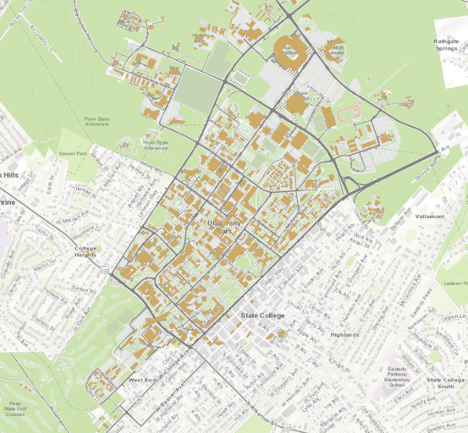 Credit: ChoroPhronesis Lab [2]
2.4 Symbolize UP_TREES
2.4 Symbolize UP_TREES
Trees in Up_Trees are point features. Here we will show you how to symbolize point features based on attributes. Before symbolizing this layer, explore the attribute table for this layer.
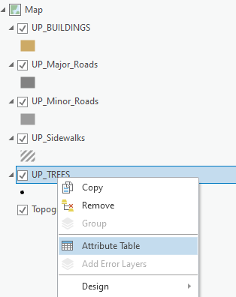
- On the Contents pane, turn on UP_TREES. Right-click the UP_TREES layer and click on the Attribute Table.
 Credit: 2021, ArcGIS [1]
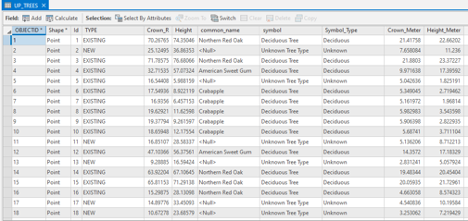
 - Examine the fields in the attribute table.
This tree layer is extracted from LiDAR Imagery collected in 2015. Some of the trees species are existing trees from a 2005 survey. Some have been added to the database as new trees and some are best guesses based on the LiDAR data. Therefore, tree type, listed as ‘symbol’ is only available for some but not all trees. A new tree database is under development for a complete tree database. You can see different tree symbols, such as deciduous and evergreen. You will symbolize the tree layer based on the symbol field.
 Credit: 2021, ArcGIS [1]
 - Close the attribute table.
- Click the point under UP_TREES. The Symbology pane will appear on the left side.
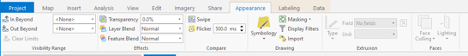
- At the top of the page, a ribbon is located. Click on the appearance tab.
 Credit: 2021, ArcGIS [1]
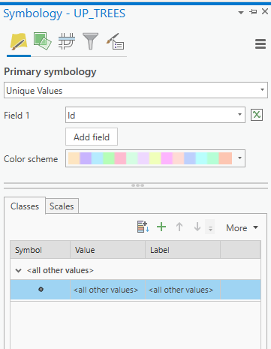
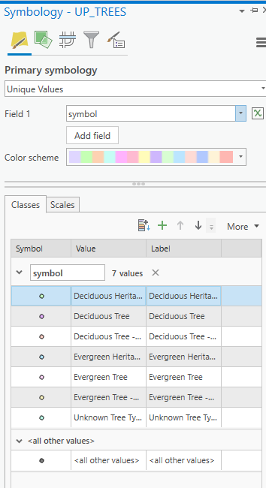
 - Click the drop-down arrow under Symbology and select ‘Unique Values’ under ‘Symbolize your layer via categories’. Now you can see that the symbology pane on the left side has changed to unique values.
 Credit: 2021, ArcGIS [1]
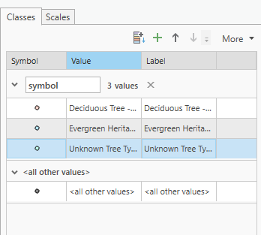
 - Change the value field from Id to symbol. Now you can see different values under symbol attribute.
There are three types of deciduous and three types of evergreen and one ‘Unknown Tree Type’ value. Null values belongs to new trees which do not have tree symbol assigned to them. We would like to group all deciduous trees together and all evergreen trees together.
 Credit: 2021, ArcGIS [1]
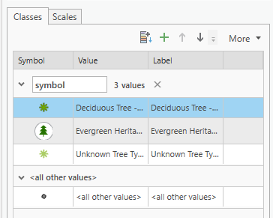
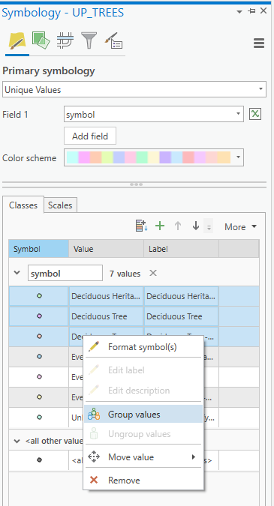
 - Select all three categories for deciduous trees and group them. Do the same for evergreens.
 Credit: 2021, ArcGIS [1]
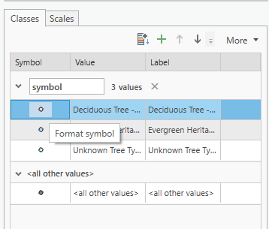
 - Click on the label values (last column) and change the values to Deciduous, Evergreen, and Unknown, respectively.
- Now select Format symbol for deciduous category.
 Credit: 2021, ArcGIS [1]
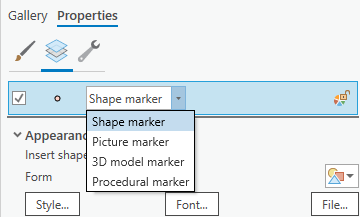
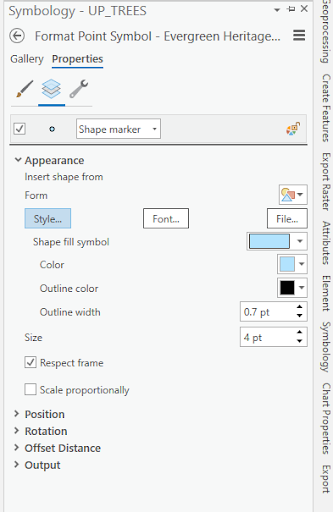
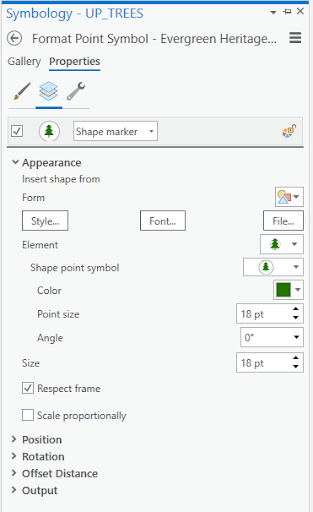
 - For the evergreen symbol, under Layers, choose shape maker from the menu. This time instead of Font, click on Style tab.
 Credit: 2021, ArcGIS [1]
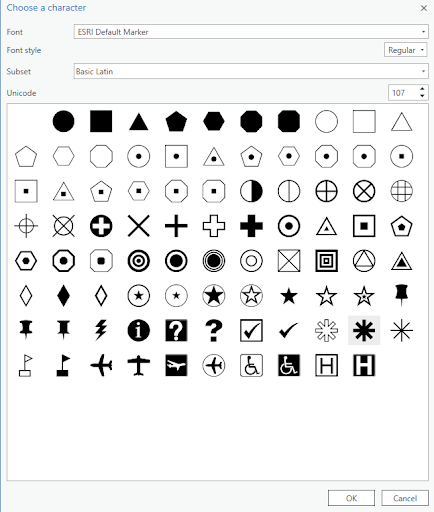 Credit: 2021, ArcGIS [1]For color, choose Tarragon green, and for the outline color black. The outline width should be 0.2 opt and the symbol size, 13 pt.
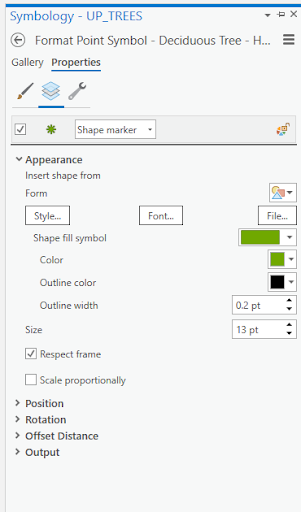 Credit: 2021, ArcGIS [1]
 -
For the evergreen symbol, under Layers, choose shape maker from the menu. This time instead of Font, click on the Style tab.
 Credit: 2021, ArcGIS [1]
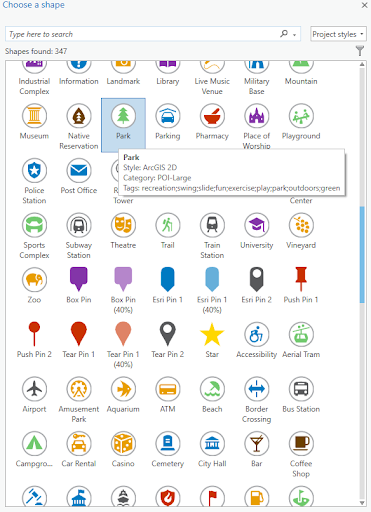 Credit: 2021, ArcGIS [1]
Based on the screenshot, choose Fir Green for the color, and 18 pt for the symbol size.
 Credit: 2021, ArcGIS [1]
 -
For the unknown symbol, under Layers, choose shape maker from the menu.
Then click Font and choose shape 107 and click ok.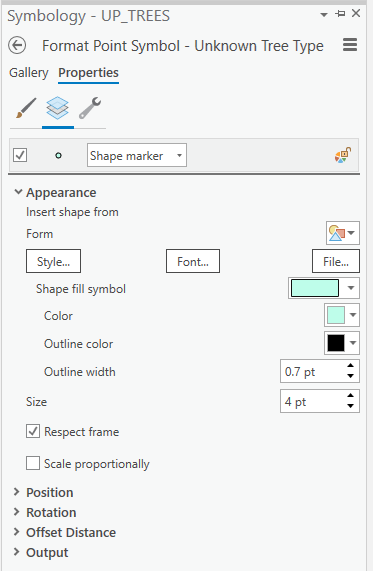 Credit: 2021, ArcGIS [1]Based on the screenshot, choose Medium Olivenite for the color, no color for the outline color and 0.01 pt for the outline width, and finally 13 pt for the symbol size.
 Credit: 2021, ArcGIS [1]Click apply on the bottom of the pane.
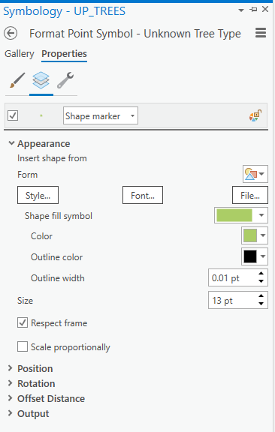 Credit: 2021, ArcGIS [1]
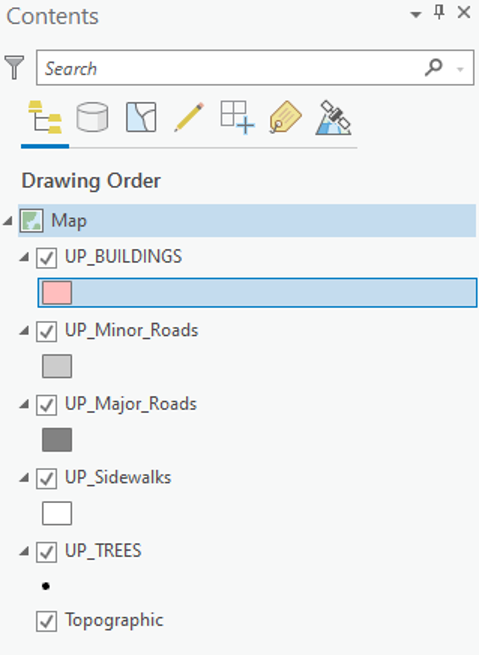
To make the trees more visible, you can drag the layer on top of the layers in Content pane. The final result would be like the following image: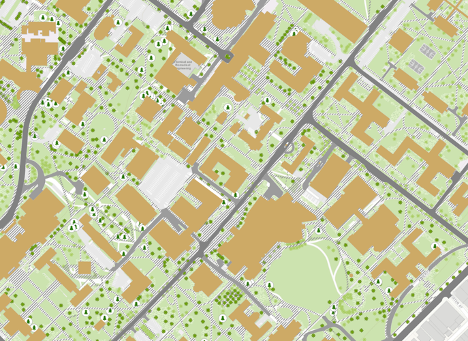 Credit: ChoroPhronesis Lab [2]
 - Make a Screenshot of UP Campus with all symbolized layers for your graded assignment. This is labeled Task 1 on the Tasks and Deliverables.