Lesson 2: 3D Modeling and VR Workflows
Overview
Overview
As discussed in Lesson 1, 3D modeling and the availability of 3D data are going mainstream. Technology, while it has always developed as part of society for thousands of years, has now reached a level of maturity that allows non-experts to make substantial contributions in several fields. 3D modeling and VR are at a point where cartography was 20 years ago when map-making was placed into the hands of the masses (for better or worse). The workflows that we are discussing in this lesson are examples of how affordable and accessible 3D modeling has become but also provide insights into higher-end solutions. As with all aspects of this course, we will only scratch the surface of a number of possibilities and what was true at the beginning of the course may even be replaced by newer technologies, better algorithms, and lower-cost solutions at the end. We are living in exciting times.
Learning Outcomes
By the end of this lesson, you should be able to:
- Compare input modalities such as sensed data versus modeling
- Discuss options for using remotely sensed data such as LiDAR
- Compare modeling platforms such as CityEngine, AutoCAD, SketchUp
- Discuss options on how to interact with 3D models
- Define the concept of a game engine such as Unity3D
- Discuss hardware available for interacting with 3D models in VR
Lesson Roadmap
| To Read |
|
|---|---|
| To Do |
|
Questions?
If you have any questions, please post them to our "General and Technical Questions" discussion (not e-mail). I will check that discussion forum daily to respond. While you are there, feel free to post your own responses if you, too, are able to help out a classmate.
2.1 Prerequisite: The Level of Detail
2.1 Prerequisite: The Level of Detail
The Figure below shows different models of Penn State campus and Penn State buildings, respectively. It can easily be imagined that the level of detail of the model on the top may suffice for certain planning or analysis purposes, but that a detailed model (bottom) is required for applications such as architectural planning and engineering. The level of detail is not easy to define for 3D models and there is not a single standard for the "right" level of detail of 3D models. There are related discussions in cartography such as what is a schematic map (or are all maps schematic?). The level of detail is important though as it has implications on aspects such as performance, for example, in virtual reality environments. While there is not a direct correspondence between level of detail and polygon count (the number of individual surfaces that need to be processed), it can be easily imagined that complex models require a lot of computing power to interact with while, simple models allow for keeping up sufficient frame rates, for example, in immersive VR experiences (see Lesson 8 and 9). Interestingly, in many planning scenarios, people may decide to have more than one version of a model, one with a low and one with a higher level of detail in order to use them flexibly in different applications. Unlike map generalizations, there are only a few approaches that allow for 3D model generalization.
Below are examples of different levels of detail of 3D models.
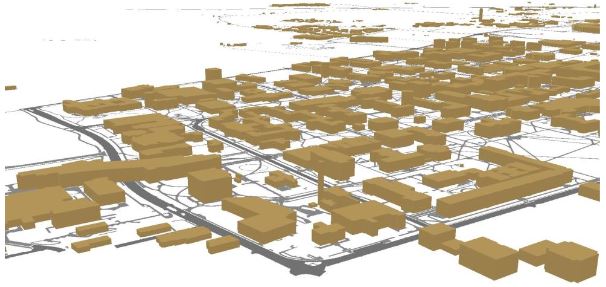
It is advisable to think about the level of detail that one requires before starting the modeling process. It is still the case that the more detail you need, the higher the cost will be in terms of time, software product, and computing resources.
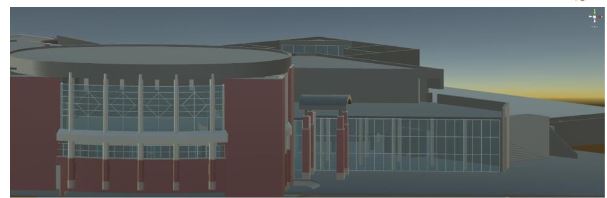
A good starting point for thinking of the levels of detail of 3D models is an approach referred to as CityGML [4] that envisioned to standardize 3D models. While the active development of CityGML has slowed down, its classification of levels of detail provides a good basis for discussion. CityGML identifies five levels of detail based on accuracy and minimal dimensions of objects that can roughly be characterized as follows (see also Figure 2.1.2, and Kolbe et al. 2005):
- LoD0: essentially a digital terrain model with potentially 2.5D information.
- LoD1: the positional and height accuracy of points may be 5m or less, while all objects with a footprint of at least 6m by 6m have to be considered.
- LoD2: this level requires positional accuracy of 2m, while the height accuracy is 1m. In this LoD, all objects with a footprint of at least 4m by 4m have to be considered.
- LoD3: Both height and positional accuracy are 0.5m, and the minimal footprint is 2m by 2m.
- LoD4: Both height and positional accuracy are 0.2m.
As this brief discussion illustrates, the level of detail has substantial consequences on the visual appearance of 3D models, as well as on cost and efficiency. Cost is associated with time but also actual software products (e.g., high-end CAD programs for a higher level of detail; procedural rule software for a lower or medium level of detail). Efficiency is related to the computing power necessary to turn a 3D model into a smooth interactive experience.
2.2 Workflows for 3D Model Construction
2.2 Workflows for 3D Model Construction
Overview
Creating 3D models of buildings, artifacts, and cities enable potentially better decision making, education, and planning in many fields such as archeology, architecture, urban sciences, and geography. Creating virtual cities, for example, allows for presenting scenarios of future development plans with more realism to assess their feasibility and plan their implementation. There are informational values in creating virtual cities including better communication with non-technical audiences that is, the community. Additionally, there are new approaches in 3D analysis, for instance, dealing with views, shadows, the reflected heat of building blocks, and the calculation of hours of sunshine.
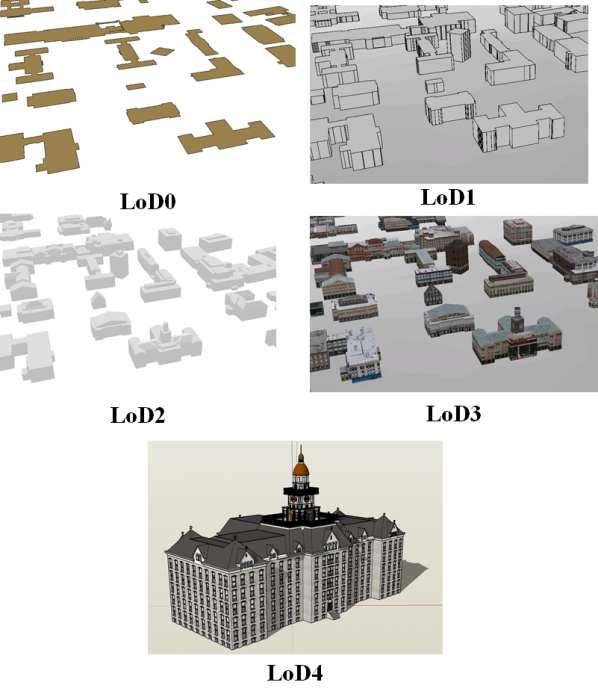
3D modeling is the process of digitally representing the 3D surface of an object. However, the model is usually rendered to be displayed as a 2D image on a computer screen. Experiencing the model in 3D can be achieved using 3D printing devices or presenting it in a virtual reality (VR) environment. There are different methods of 3D model construction and methods of accessing them. Figure 2.2.1 provides an overview of a couple of options for both creating and accessing 3D models that we will discuss in more detail later in this lesson. Many of the tools that are shown in the figure will be introduced throughout the course while others are challenging to work within an online environment.
The Figure above just name a couple of examples for efficiently collecting and accessing 3D data and information. A booming market for 3D technologies such as photogrammetry, 360-degree cameras, scanning tablets, but also the efficient use of existing data such as Open Street Map, have made content creation for 3D environments accessible to a wide audience. At the same time, VR technology is going mainstream with international companies such as Facebook™ or HTC™ weeding out roadblocks such as cyber/motion sickness.
2.3 Manual Static 3D Modeling
2.3 Manual Static 3D Modeling
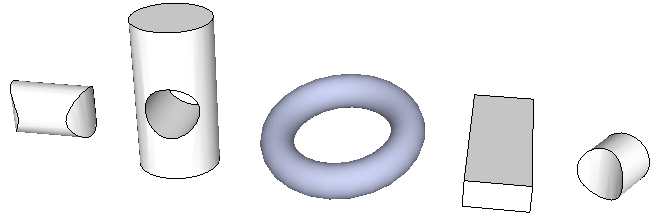
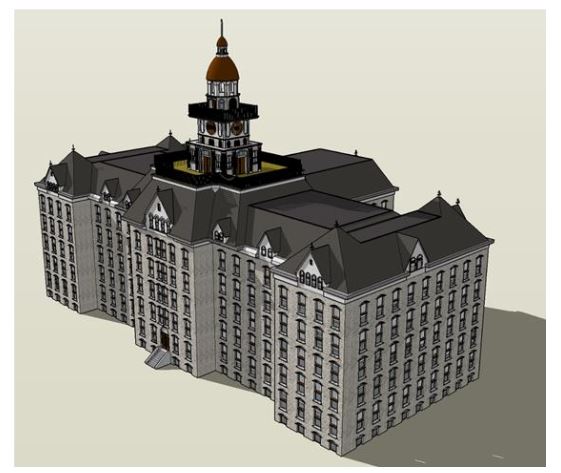
To give you an idea of modeling, let us first consider modeling by hand. In this case, a model of an object, whether existent or not in the past, present, or future is constructed by a human using software modeling tools manually. Creating 3D models manually can be done using software such as SketchUp (see Lesson 3), Maya, 3Ds Max, Blender and Cinema 4D, or any one of a number of software that exists for 3D modeling. There are two main techniques in manually creating 3D models: solid modeling and shell modeling. Solid modeling often uses CSG (constructive solid geometry) techniques. CAD packages such as Rhino, SolidWorks, and SketchUp are considered solid modeling platforms. Complex 3D models can be created with the use of solid geometries. The Figure below shows a couple of solid geometries that are used to create potentially very complex models. An example of a complete 3D model is shown below: a model of the historic Old Main created as part of Geography 497 in Spring 2016.
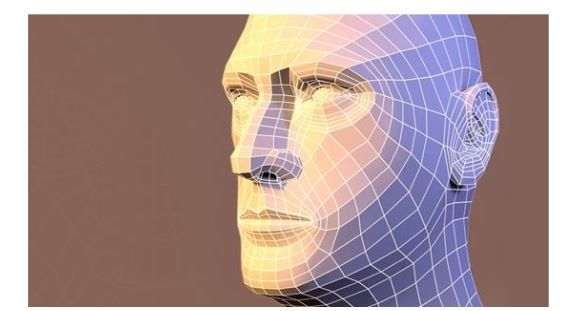
Shell modeling only represents the surface of an object. These types of models are easier to visualize and work with. An example of shell modeling is the use of polygon meshes consisting of a collection of triangles or any other type of convex polygon (from other geography lessons on interpolation you might be familiar with triangulation). Polygon meshes only represent the exterior of a model. To make the model smoother and more realistic, a method called tessellation can be used to break down the polygon meshes to higher resolution poly meshes. Programs such as Maya, 3D Studio Max, and Blender all utilize different methods of working with polygonal meshes.
While there is a distinct difference between CSG and shell modeling, many of the programs mentioned and even those that were not, provide support for both types in a limited capacity. Understanding what type of modeling best fits your project needs helps with choosing the best software for 3D modeling tasks.
2.4 Data-Driven Modeling
2.4 Data-Driven Modeling
Introduction
Shell modeling can be achieved based on photographs/ aerial imagery or scanning model geometry from the real world using, for example, laser scanners. In this section, we will learn about A) Reality modeling and B) Scanning: Remotely Sensed Data such as LiDAR Point Clouds.
A. Reality Modeling
A. Reality Modeling
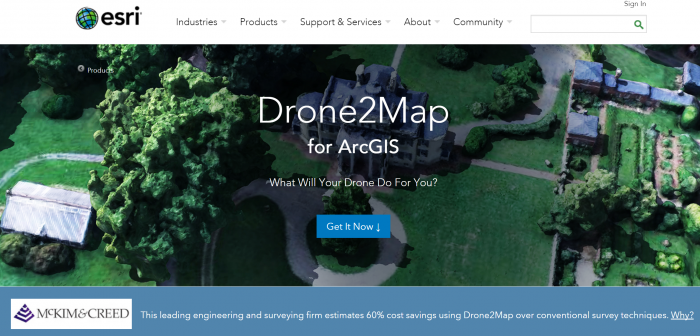
Reality models provide real-world context using aerial imagery and/or photographs. Technologies like 3D imaging and photogrammetry with the use of UAVs (unmanned aerial vehicle) provide these images to be used in software for converting a 2D map to a 3D model. Examples of software for this approach are ContextCapture by Bentley and VUE, PlantFactory, Ozon, Drone2Map by ESRI, or CarbonScatter by E-on.
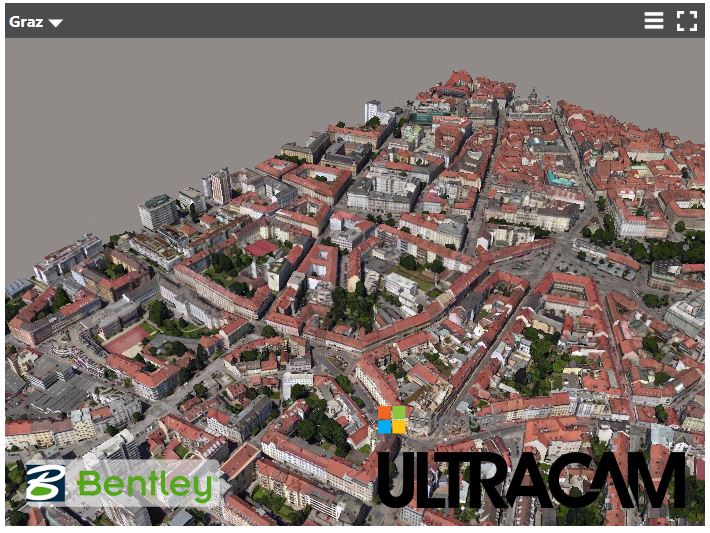

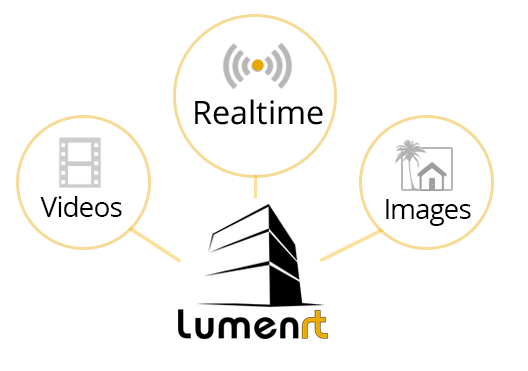
LumenRT, for example, is an E-on software licensed by Bentley. It can create real-time immersive experiences. It presents a combination of tools that create ultra-high-definition videos and photographic images for 3D projects.
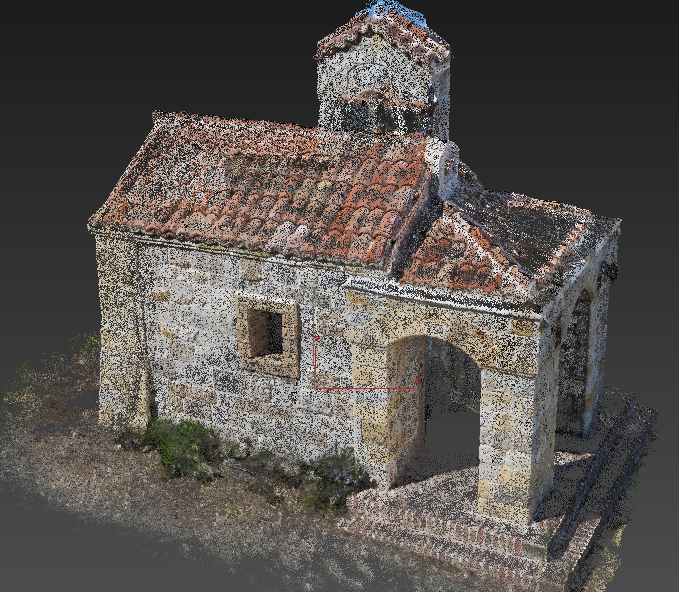
One of the methods for creating 3D structures from 2D images is structure from motion (SFM) photogrammetry. There are several software packages for creating and reconstructing three-dimensional structures: Agisoft, VisualSFM, CMPMVS, Meshlab, and Blender. For instance, Aibotix GmbH has created a 3D model of Castle Spangenberg in Germany using a combined mapping workflow. Data was collected with multirotor UAV Aibot X6 and ground surveying equipment. The collected data was then processed with the help of Agisoft PhotoScan.
Video: Drone surveying of Castle Spangenberg with the UAV Aibot X6 (2:07) This is video is not narrated, music only.
B. Scanning: Remotely Sensed Data Such as LiDAR Point Clouds
B. Scanning: Remotely Sensed Data Such as LiDAR Point Clouds
Data-driven modeling can also be achieved through point clouds to render exterior surfaces. A point cloud can be obtained by laser scanning. LiDAR as a system of collecting point clouds is explicitly explained in this section. The fact that point clouds do not contain any type of geometry is an important characteristic in modeling because they do not change the appearance or respond to scene lighting by default. They enable the designer to incorporate realistic 3D objects without having to model them. The drawback is that the objects are not editable with traditional techniques (Autodesk) [12]. Software that processes and supports point clouds as input data are Potree, Rhino, the Autodesk products, Blender, Pointools, Mathworks, and Meshlab.
LiDAR is an active remotely sensed method of collecting information. It uses active sensors that have their own source of light or illumination. There are two types of LiDAR systems: airborne and terrestrial scanning systems. Airborne Laser scanning known as LiDAR (Light Detection and Ranging) is a remote sensing technique that measures variable distances to the earth using a pulsed laser. Aircraft, helicopters, or UAVs (unmanned aerial vehicle) such as drones are common platforms for collecting LiDAR data. The LiDAR systems collect x, y, and z data at predefined intervals.
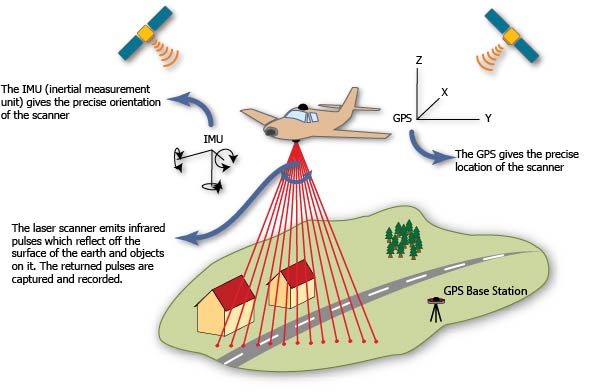
Based on LiDAR data, high-quality elevation models can be created. For instance, the airborne LiDAR data collected for the Penn State campus contains points at 25 cm intervals. LiDAR returns two types of elevation models: (1) a first return surface including anything above the ground such as buildings and canopy, it is referred to as DSM (digital surface model) and, (2) The ground or bare earth which is referred to as DEM (digital elevation model), it contains topography.
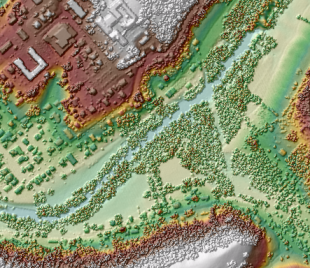
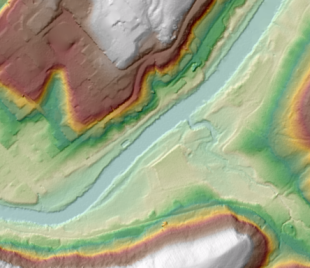
The workflows of DEM and DSM creation are outside of the scope of this course. Using these elevation models, buildings, trees, and roads can be extracted from the LiDAR data with elevation information. High-resolution LiDAR data can provide more precise information regarding height. Most GIS systems such as LiDAR analyst, LAStools, and Lp360 made the data extraction automatic or semi-automatic. For instance, the extracted information of buildings contains roof sections, shape size and estimated height of buildings. To detect more accurate height information, facade geometry, and textures, extra systems such as terrestrial laser scanning and photogrammetry should be incorporated into the model. Terrestrial or ground-based laser scanning (Terrestrial LiDAR) is used for high accuracy feature reconstruction. With a combination of airborne and terrestrial LiDAR more realistic 3D models can be created.
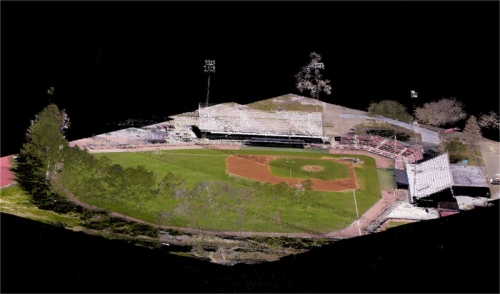
The following image shows how a LiDAR point cloud using an airborne LiDAR system can be colorized with RGB values from a digital aerial photo to produce a realistic 3D oblique view. There are numerous papers on developing algorithms that can automate the process of 3D modeling using LiDAR data and aerial photography.
2.5 Procedural Modeling
2.5 Procedural Modeling
For realistic scenes, more complex models are needed. Creating these types of models can be tedious. One solution is to construct 3D models or textures algorithmically. Procedural modeling has been used in some techniques in computer graphics to create 3D models based on sets of rules. Procedural computing is the process of creating data algorithmically instead of manually. In computer graphics, it is used for creating textures. Mostly, procedural rules are used for creating complex models such as plants, buildings, cities or landscapes which require more specialized tools and are time-consuming for a person to build. With procedural rules, developing complicated models is simplified through repeating processes, automatic generation, and if necessary randomization.
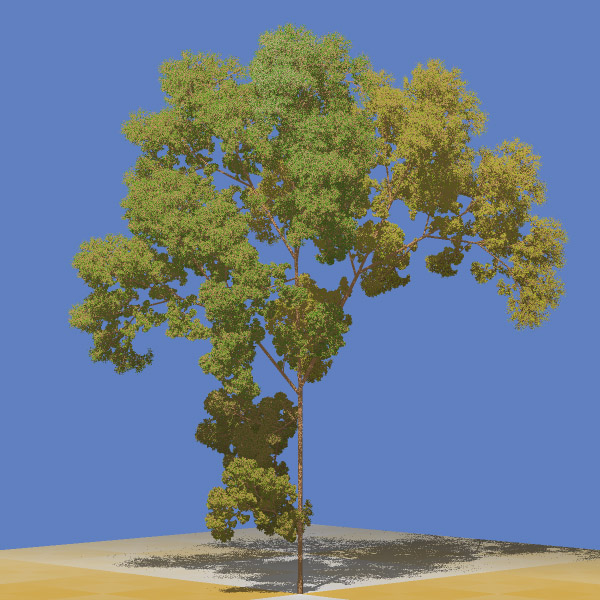
One of the methods in procedural modeling is the use of fractals (fractal geometry) to create self-similar objects. Fractals are complex geometries with never-ending patterns. In other words, they can have infinite patterns at different resolutions. This type of approach is useful in creating natural models such as plants, clouds, coastlines, and landscapes. For instance, a tree can be automatically created based on branching properties and type of leaves. Then a forest can be generated automatically by tree randomization.
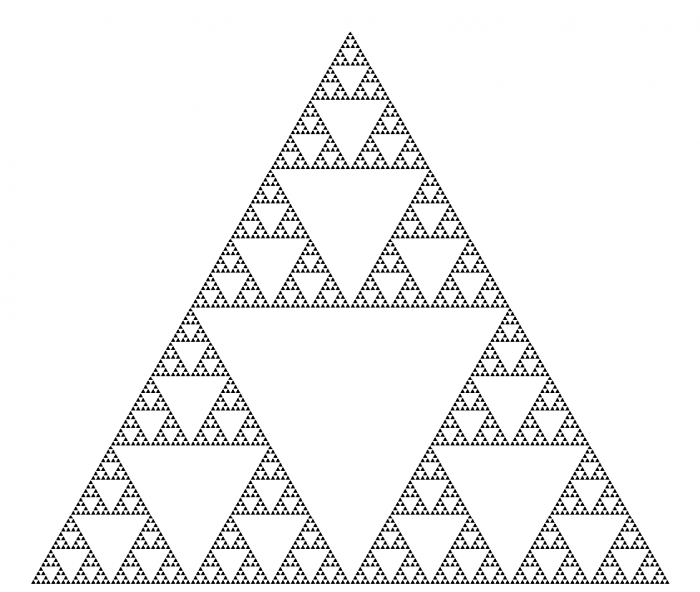
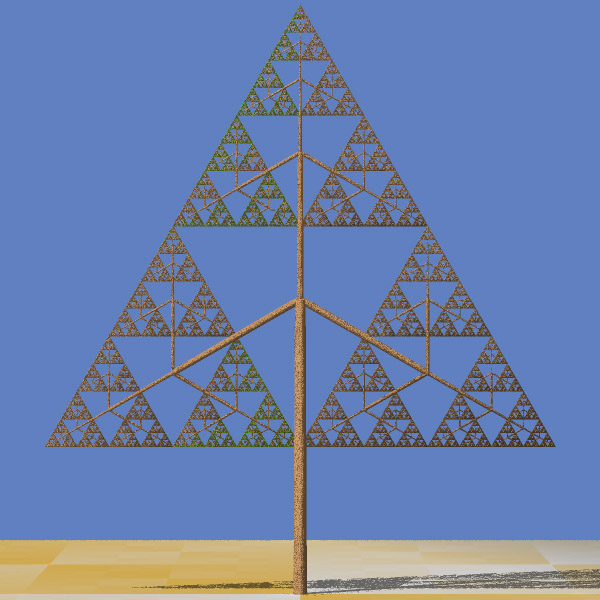
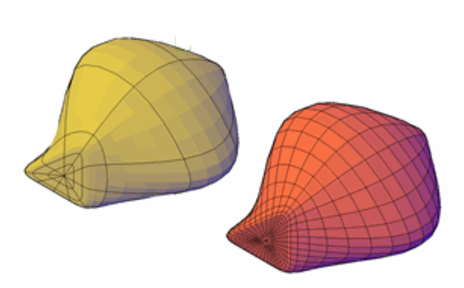
Another method in procedural modeling is generating models based on grammars. Grammar-based modeling defines rules that repeatedly can produce more details and create finer models as in the image below. Tree shape data structure or model hierarchy plays an important role in grammar-based modeling both in terms of programming efficiency and adding more details to a shape.

Instances of procedural modeling platforms are ESRI CityEngine, Vue, and Fugu. Xfrog is a component that can be added to a different platform such as Maya and CAD to build plants, organic shapes or abstract objects.
Procedural modeling will be the topic of Lesson 4.
2.6 3D and VR Application Building Workflows
2.6 3D and VR Application Building Workflows
Typically, 3D models are created with a concrete final application or product in mind. This could be presentational material for a web site, a standalone 3D application like a virtual city tour or computer game, a VR application intended to be run on one of the different consumer VR platforms available today, or some spatial analysis to be performed with the created model to support future decision making, to name just a few examples. In many of these application scenarios, a user is supposed to interact with the created 3D model. Interaction options range from passively observing the model, for example, as an image, animation, or movie, over being able to navigate within the model, to being able to actively measure and manipulate parts of the model. Usually, the workflows to create the final product require many steps and involve several different software tools, including 3D modeling software, 3D application building software like game engines, 3D spatial analysis tools, 3D presentation tools and platforms, and different target platforms and devices.
The figure below illustrates how 3D application building workflows could look like on a general level: The workflow potentially starts with some measured or otherwise obtained input data that is imported into one or more 3D modeling tools, keeping in mind such input could also simply be sketches or single photos. Using 3D modeling tools, 3D models are created manually or using automatic computational methods, or a combination of both. The created models can then either be used as input for some spatial analysis tools, directly used with some presentational tools, for example, to embed an animated version of the model on a web page, or the models are exported/imported into a 3D application building software, which typically are game engines such as Unity3D or the Unreal engine, to build a 3D application around the models. The result from the 3D application building work can again be a static output like a movie to be used as presentation material, or an interactive 3D or VR application built for one of many available target platforms or devices, for example, a Windows/macOS/Linux stand-alone 3D application, an application for a mobile device (for instance, Android or iOS-based), or a VR application for one of the many available VR devices. The figure below is an idealization in that the workflows in reality typically are not as linear as indicated by the arrows. Often it is required to go back one or more steps, for instance from the 3D application building phase to the 3D modeling phase, to modify the previous outputs based on experiences made or problems encountered in later phases. It is also possible that the project is conducted by working on several stages in parallel, such as creating multiple levels of detail (LoD) 3D models to work with the intended platform. Moreover, while we list example software for the different areas in the figure, these lists are definitely not exhaustive and, in addition, existing 3D software often covers several of these areas. For instance, 3D modeling software often allows for creating animation such as camera flights through a scene, or in the case of Esri's CityEngine/ArcGIS Pro allow for running different analyses within the constructed model.
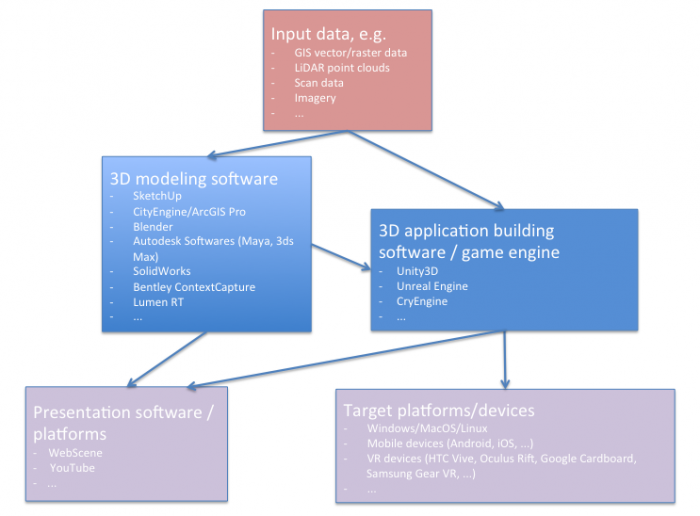
A schematic diagram outlines the following information (in summary):
- Input data (in a variety of formats) imported into either a 3D modeling software or a 3D application building software such as a game engine.
- In 3D modeling software, 3D models are created either manually or automatically based on computational methods The resulting models could be either directly used for visualization (i.e. on the web) or imported into 3D application building software such as Unity3D for more elaborate functionalities.
- The application made from game engines (e.g. Unity 3D) can be deployed on both web and a variety of platforms including VR headsets.
- Depending on the application and the deployment platform attributes of models such as levels of detail (LoD) can be manipulated
A 3D modeling project can also aim at several or even many target formats and platforms simultaneously. For instance, for the PSU campus modeling project, that we are using as an example in this course, the goal could be to produce (a) images and animated models of individual buildings for a web presentation, (b) a 360° movie of a camera flight over the campus that can be shared via YouTube and also be watched in 3D with the Google Cardboard, (c) a standalone Windows application showing the same camera flight as in the 360° video, (d) a similar standalone application for Android-based smartphone but one where the user can look around by tilting and panning the phone, and (e) VR applications for the Oculus Rift and HTC Vive where the user can observe and walk around in the model.
The next figure illustrates the concrete workflow for this project (again in an idealized linear order) with the actual software tools used and providing more details on the interfaces between the different stages. The main input data for the campus model is extracted from Airborne LiDAR point clouds. Based on this data, building footprints, buildings, and trees height, Digital Elevation Model (DEM) are extracted. Roads (streets and walkways) are 2D shapefiles received from the Office of Physical Plant at PSU. Roof shapes and tree types information are collected based on surveys. DEM which is in raster format and other data that are in vector format (polygons, lines, and points) are imported to CityEngine which is a generation engine for creating procedural models. Procedural modeling using CityEngine will be explained in more detail in Lesson 4. The result of the procedural model can be shared on the web as an ArcGIS Web Scene for visualization and presentation. It can also be exported to 3D/VR application building software.
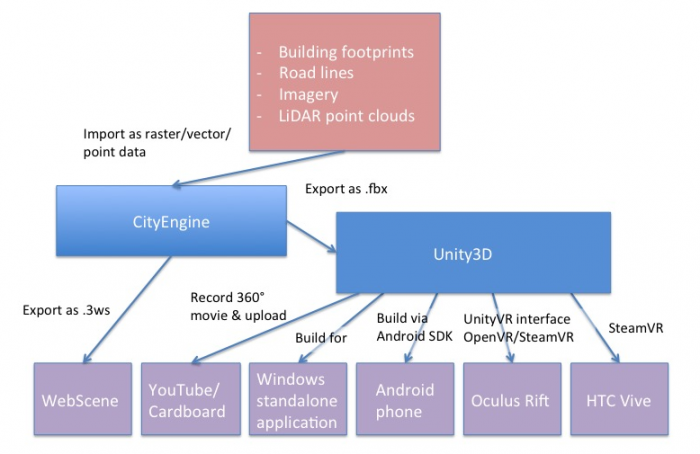
A schematic diagram outlines the following information (in summary):
- Extraction of mode data from LiDAR point cloud.
- Digital Elevation Model (DEM) are imported into CityEngine for generation of procedural models.
- Result can be shared on the web as an ArcGIS Web Scene, or exported to 3D/VR application building software such as Unity3D.
The 3D/VR application building software we are going to use in this course will be the Unity3D game engine (Lessons 8 and 9). A game engine is a software system for creating video games, often both 2D and 3D games. However, the maturity and flexibility of this software allows for implementing a wide range of 3D and now VR applications. The entertainment industry has always been one of the driving forces of 3D and VR technology, so it is probably not surprising that some of the most advanced software tools to build 3D applications come from this area. A game engine typically comprises an engine to render 3D scenes in high-quality, an engine for showing animations, a physics and collision detection engine as well as additional systems for sound, networking, etc. Hence, it saves the game/VR developer from having to implement these sophisticated algorithmic software modules him- or herself. In addition, game engines usually have a visual editor that allows for producing games (or other 3D application) even by non-programmers via mouse interaction rather than coding, as well as a scripting interface in which all required game code can be written and integrated with the rest of the game engine or in which tedious scene building tasks can be automated.
Unity can import 3D models in many formats. A model created with CityEngine can, for instance, be exported and then imported into Unity using the Autodesk FBX [19]format. SketchUp models can, for instance, be imported as COLLADA .dae [20] files. In the context of our PSU campus project, Unity3D then allows us to do things like creating a pre-programmed camera flight over the scene, placing a user-controlled avatar in the scene, and implementing dynamics (e.g., think of day/night and weather changes, computer-controlled moving object like humans or cars) and user interactions (e.g., teleporting to different locations, scene changes like when entering a building, retrieving additional information like building information or route directions, and so on).
The different extensions and plugins available for Unity allow for recording images and movies of an (animated) scene as well aw to build final 3D applications for all common operating systems and many VR devices. For instance, you will learn how to record 360° images for each frame of a camera flight over the campus in Unity. These images can be stitched together to form a 360° movie that can be uploaded to YouTube and from there be watched in 3D on a smartphone by using the Google Cardboard VR device (or on any other VR device able to work with 360° movies directly). You will also learn how to build a standalone application from a 3D project that can be run on Windows outside of the Unity editor. Another way to deploy the campus project is by building a standalone app for an Android-based phone. Unity has the built-in functionality to produce Android apps and push them to a connected phone via the Android SDK (e.g., coming with Android Studio [21]). Finally, Unity can interface with VR devices such as the Oculus Rift and HTC Vive to directly have the scene rendered to the head-mounted displays of these devices, interact with the respective controllers, etc. There exist several Unity extensions for such VR devices and the VR support is continuously improved and streamlined with each new release of Unity. SteamVR [22] and the OVR [23], and VRTK [24]for Unity currently take a central role for building Unity applications for the Rift and the Vive.
2.7 Photogrammetry
2.7 Photogrammetry
We have briefly mentioned photogrammetry and several of you have found related examples in the previous week. Amazing things are happening in the area of photogrammetry! Photogrammetry, for those who are not familiar with it, can be loosely defined as the art and science of measuring in photos. For the case of 3D modeling this has vast applications:
- Imagine that a house you would like to model no longer exists in the real world but you still have access to images through, for example, a library. Penn State and its main campus have undergone drastic changes in the last 170 years. Naturally, not all buildings that were on campus are still there. Penn State’s library has taken on the task to preserve some of the knowledge we have about previous states of the campus and has created digital archives for images but also maps. Here is an example: Maps: State College Change Through Time [25].
- Imagine that you are an archeologist and that you are interested in preserving the heritage of an ancient site. There are high-level approaches through companies like Bentley, who recently modeled the Penn State Campus but they are really expensive and may or may not be necessary for your purposes. A substantially less expensive approach that nonetheless provides you with a 3D model of a site can be accomplished with so-called structure from motion mapping. Below is an example from a project of the University of Ghent in Belgium and Penn State's Obelisk that a ChoroPhronesis member (Jiayan Zhao) created.
Example: The Mayan site of Edzna in Campeche (Mexico)
Example: Penn State's Obelisk
Photogrammetry has traditionally been within the field of geodesy and remote sensing, but its applications are becoming ubiquitous. Originally, it was used to measure distances, define the extent of areas, and essentially identify and geo-locate terrain features with the purpose to complement databases and/or to create maps.
Required Reading Assignment
To give you an example of a recent approach that uses Google Earth images for 3D modeling, we would like you to read the following article.
Rapid 3D Modeling Using Photogrammetry Applied to Google Earth [1] by Jorge Chen and Keith C. Clarke.
As you read, please keep in mind the following questions:
- Which locations did the authors use for their study?
- For what reason did the authors use LiDAR?
- What do you think of the outcome?
- Can you think of ways to improve the resulting 3D model?
Tasks and Deliverables
Tasks and Deliverables
Assignment
This assignment has two tasks.
Task 1: Find an article
Please find an article that describes a 3D/VR workflow. Make sure that the article has been peer-reviewed. Determine whether the entire article was peer-reviewed (most journals are) or just the abstract was peer-reviewed (as some conference proceedings may be). Either download the article, if that is an option or save the URL to the article for use in the second half of your assignment.
Task 2: Write a review on the article
Once you have decided upon an article, write a 4-6 sentence paragraph detailing why you selected this particular article and what you like about it. Make sure that you explain how the article adds value to GIS and/or other sciences. Some reasons you might select an article are because it discusses advances in GIS and/or other disciplines you think are important, it describes its topic clearly, it is informative and would allow you to implement a workflow yourself, or it gets high marks because it is just cool. In your document, provide a full reference for the article (using APA style) and a link to the article or provide an electronic copy of the document. Below are two examples of complete references.
- Li, R., & Klippel, A. (2016). Wayfinding behaviors in complex buildings: The impact of environmental legibility and familiarity. Environment and Behavior, 43(3), 482–510. doi:10.1177/0013916514550243
- Sparks, K., Klippel, A., Wallgrün, J. O., & Mark, D. M. (2015). Citizen science land cover classification based on ground and aerial imagery. In S. I. Fabrikant, M. Raubal, M. Bertolotto, C. Davies, S. M. Freundschuh, & S. Bell (Eds.), Proceedings, Conference on Spatial Information Theory (COSIT 2015), Santa Fe, NM, USA, Oct. 12-16, 2015 (pp. 289–305). Berlin: Springer.
Due Date
This assignment is due on Tuesday at 11:59 p.m.
Submitting Your Deliverable
Please submit your completed deliverable to the Lesson 2 (Article and Review) Assignment.
Grading Rubric
| Criteria | Full Credit | Half Credit | No Credit | Possible Points |
|---|---|---|---|---|
| Article selected is peer-reviewed, the type of peer review is indicated, the link to the article (or file) is provided, and full reference is present. | 5 pts | 2.5 pts | 0 pts | 5 pts |
| Write up clearly communicates how the article adds value to GIS or other scientific fields. | 4 pts | 2 pts | 0 pts | 4 pts |
| Write up is well thought out, researched, organized, contains some technical specifications and clearly communicates why student selected and likes the article. | 5 pts | 2.5 pts | 0 pts | 5 pts |
| The document is grammatically correct, typo-free, and cited where necessary. | 1 pts | .5 pts | 0 pts | 1 pts |
|
Total Points: 15 |
Summary and Tasks Reminder
Summary and Tasks Reminder
This lesson hopefully conveyed how creative and exciting the developments are that allow for the creation of 3D models and VR content. There are classic approaches coming out of photogrammetry, such as structure from motion mapping (SFM), that existed for a long time but only recently reached a mature level. There are creative minds that combine different technologies such as Google Earth and SFM to simulate fly overs and much more. The article we integrated by Chen and Clarke was only been presented in September 2016, so very recent. As we have been successfully using it in our own work, we thought we would integrate it into this lesson. It is a really fast-moving field and if anything, many products will become even more mature over the next years with numerous start-ups pushing into the market.
Reminder - Complete all of the Lesson 2 tasks!
You have reached the end of Lesson 2! Double-check the to-do list on the Lesson 2 Overview page to make sure you have completed all of the activities listed there before you begin Lesson 3.