Section Five: Display a Scene with More Realistic Details
Section Five: Display a Scene with More Realistic Details
Introduction
As you can see, the extruded buildings in the previous section, are blocks with no details, just the elevation. In this section, you will learn how to present part of west campus with more details. To do so, you should remove some of the features from UP_BUILDINGS that overlap with the layer that has more detailed information. This new layer (UP_Roof_Segments), that you will add to the map, consists of roof segments with detailed elevation. This information has been extracted from LiDAR data. In other words, instead of treating buildings as a big, undifferentiated chunk, every change in shape or elevation in each building has been detected and a new layer that represents those change/segments have been created. In Module 4, we have explained the process of creating this layer in detail.
5.1 Add and Extrude the UP_Roof_Segments
5.1 Add and Extrude the UP_Roof_Segments
In this section, you will remove the overlapping part of UP_BUILDINGS Layer with the P_Roof_Segment. This means that the UP_Roof_Segments represents part of campus with more details while UP_BUILDINGS will represent the rest of the campus (where the detailed model is not available) with less detail.
Therefore, you should remove the overlapping feature from UP_BUILDINGS Layer. This means that the UP_Roof_Segments represents part of campus with more details while UP_BUILDINGS will represent the rest of the campus (where the detailed model is not available) with less detail.
- On the contents pane, uncheck UP_BUILDINGS Layer.
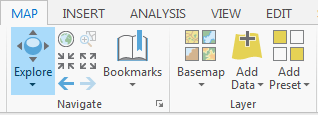
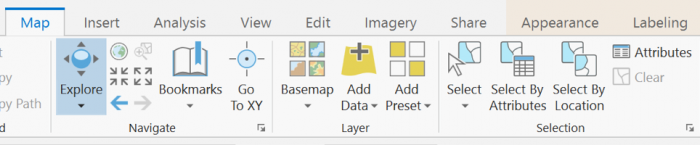
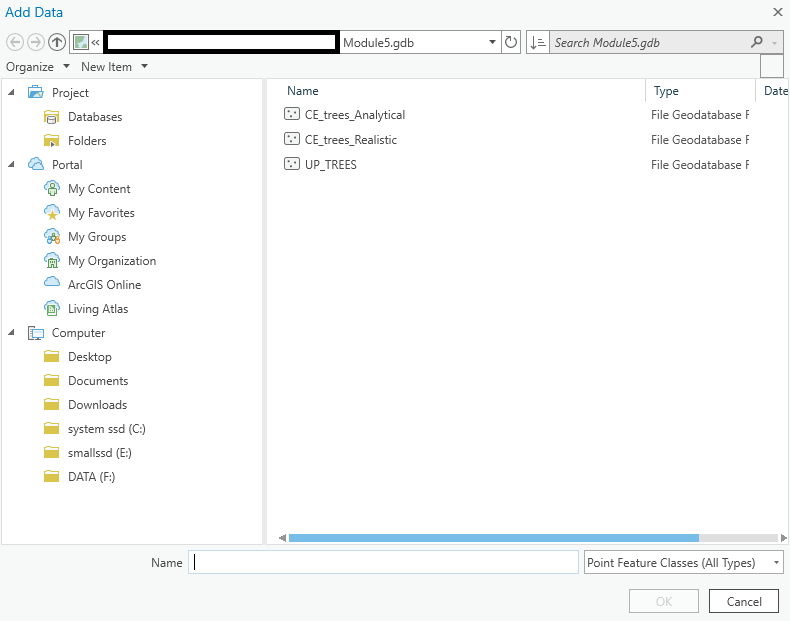
- On the Map tab, in the Layer group, click the Add Data button.
 Credit: 2016, ArcGIS [2]
 - Add UP_Roof_Segments from the geodatabase (Module5.gdb) that you downloaded earlier in this Lesson.
- Right-Click on UP_Roof_Segment layer and select properties.
- Go to Elevation tab. Select the drop-down menu in front of ‘Features are’.
- Select ‘On the ground’ option. This means that the buildings layer uses the DEM as the ground base for elevation. Click OK.
- Click UP_Roof_Segment on the contents pane.
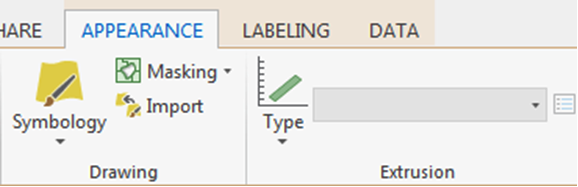
- On the Appearance tab, in the Extrusion group, click the Type button and choose Max Height.
 Credit: 2016, ArcGIS [2]
 - Click the menu next to Type and choose Z_Mean_Roof.
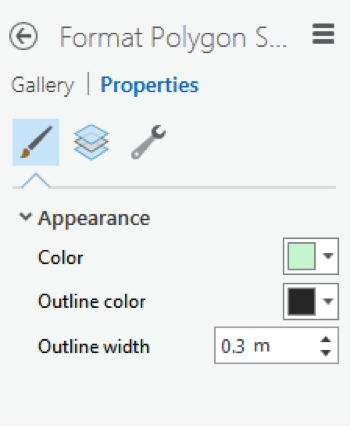
- Change the layer outline width to 0.3.
 Credit: 2016 ArcGIS [2]
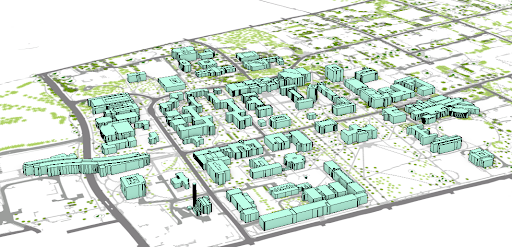 Credit: ChoroPhronesis Lab [1]
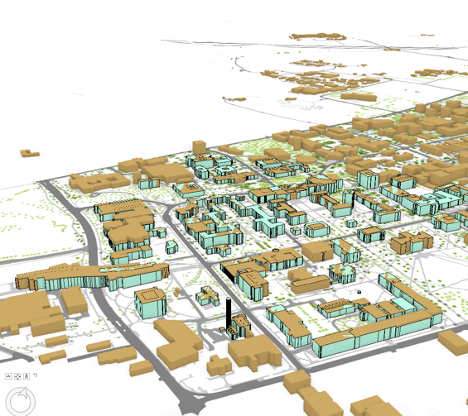
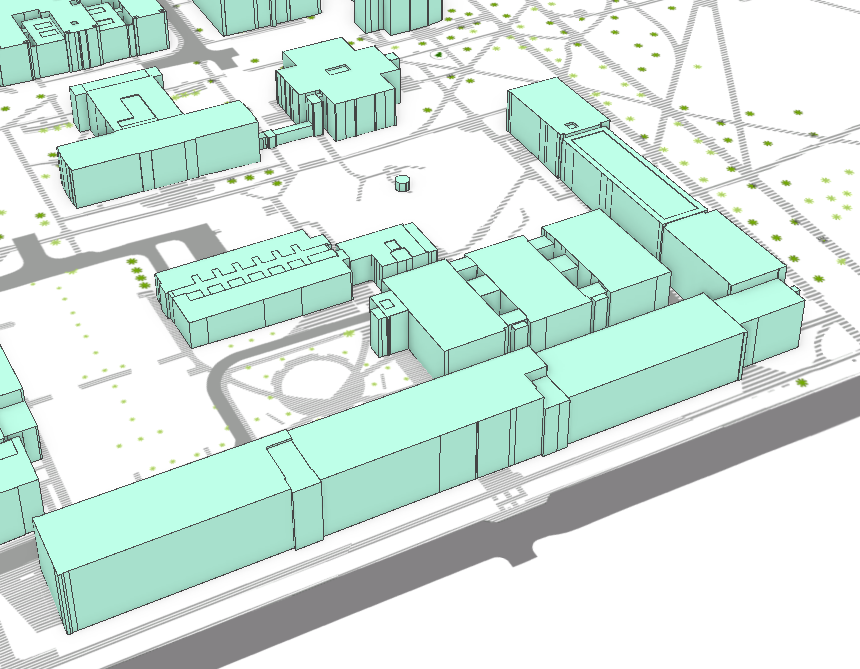
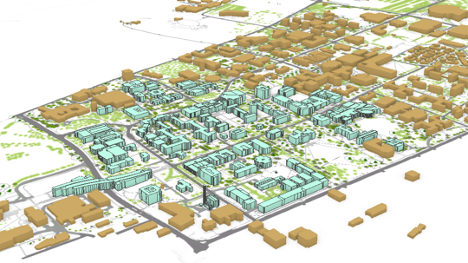
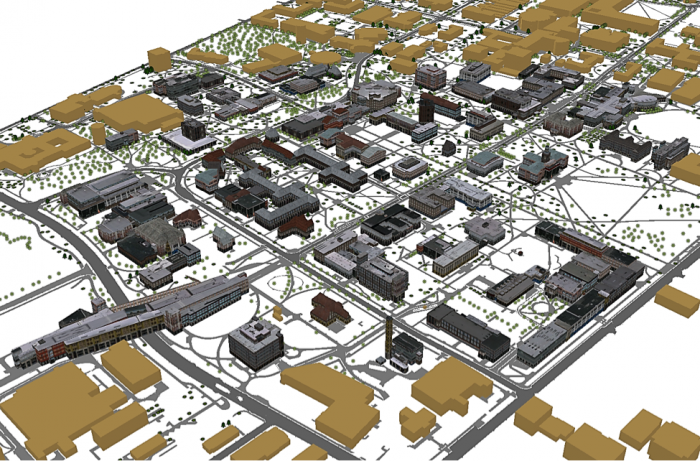
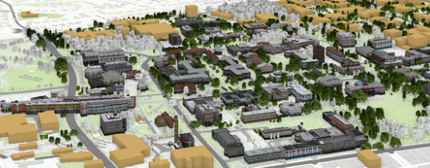
This is how your model should look like. You can navigate by holding down the scroll wheel or the V key and drag the pointer to tilt and rotate the scene. You can see the level of details each building presents in 3D.
 Credit: 2019, ArcGIS [2]
 -
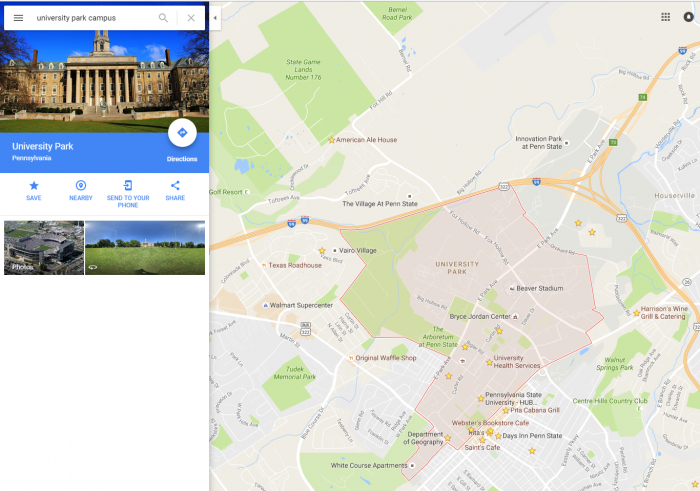
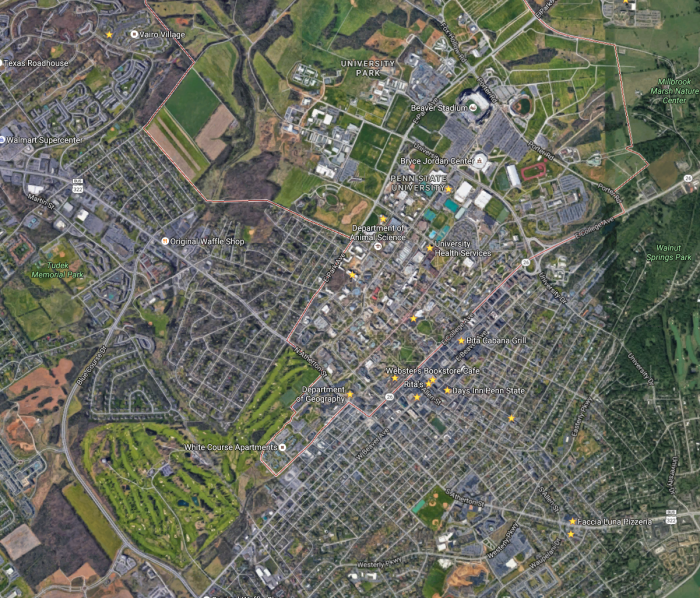
To see how the buildings look like in reality, go to GoogleMaps [3]. Search for University Park Campus.
 Credit: Google Maps [4]
Click the earth option at the bottom of the page.
 Credit: Google Maps [4]
Your map will turn to Earth view.
 Credit: Google Maps [4]
Zoom in to Penn State Alumni Association. This is how the roofs structures look like:
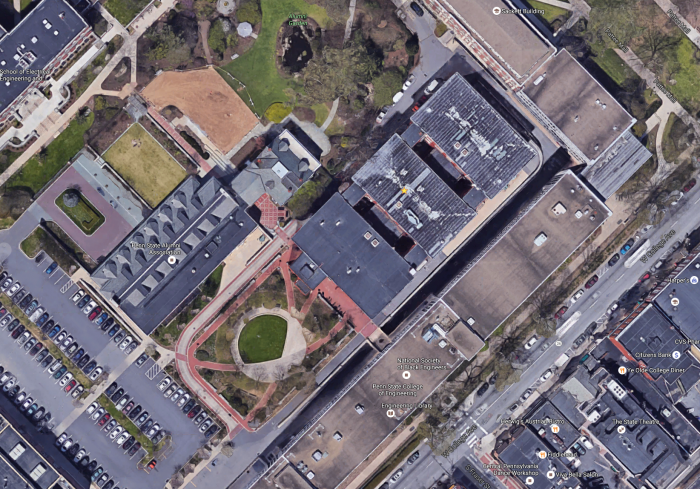 Credit: Google Maps [4]
Go back to your ArcGIS Pro project and find the same building. You can find the same level of detail in roof structure.
 Credit: ChoroPhronesis Lab [1]
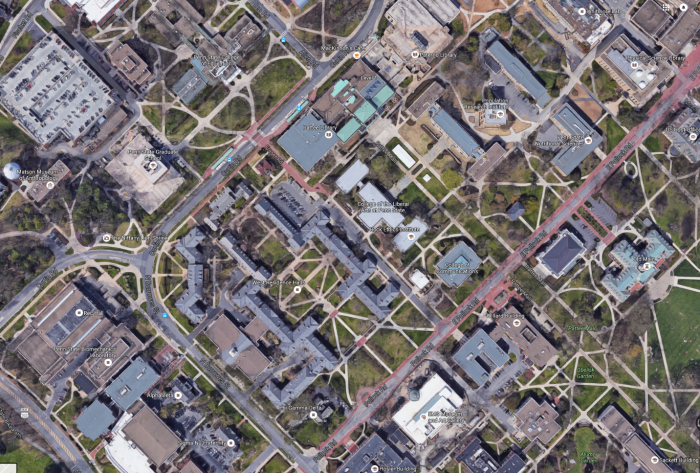
Go back to Google map and explore more. You see that some of the buildings have flat roofs and some shed roofs. However, in your 3D model, all the roofs are flat. You will add different roof types later in this module.
 Credit: Google Maps [4]
 - Go back to ArcGIS Pro. In the content pane, turn the UP_BUILDINGS layer back on and make sure that it is located under the UP_Roof_Segments layer. In parts of campus which has both layers, the two layers are not overlapping well; this is because UP_Roof_Segments layer masking UP_BUILDINGS and has more details in the change of elevation than the UP_BUILDINGS Layer.
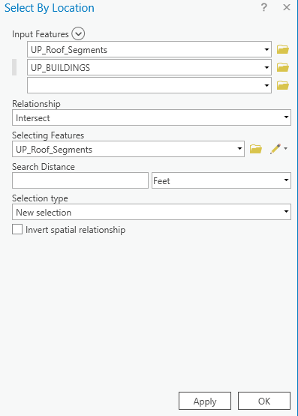
- In order to remove features from UP_BUILDINGS, you should select those features. The best way to do that is to select by location. On the Map tab, in the Layer group, click the ‘Select By Location’ under Selection group.
- You will select features from UP_BUILDINGS that intersect with UP_Roof_Segments. Therefore, choose the factors as shown in the image below. Click Run.
- If you uncheck the UP_Roof_Segments layer, you can see the part of UP_BUILDINGS that has been selected. This is the part that overlaps the UP_Roof_Segments.
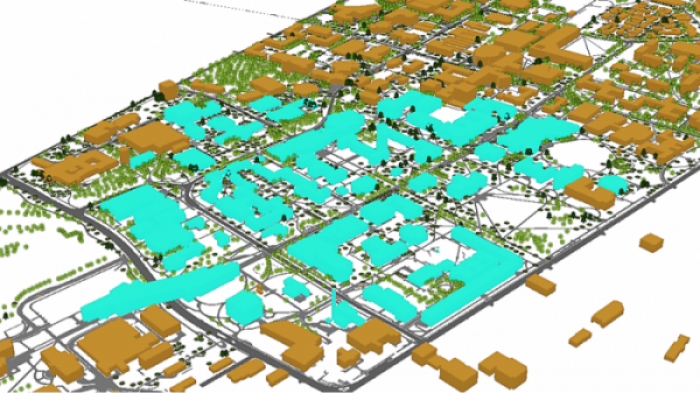 Credit: ChoroPhronesis Lab [1]
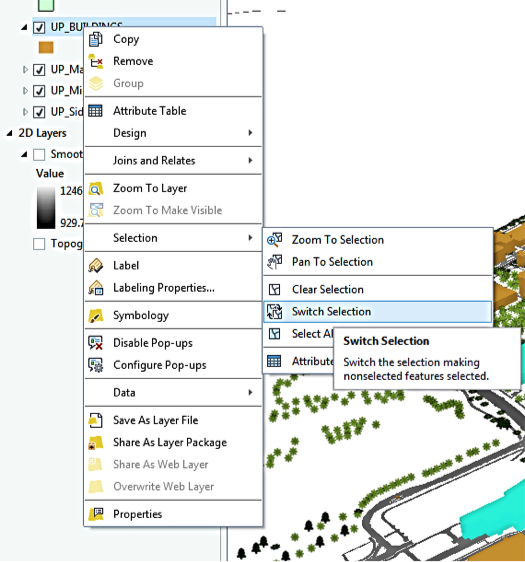
However, what you need to keep is the rest of the buildings, not what has been selected. Therefore, you will switch selection to select the remaining part of the campus.
- Right-click on Up_BUILDINGS. Under Selection, choose Switch Selection.
 Credit: ChoroPhronesis Lab [1]
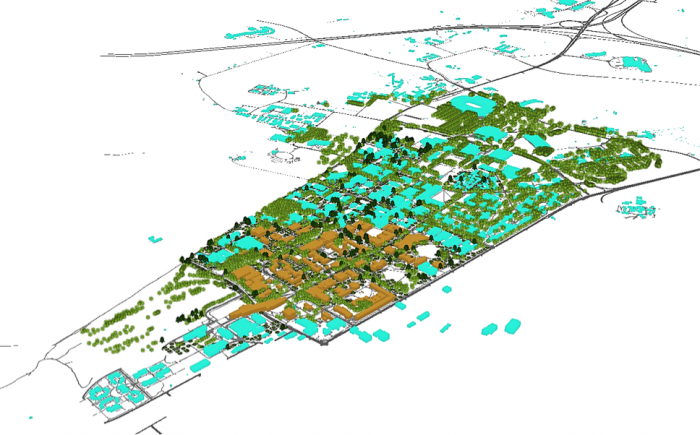 Credit: ChoroPhronesis Lab [1]
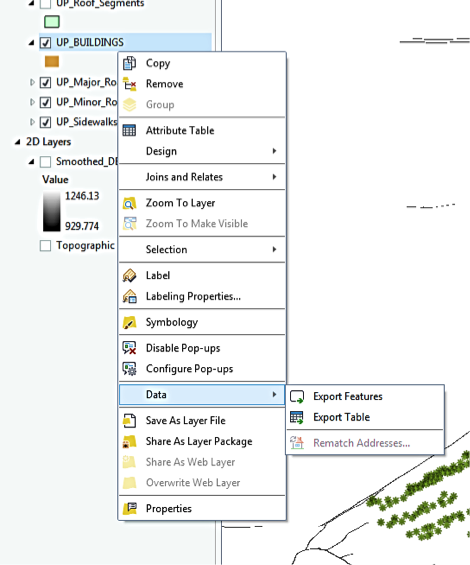
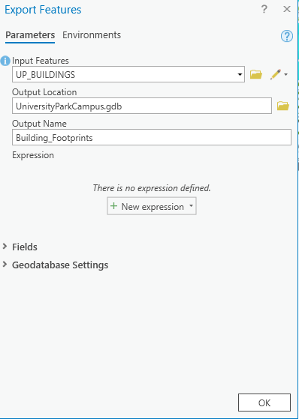
 - Now, you will export the selected features. Right-click on UP_BUILDINGS layer and click Data, choose Export Features.
 Credit: 2016 ArcGIS [2]
 - Rename the output features to ‘Building_Footprints’. And click Run.
 Credit: 2020, ArcGIS [2]
 - On the contents pane, uncheck UP_BUILDINGS Layer. Click Building_Footprints on the Contents pane.
- If the Building_Footprints layer is not extruded,in the Appearance tab, in the Extrusion group, click the Type button and choose Max Height. Click the menu next to Type and choose Z_Mean.
 Credit: 2016, ArcGIS [2]
 - Turn the UP_Roof_ Segments layer back on. Your map should look like this:
 Credit: ChoroPhronesis Lab [1]
 - Save your project.
5.2 Apply a Rule Package to the UP_Roof_Segments Layer
5.2 Apply a Rule Package to the UP_Roof_Segments Layer
In this section, you’ll add special 3D textures and models to your scene to give it a more realistic appearance. The symbology of the structures is presentable in 3D but doesn't give the impression of a realistic city model. For instance, types of roofs, roof textures or façade textures, are not defined in this type of 3D presentation. To make the campus look more realistic, you can set the layer's symbology with a rule package created in CityEngine (see Lesson 2). Rule packages contain a series of design settings that create more complex symbology. Although you cannot create rule packages in ArcGIS Pro, you can apply and modify them from an external file (more in the next lessons).
- Download Building_From_Footprint rule package [6].
- Locate the compressed file in your Downloads folder. Save the file in the project folder you have created earlier in this Module. It is a single file named Building_From_Footprint.rpk.
- If necessary, open the University Park Campus project in ArcGIS Pro.
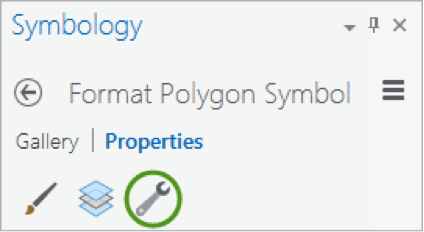
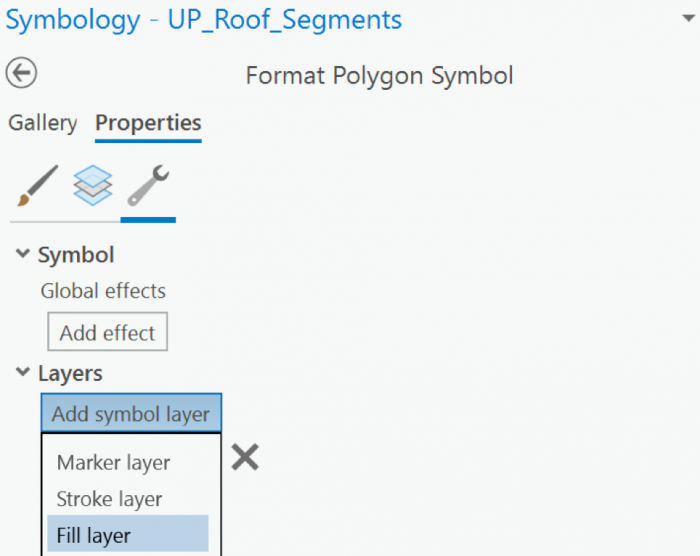
- In the Contents pane, click the symbol under UP_Roof_Segments to open the Symbology pane.
- In the Symbology pane, click Properties and click the Structure button.
Structure presents symbol layers, or graphical components, that create a symbol.
 Credit: 2016, ArcGIS [2]
For the UP_Roof_Segments, the only symbol layer is the light green solid color you have used. To add a rule package to the Symbology, you will create a new symbol layer to which a rule can be applied. - In the drop-down menu in the heading of the symbol layer, choose fill layer
 Credit: 2019, ArcGIS [2]
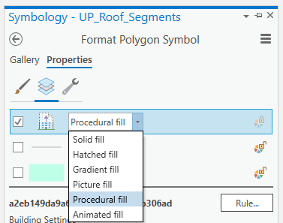
 - Next, you will apply the rules to the Fill symbol layer using the file you downloaded. Under Properties, click the Layers button. Then, select the Procedural fill. Uncheck the line and green color.
 Credit: 2021, ArcGIS [2]
 - The icon from a gray solid color would be changed to an icon indicating a rule assignment. Click the Rule button and Browse to the location of the extracted Building_From_Footprint.rpk file and double-click it. The Symbology pane populates with several symbology settings or rules, that can be adjusted.
- Click apply.
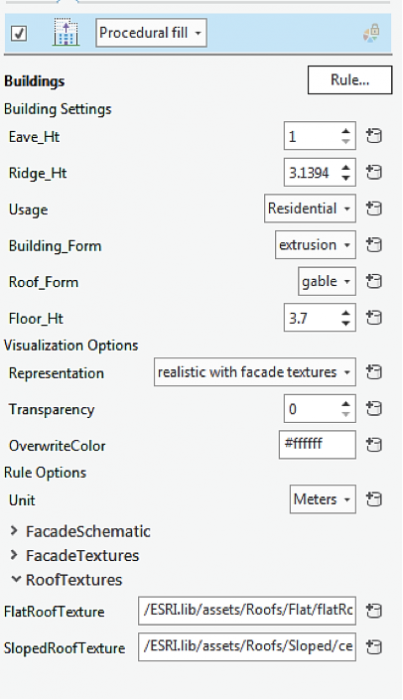
- On the Symbology pane, you need to set rules. Because the rules that are created in CityEngine are based on metric parameters, we have created fields with metric values in the Up_Roof_Segments attribute table.
 Credit: 2016, ArcGIS [2]
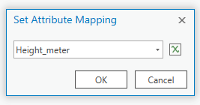
 - As you can see, next to each parameter is a ‘set attribute driven properties’ sign. Click to set values from the attribute table.
 Credit: 2021, ArcGIS [2]
 - Eva_Ht is the distance from the ground to the bottom of the roof. Select Height_Meter from the attribute table.
- Ridge_Ht is the distance from the ground to the top of the roof. Select Ridge_Height_Meter. It is mostly applicable to the slopped roof.
- For Usage select educational. You can see switching from another usage like residential to educational, the thumbnail on the bottom of the pane will change.
- Building_From, select extrusion.
- Change the Floor_Ht to 4.
- You will have three options for visualization: (1) realistic with façade textures, (2) schematic facades, (3) solid colors. For now, choose the first option and you will explore the rest later. Click Apply.
 Credit: 2016, ArcGIS [2]
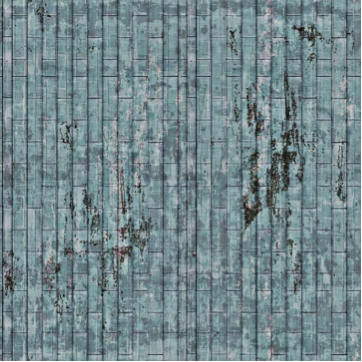
 - Explore the map to get a closer look at the symbology. Roof symbols and Façade symbols. As you see the façade material does not match the actual buildings you can see on Google Earth. That’s because real images of buildings of campus have not been taken. These images are from ESRI library for an international city which is a sample library with different building size and usage textures. The roofs are texturized base on some categories: flat, hip, shed, or pyramid. There is an asset folder of different roof textures and façade textures that are used in setting these rules. For instance, one of the Hip roof colors that you see in the following image. It has been assigned to Hip roofs along with a few more textures.
 Credit: 2016, ArcGIS [2]
 - Save your project.
5.3 Apply a Rule Package to UP_TREES Layer
5.3 Apply a Rule Package to UP_TREES Layer
In this section, you will insert a 3D model of trees with assigned rules. In your 3D Scene, you can see that 2D symbols of trees are presented in 3D. One of the ways to show your trees in 3D is to use LiDAR information such as crown diameter and tree height along with CityEngine procedural rules. However, ArcGIS Pro does not support assigning rule packages to point layers on the Symbology pane, yet. ArcGIS Pro is under constant development and will offer this functionality in the future. A workaround is to export the tree point layer as Polygons with Z information. Then the polygons can be converted to points. The point feature class with Z information and inherited rules can be added to your map as a preset.
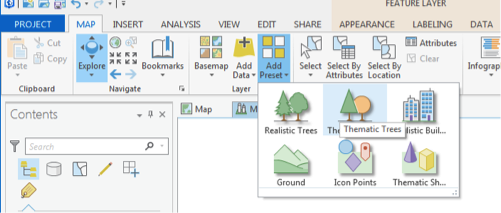
- Uncheck the Up_TREES layer in the 3D Layers list.
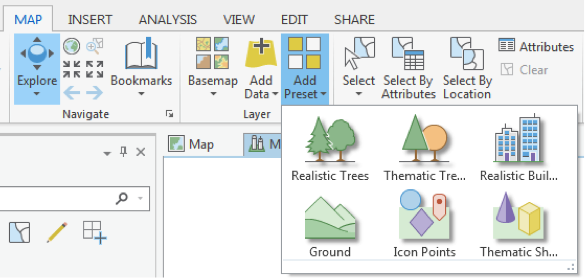
- Under the Map tab, click Add Preset and select Realistic Trees.
 Credit: 2016, ArcGIS [2]
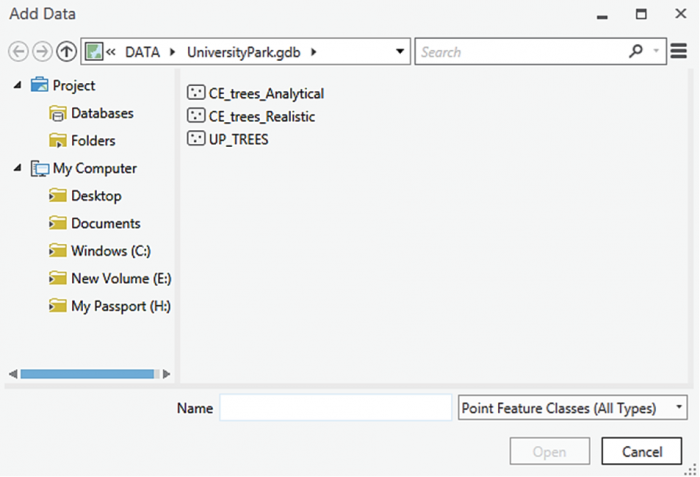
 - From the Geodatabase that you have downloaded, select CE_trees_Realistic. Click Select.
 Credit: 2016, ArcGIS [2]
 - The layer will be added to your 3Dlayers list.
 Credit: 2016, ArcGIS [2]
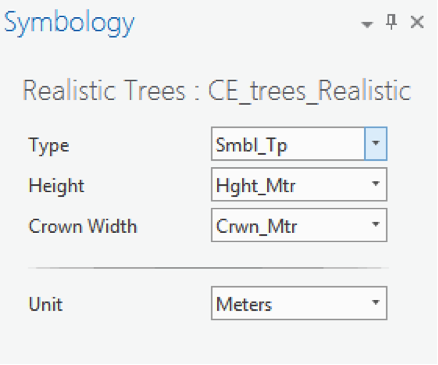
 - As you see on the map, the scale of trees is not right. Click on the symbol under the layer to modify it. Change the parameters as shown below.
 Credit: 2016, ArcGIS [2]
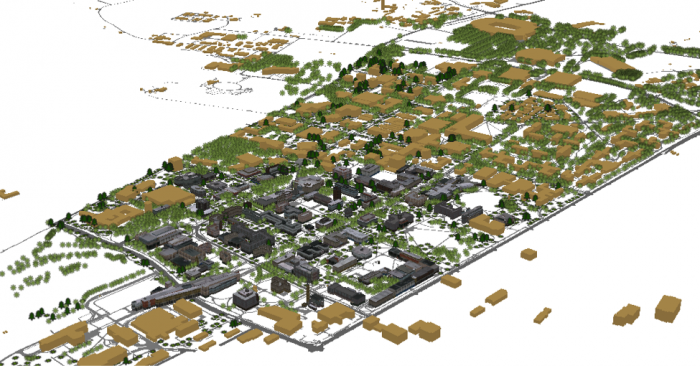
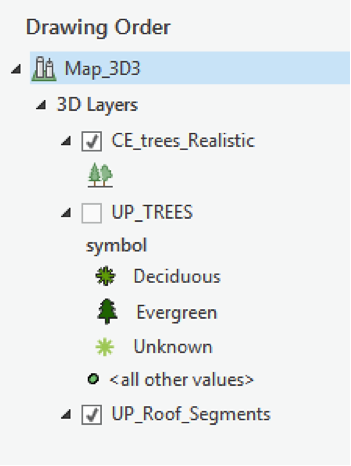
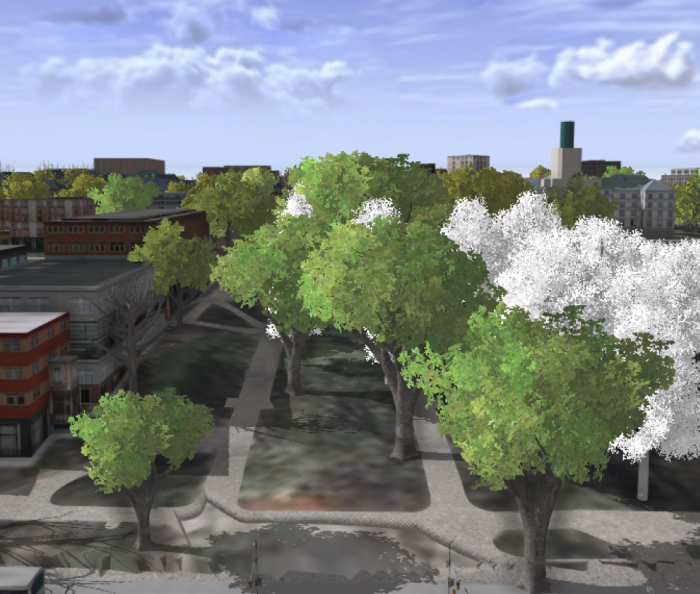
 - As you can see the trees height and crown diameter are now more realistic. You have three tree types under Smbl_TP: Deciduous, Evergreen, and Unknown. The unknown trees should be symbolized white as ghost trees. Unfortunately, both evergreens and unknown trees are colored white, although you can see that evergreen trees have a different shape than deciduous ones. If you change the type from Smbl_TP to Ash, for instance, you can see all trees are changing. You can try different tree types. We will update this section when the feature becomes available in ArcGIS Pro.
 Credit: ChoroPhronesis Lab [1]
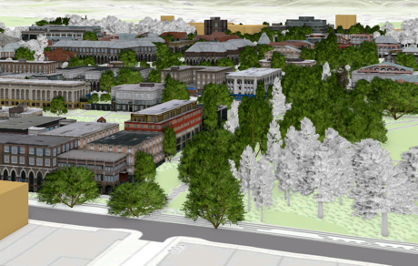 Credit: ChoroPhronesis Lab [1]
 - In the image above, you can see how the trees are symbolized in GIS. In CityEngine (as an example shown below), you can see that not only deciduous and evergreen trees are different but also various tree types under each category are symbolized differently. ESRI is continuously moving functionality from CityEngine to ArcGIS Pro so that it is hopefully only a matter of time that this function becomes available. We are not focusing on CityEngine in this course but will offer you an overview of how it works using the campus data as an example.
You can see the example of tree symbols used in CityEngine to symbolize trees. This vegetation library is imported from LumenRT 3D Plants to CityEngine.
 Credit: ChoroPhronesis Lab [1]
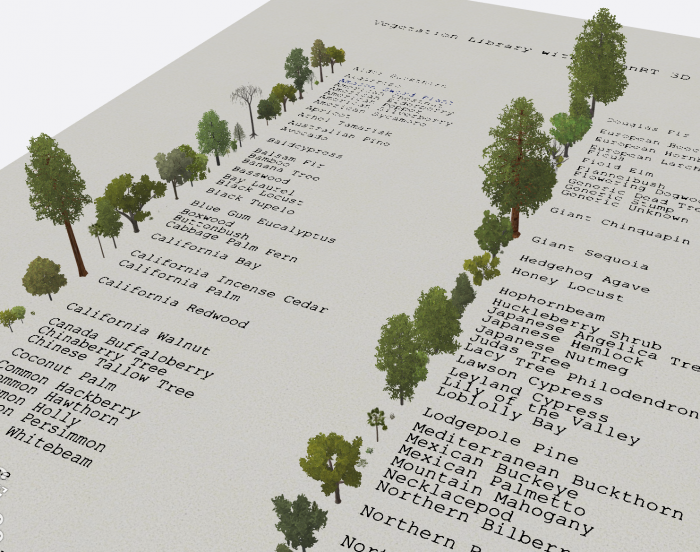 Figure: 3D vegetation with LumenRT ModelsCredit: ESRI/LumenRT vegetation library for CityEngine [8]
 - Create a PDF map (like the end of Section 3) or take a screenshot of your UP Campus realistic 3D model for the final assignment. This is labeled Task 3 on the Tasks and Deliverables of your graded assignment.
- Now you will save your project with a relevant name.
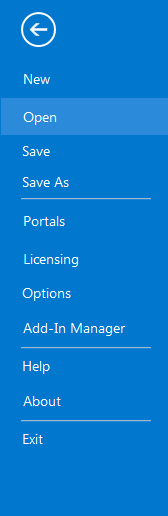
- Click the Project tab. Select Save As.
 Credit: 2016, ArcGIS
 - In the Projects Folder (C:\Users\YOURUSER\Documents\ArcGIS\Projects\UniversityParkCampus), Save Project as UniversityParkCampus_Lesson5. This way you will create a new project for the next lesson.
5.4 Change the Symbology from Realistic to Analytical
5.4 Change the Symbology from Realistic to Analytical
You have learned how to apply a rule package symbology to buildings to demonstrate a realistic view of campus. For some types of 3D analysis, an analytical demonstration may suffice. For the next Module, you will need an analytical presentation of campus. In this section, you will learn how to switch from realistic to analytical. In the next lesson, you will learn examples of 3D spatial analysis and you will need these analytical 3D models for the analysis.
- Click the Project tab. Select Save As.
Credit: 2016, ArcGIS [2]
- In the Projects Folder (C:\Users\YOURUSER\Documents\ArcGIS\Projects\UniversityParkCampus), Save Project as UniversityParkCampus_Lesson6. This way you will create a new project for the next lesson.
- Go back to the Map view.
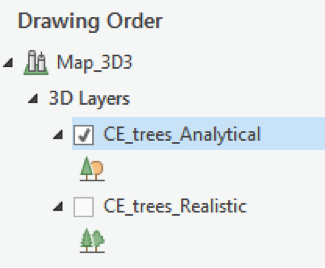
- Uncheck the CE_trees_Realistic.
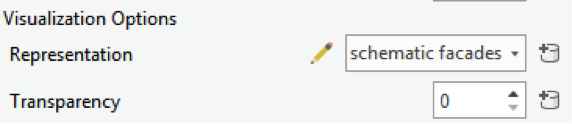
- Click on symbology under UP_Roof_Segments. On the Symbology pane, click Properties and select Layers.
- Change representation from realistic with façade textures to schematic facades.
Click apply.
 Credit: 2016, ArcGIS [2]
 - Your campus model should look like the following image:
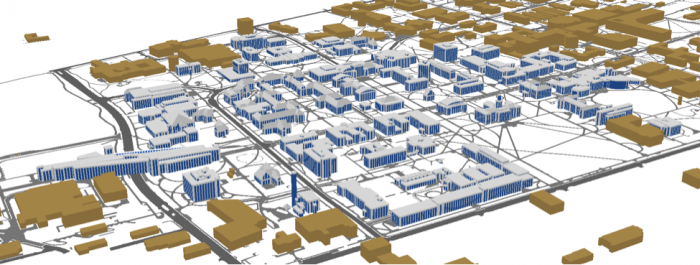 Credit: ChoroPhronesis [1]
 - Now, you will add thematic trees. On Map tab click Add Preset and select thematic trees.
 Credit: 2016, ArcGIS [2]
 - From the Geodatabase that you have downloaded, select CE_trees_Analytical. Click Select.
 Credit: 2016, ArcGIS [2]
 - The layer will be added to your 3Dlayers list.
 Credit: 2016, ArcGIS [2]
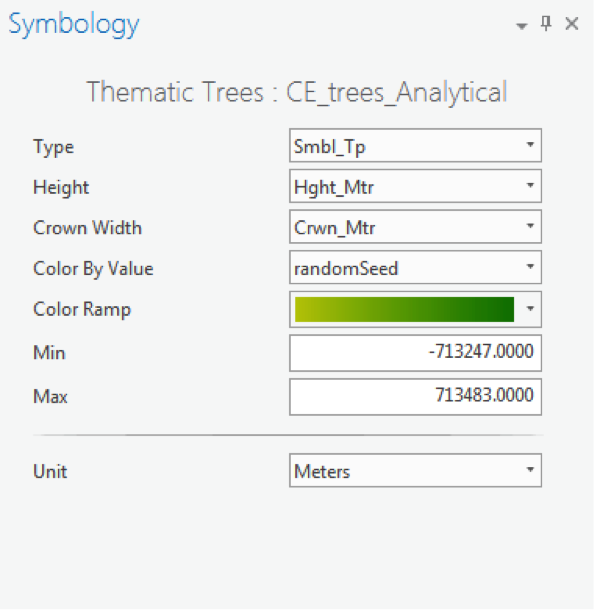
 - As you see in the map, the scale of trees is not right. Click on the symbol under the layer to modify it. Change the parameters as shown below.
As you see, one of the factors is color by value. Select random Seed and the green color ramp. This will give your trees a more colorful presentation.
 Credit: 2016, ArcGIS [2]
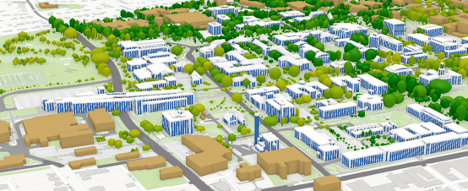 Credit: ChoroPhronesis [1]
 - Create a PDF map (like the end of Section 3) or take a screenshot of your UP Campus schematic 3D model for your graded assignment. This is Task 4 on the Tasks and Deliverables page.
- Save the project.
In this lesson, you learned how to work with ArcGIS Pro from creating a map and symbolizing layers to exploring raster and 3D data. You also learned about symbolizing 3D layers with rule packages from CityEngine. In the next lesson, you will learn about some 3D analysis that is possible with 3D data.