1.2 Adding Flood Map Layer and Understanding the Attributes
1.2 Adding Flood Map Layer and Understanding the Attributes
- Click the Map tab to return to your 2D map.
- Turn off Smoothed_DEM.
- Turn on UP_BUILDINGS.
- Click add data. and from Lesson6.gdb, add FLD_HAZ_FEMA layer. Make sure it is located below UP_BUILDINGS in the Contents Pane.
-
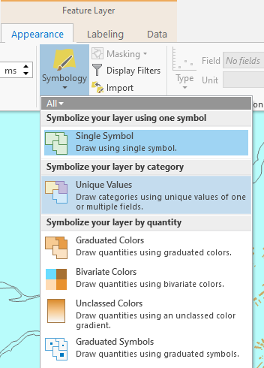
Click to modify symbology. Under the Appearance tab, select Symbology and choose Unique Values.
 Credit: ArcGIS, 2021
 -
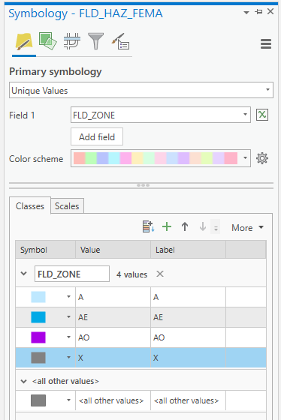
As you have learned in previous lessons, symbolize your layers based on FLD_ZONE to have good visualization of various values. Remove the outline for values.
 Credit: 2019 ArcGIS
 -
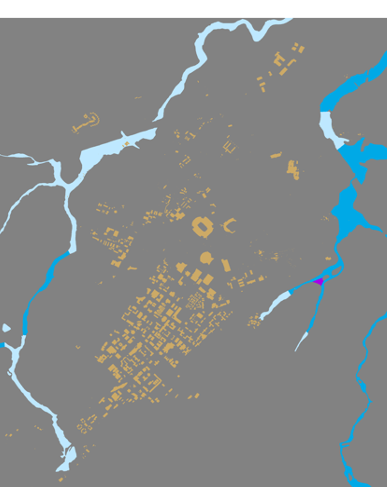
Zoom to UP_BUILDING layer. You should have a clear visualization of floodways with different categories.
 Credit: ChoroPhronesis Lab
Based on FEMA’s information3, categories A, AE, and AO are all 1-percent-annual-chance flood. A is determined using approximate methodologies. AE is created based on detailed methods. Finally, AO represents shallow flooding where average flood depths are between 1 to 3 feet. X represent areas that are not in a floodway. For this study, you are going to consider all three A, AE, and AO layers as one floodway category.
3FEMA: Flood Zones [1]