1.6 Extrude the Flood_Zones_Campus Layer
1.6 Extrude the Flood_Zones_Campus Layer
- On the map tab, turn off the Topographic layer.
- Right- Click on Flood_Zone_Campus and select Copy.
- Click on Map_3D tab. Turn off Smoothed _DEM and WorldElevation3D/Terrain3D under Elevation surfaces/ Ground.
- Click on Map_3D in the contents pane and select paste. Flood_Zone_Campus will be added to your 2D_Layers.
-
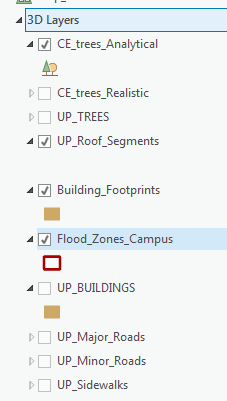
To add it to the 3D scene, in the Contents pane, drag Flood_Zones_Campus from 2D Layers to 3D layers. Placing it below Building_Footprints. Make sure the other 2D layers are off.
 Credit: 2016 ArcGIS
 Credit: ChoroPhronesis Lab
 -
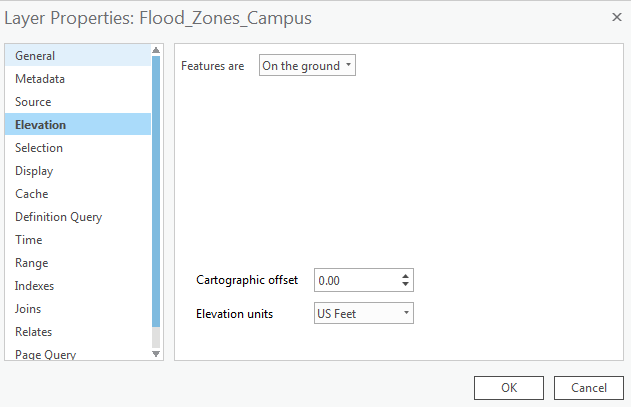
If you cannot see the layer, right-click on the layer and select properties. Click Elevation and make sure the Features are set as "on the ground".
 Credit: 2016 ArcGIS
 -
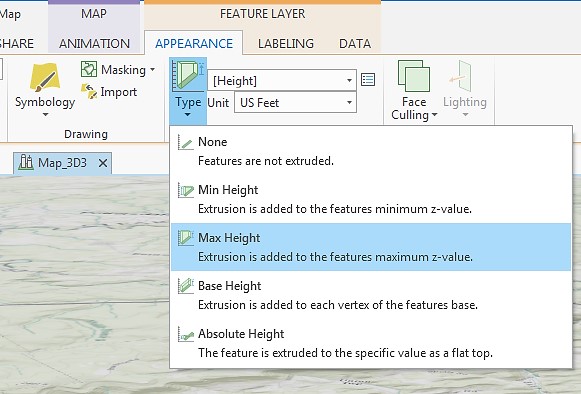
Click Flood_Zones_Campus. On the ribbon, click Appearance. Under Extrusion, choose Max Height as Extrusion Type. Select Height as the field of Extrusion. The Unit will be US Feet.
 Credit: 2016 ArcGIS
 -
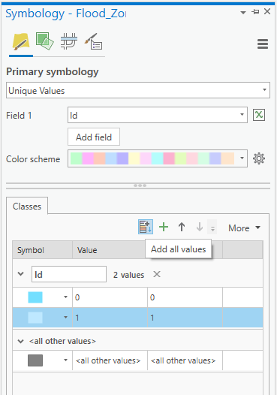
Click Flood_Zones_Campus. On the ribbon, click Appearance and from the Symbology drop-down menu choose Unique Values. In the Symbology pane, the value field is Id. Click Add all values. Change the color of id=0 as Apatite Blue with no border. The color for id=1 will be Sodalite Blue with no border.
 Credit: ArcGIS, 2021
 -
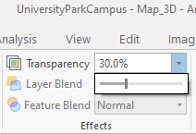
Again select the Flood_Zones_Campus. On the ribbon, click Appearance. On Effects group, change the transparency to 30 percent.
 Credit: ArcGIS, 2021
 -
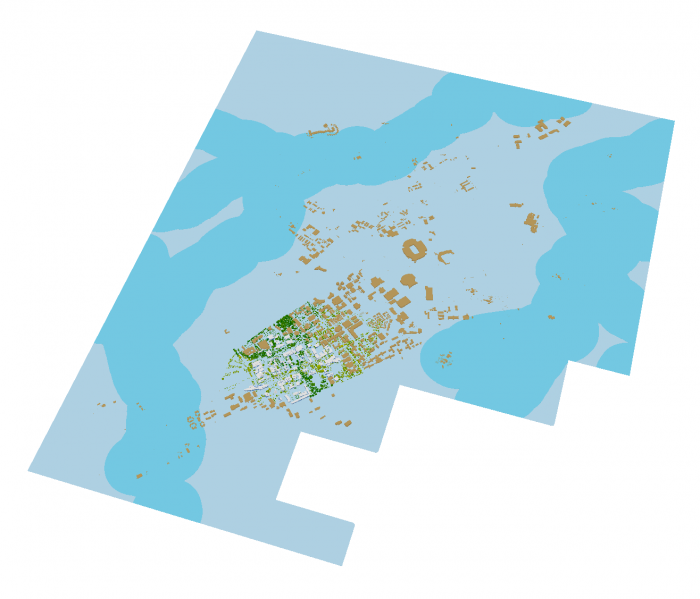
This will be the result:
 Credit: ChoroPhronesis Lab
 -
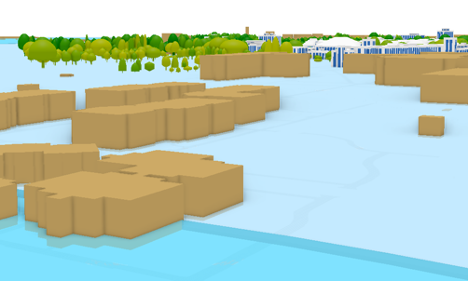
Using your mouse left click and V on the keyboard, navigate through the map. Zoom in to some buildings in different flood zones.
 Credit: ChoroPhronesis Lab
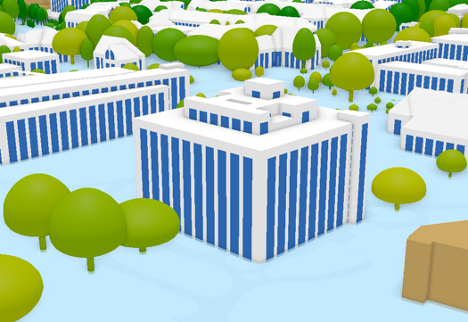 Credit: ChoroPhronesis Lab
You can see how less Walker building is flooded compared to peripheral buildings on campus. Changing the height information flood elevation, you can have different results. If you are curious to see how the visualization changes, change the attribute values of Height field in the attribute table.
- Make a Screenshot of OldMain in which the level of flooding can be seen. Paste your screenshot into Word and label it Task 1.
- Save the Project.