Basic Theory
Overview
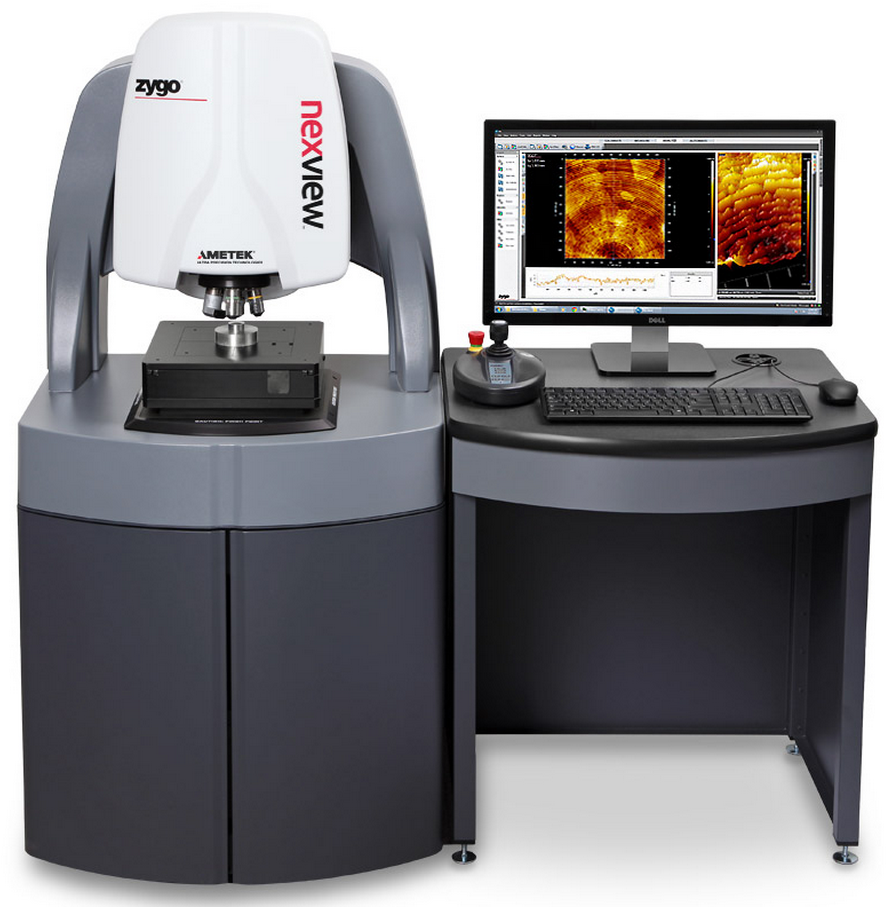
Prior to reviewing the next section on the Nexview 3D profilometer and Mx™ software, you should have an understanding of light, interference, phase, coherence, and basic interferometry. The Nexview 3D optical profiler uses coherence scanning interferometry to measure surface topography, so understanding these concepts is critical to utilizing the instrument effectively.
Objectives:
Upon completion of this training, users should:
- define the following terms; light, interference, phase, and coherence;
- describe how a basic interferometer functions.
Understanding how the instrument works is critical in ensuring the best quality of data, timely collection of data, and the safety of the profilometry from accidents and misuse. Below, you will find a list of terms that are critical to know and understand for the effective use of the instrument. This Interferometer Theory tab goes over information in some detail, but assumes the reader has had some exposure to these topics. If more detail is needed, in-depth resources are listed at the bottom of each page for readers to access. There is a self-check provided at the end of the Theory section.
- Wave theory of light
- Phase
- Interference
- Coherence
- Interferometry
Next Steps
To review Light Theory associated with using the profilometer, click on the Light link in the navigation below or on the right-hand side.
Light
The Nature of Light
Light is electromagnetic radiation, a form of energy that travels in waves. The term usually refers to visible light, a portion of the electromagnetic spectrum that is visible to the human eye.
- For interferometry, we are interested in the wave properties of light.
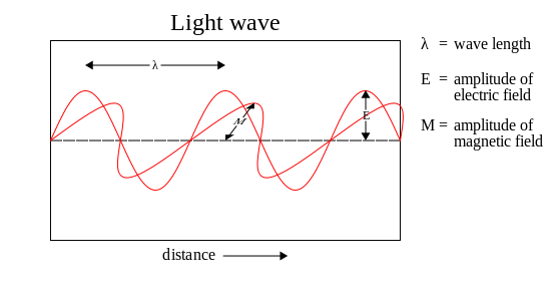
Wave Anatomy
It is important to know the definitions of the characteristics which describe a wave. A typical transverse wave and its components are shown below.
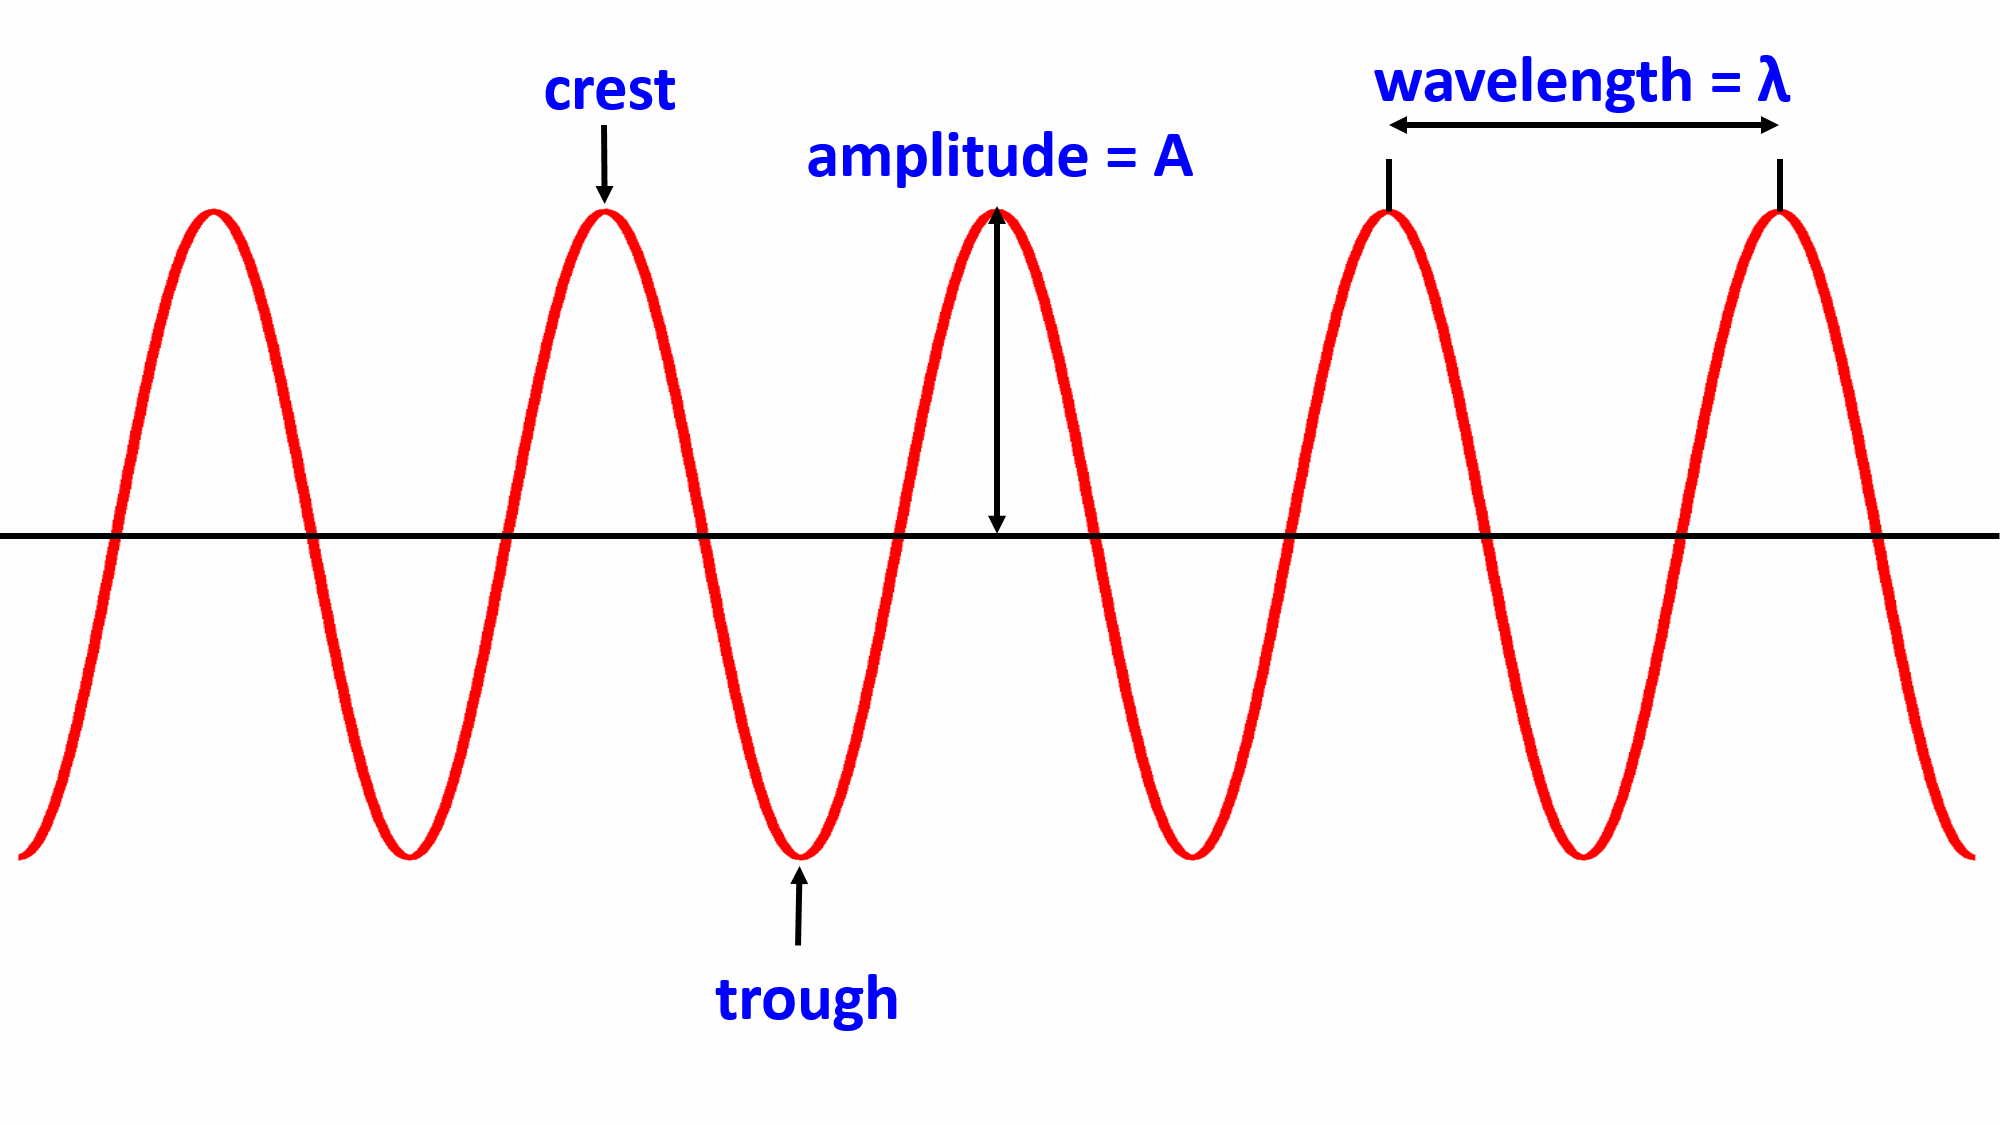
Definitions:
- Crest is the highest point of the wave.
- Trough is the lowest point of the wave.
- Amplitude (corresponds to energy of the wave) is the distance from the baseline to a crest of trough.
- Wavelength (corresponds to the frequency and speed of the wave) is the distance between two corresponding points on neighboring waves.
Knowledge Check:
- What is white light?
- Can you define the parts of a wave?
For further reading on Electromagnetic Radiation, see Wikipedia page.
For further reading on White Light, see Wikipedia page.
For further reading on Wave Anatomy, see APlusPhysics.com page on Wave Characteristics.
Phase
Waves can be mathematical, described with sinusoidal functions. It takes one cycle to move through the waveform and return to your starting displacement position from baseline. The phase is a way to describe where you are on the wave form at a particular point in time. Phase values move through 0o to 360o (0 to 2π radians).
In waves "phase" has two different, but closely related, meanings. One is the fraction of the wave cycle that has elapsed relative to the origin and another is the initial angle of a sinusoidal function at its origin (commonly referred to as phase offset).
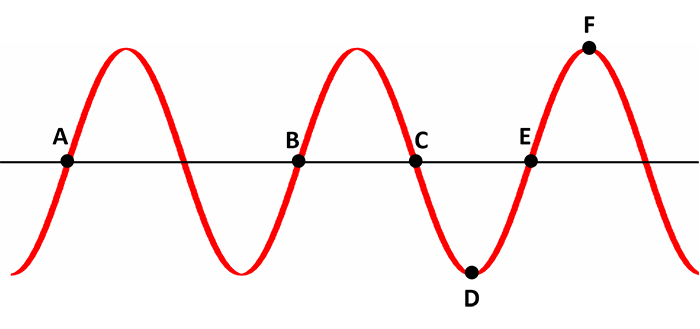
To the left, is a standing wave with positions A-F noted. Traveling from A to B represents one cycle of the wave, B to E another cycle. A, B, and E are said to be in phase as they have the same displacement from baseline and are traveling in the same direction (up from a trough, not down from a crest). Position C is 180 degrees (π radians) out of phase with A, B, and E, while D is 180 degrees out of phase with F. E is 90 degrees (π/2 radians) out of phase with F.
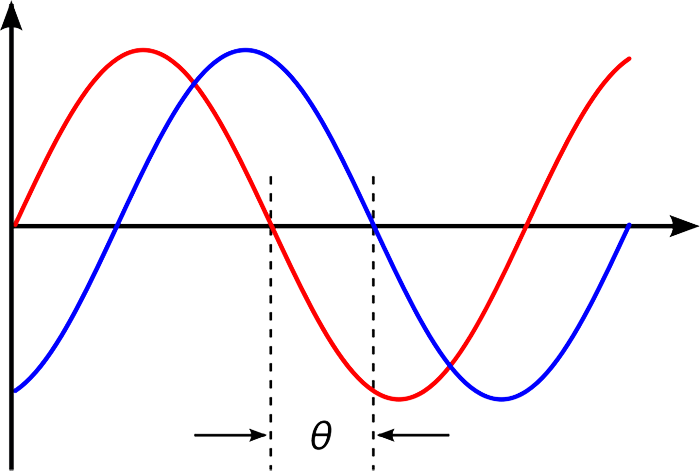
Phase Difference
Phase difference is the difference, expressed in degrees or time, between two waves having the same frequency and referenced to the same point in time.
Waves are said to be in phase if there is no phase difference between them. Waves are said to be out of phase if there is a phase difference, and the amount is expressed in degrees (0o-360o) or in radians (0 to 2π).
Knowledge Check:
Can you define the following terms?
- phase
- phase shift
- phase offset
- phase difference
For further reading on Phase, see Wikipedia page.
For further reading on Radians, see Wikipedia page.
Interference
Wave Interference
From the superposition principle of waves: Interference is the phenomenon that occurs when two waves are incident on the same point. The total displacement at that point is equal to the sum of the displacements of the individual waves. If a crest of a wave meets the crest of another wave, then the amplitude is the sum of the individual amplitudes; constructive interference. If a crest of one wave meets a trough of another wave, then the amplitude is equal to the difference in the individual amplitudes; destructive interference.
Examples of Interference
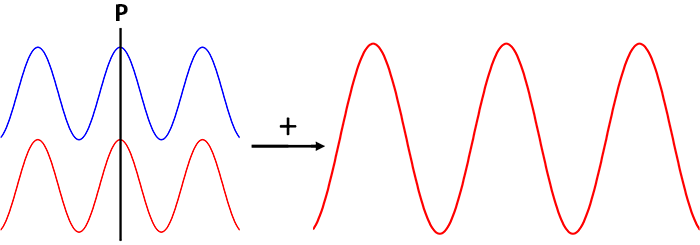
Carrying the idea of phase over from the previous section, if we look at the above waves at point P, we can see they are in phase. If these waves were incident on the same point, the resultant wave would be the sum of the two waves, resulting in a wave twice the size.
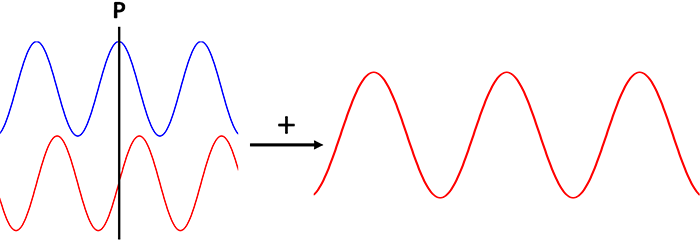
In the above example, the waves are 90° out of phase and the resultant wave is not nearly as large as the 0° phase constructive interference.
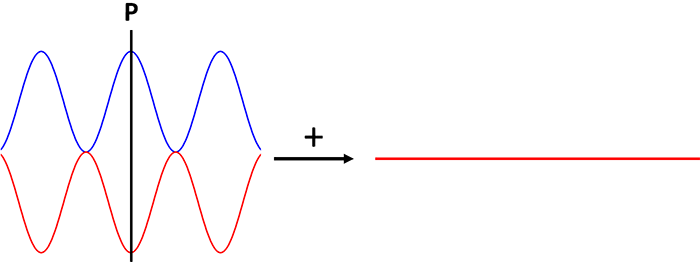
In the above example, the waves can be seen to be 180° out of phase. The crests and troughs of one wave are lining up exactly with opposite in the other wave. The resultant wave is 0, destructive interference.
Knowledge Check:
- What is interference?
- What is destructive interference?
- What is constructive interference?
For further reading on Phase and Interference, including some interactive demos of phase angle, phase difference, and interference, see University of Salford's page on Superposition of Waves.
For further reading on Superposition principle of waves, see Wikipedia page.
For further reading on Interference and wave propagation, see Wikipedia page.
A Basic Interferometer
Interferometry
To understand interferometry, you need to understand interference, phase, and waves. The basic idea is to take a beam of light, split it into two equal halves, send one down a reference path, the other down a test path, and collect the reflected light at a detector.
In our static example to the left: the beam leaves the light source, hits the beam splitter which creates two equal beams. Each of these beams travels a different route, called a path, and they are recombined before arriving at a detector. The path difference, the difference in the distance traveled by each beam, creates a phase difference between them. It is this introduced phase difference that creates the interference pattern between the initially identical waves.
In the example above, the system is static, neither path length is changing. The image below gives a better example of what is happening in the profilometer. The top wave represents the reference path to the detector. Since its path length does not change, the phase of the light in that path does not change. The middle wave represents the test path to the detector. The scanner is moving through Z, changing the path length, which changes the phase of the arriving light at the detector. The resultant wave (bold bottom) shows the intensity of the measured light at the detector.
Coherence
Coherence
Waves are said to be coherent if they have a constant phase difference and the same frequency. It is an ideal property of waves that enables (temporally and spatially constant) interference (Wikipedia:coherence). A full treatment of coherence is outside the scope of this training module, please see references below for more information.
Interference is nothing more than the addition, in the mathematical sense, of wave functions. A single wave can interfere with itself, but this is still an addition of two waves. Constructive or destructive interferences are limit cases, and two waves always interfere, even if the result of the addition is complicated or not remarkable (Wikipedia:coherence).
When interfering, two waves can add together to create a wave of greater amplitude than either one (constructive interference) or subtract from each other to create a wave of lesser amplitude than either one (destructive interference), depending on their relative phase. Two waves are said to be coherent if they have a constant relative phase (Wikipedia:coherence).
Spatial coherence describes the correlation (or predictable relationship) between waves at different points in space, either lateral or longitudinal. Temporal coherence describes the correlation between waves observed at different moments in time (Wikipedia:coherence).
Temporal Coherence
Temporal coherence is the measure of the average correlation between the value of a wave and itself delayed by τ, at any pair of times. Temporal coherence tells us how monochromatic a source is. In other words, it characterizes how well a wave can interfere with itself at a different time. The delay over which the phase or amplitude wanders by a significant amount (and hence the correlation decreases by significant amount) is defined as the coherence timeτc (Wikipedia:coherence).
The relationship between coherence time and bandwidth
It can be shown that the larger the range of frequencies Δf a wave contains, the faster the wave decorrelates (and hence the smaller τcis) (Wikipedia:coherence).
τcΔf >/= 1
Examples of Temporal Coherence
- A wave containing only a single frequency (monochromatic) is perfectly correlated with itself at all time delays, in accordance with the above relation. (example: laser)
- Conversely, a wave whose phase drifts quickly will have a short coherence time.
- Finally, white light, which has a very broad range of frequencies, is a wave which varies quickly in both amplitude and phase. Since it consequently has a very short coherence time (just 10 periods or so), it is often called incoherent.
Knowledge Check:
- What is coherence?
- Do you understand the effect of frequency bandwidth on coherence?
This page takes a lot of information directly from the Wikipedia page on coherence. This is only a small portion; for more information, it is recommended to visit the page.
Coherence Scanning Interferometry
Time to put it all together
- Light is a wave.
- Waves arriving at the same place in time (detector) can be characterized by their phase and intensity.
- A basic interferometer creates two beams from one source and sets up an interference pattern by combining a fixed reference path with a moving test path at the detector.
- Coherence between two waves refers to the ability of the waves to interfere with each other in an observable way.
- White light has a very short coherence length due to its wide distribution of frequencies.
- All combined, they make up the basics of coherence scanning interferometry.
Why white light?
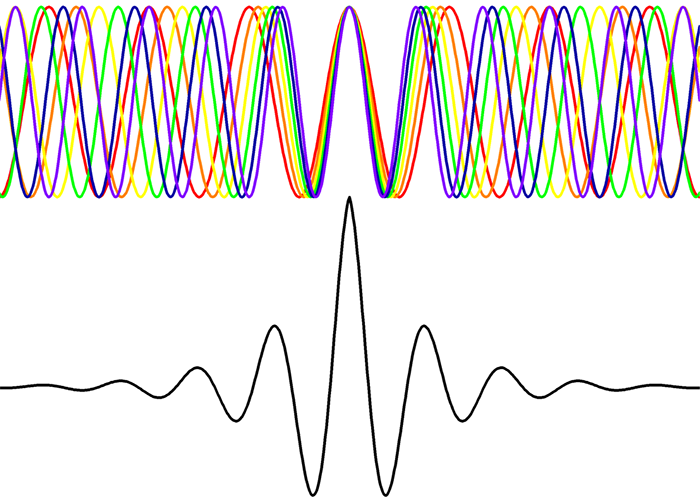
The image to the left depicts a white light source (top) and its distribution of component colors. The coherence length length is inversely proportional to the bandwidth, so the coherence length is very short. The "random" noise of white light produces an inference signal only when the optical path difference between reference and test paths is less than the coherence length of the beam. This can be seen in the resultant wave at the bottom. That center fringe of highest intensity is our point of zero optical path difference and essentially the probe of the interferometer.
Coherence Scanning Interferometry (CSI)
CSI refers to a class of optical surface measurement methods wherein the localization of interference fringes during a scan of optical path length provides a means to determine surface characteristics such as topography, transparent film structure, and optical properties. See Wikipedia for more information about Coherence scanning interferometry.
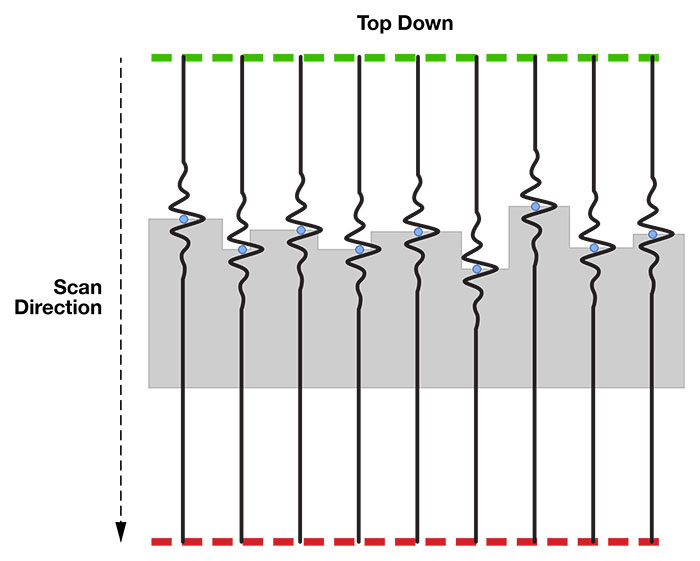
The instrument works by scanning in Z and recording the Z position for each and every pixel on the detector for where zero optical path difference (ZOPD) occurred. The objectives are designed so the internal reference and the test path have zero optical path difference at the focal plan of the objective. So, as the scanner moves through Z, when the surface starts to come into focus for each pixel, the inference fringes will become measurable, and the Z position of the center fringe (highest intensity) is recorded as it passes through ZOPD. Our detector is a 1024x1024 camera, which means our scan results in 1,048,576 (x,y,z) coordinates that make up the image.
For more information on CSI, see the Wikipedia pages for CSI (Wikipedia) and White Light Interferometry (Wikipedia).
Self Check: Theory
If you successfully pass this self-check, you may move on to the next section which describes in detail the Nexview 3D and Mx™ software. If you do not pass successfully, please review the information again. The scores from this activity are not monitored. Your ability to receive accurate measurements when using the instrument will be dependent upon your understanding of these concepts. You may revisit this information as often as you like.