Sea Level Rise / Coastal Flooding
As we saw in the last lesson, sea level is projected to rise more than a meter over the next century, and perhaps as much as five meters by 2300, given business-as-usual fossil fuel emissions. Scenarios such as 10 meters of sea level rise are not out of reach should, e.g., the west Antarctic ice sheet collapse more abruptly than is indicated by uncertain current model estimates.
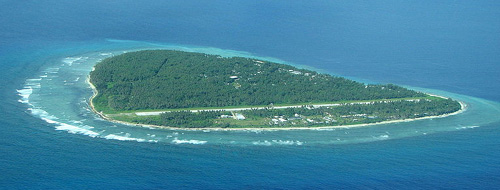
The impacts of rising sea level will be differentially felt by different nations and regions. For low-lying island nations like the Maldives, even the lower-end sea level rise scenarios represent a distinct threat. In fact, some island nations, such as Tuvalu, have already made contingency plans for evacuation in the decades ahead.
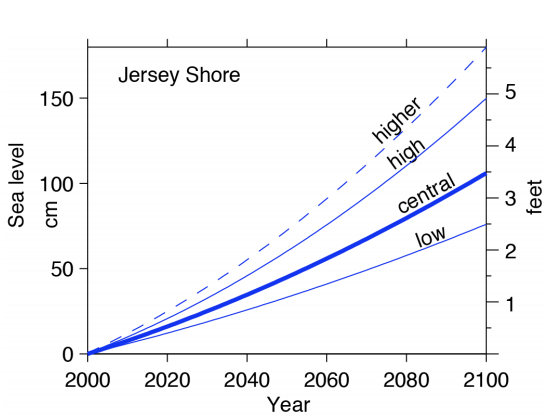
When asked about climate change impacts on Pennsylvania, I sometimes joke that Jersey Shore, PA may have nothing to fear from sea level rise directly, but all of those Pennsylvanians who make an annual summer pilgrimage to THE Jersey Shore would surely see the effects, as the beaches are increasingly eroded, and will ultimately be inundated.
Even moderate sea level rise (i.e., much less than a meter) can lead to significant increases in coastal erosion and other problems, such as salt water intrusion, wherein saline water penetrates increasingly inland through estuaries and tributaries, contaminating fresh water ecosystems and aquifers relied upon for fresh water supply.
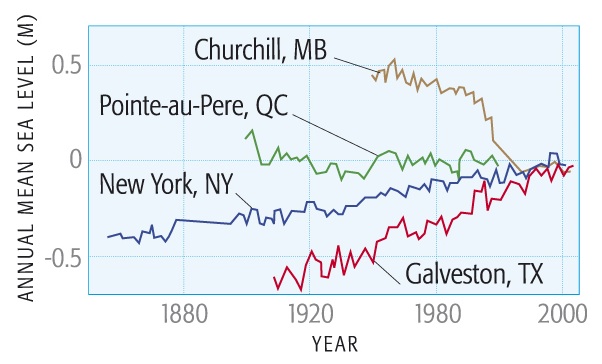
There is also a natural component to changes in sea level in North America. As the Laurentide Ice Sheet that once covered a large part of Northern North America melted at the end of the last Ice Age, the Earth's crust beneath it has slowly rebounded, which has led to ascending motion of the ground in the regions where the ice load was greatest, e.g., the region of the Hudson Bay, and subsiding motion farther away, e.g., the east coast and especially the Gulf Coast. This so-called isostatic adjustment adds a local sea level change component which adds to, or subtracts from, the overall change in global sea level (the so-called eustatic sea level component). This regional component can be comparable to the overall global sea level rise over the past century.
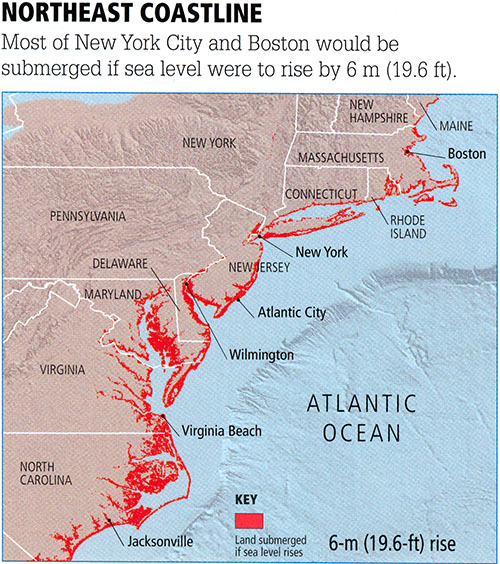
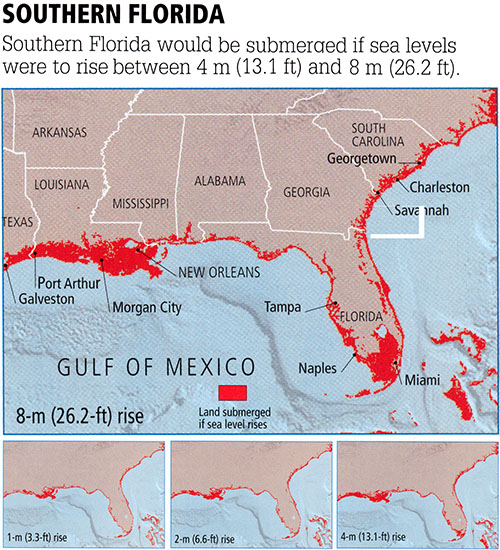
On the other hand, the local component is small compared to the 1 to 5 m sea level rise that is projected over the next one and two centuries under business-as-usual emissions. With 1 meter of sea level rise, we would see the disappearance of low-lying regions of the Gulf Coast, including the Florida Keys. At 5-6 meters of sea level rise we would see the loss of the southern 1/3rd of Florida and many of the major cities of the Gulf Coast and East Coast of the U.S. At 10 meters of sea level rise, New York City would be submerged.
© 2015 Pearson Education, Inc.
© 2015 Pearson Education, Inc.
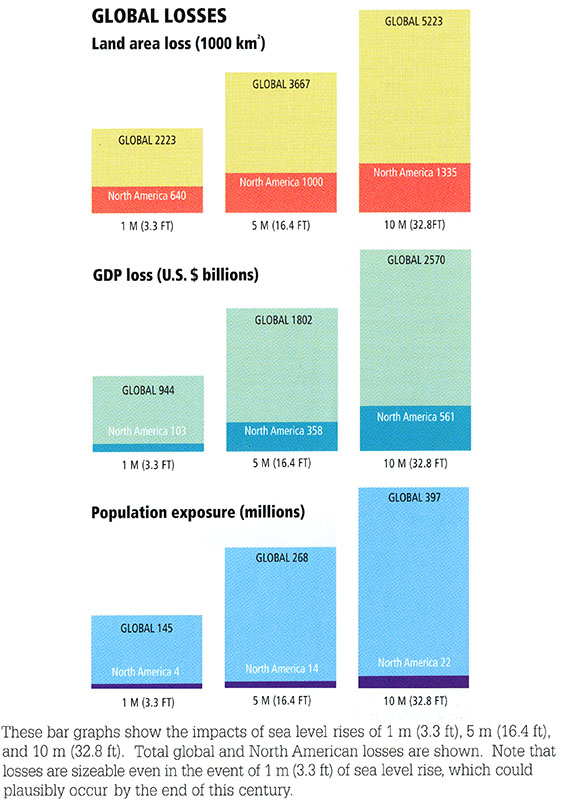
One can measure the costs of increasing levels of sea level rise in terms of (a) the loss of land area, (b) the damage to our economy as measured by gross domestic project (GDP), and (c) the increase in population impacted either directly (by inundation or increased erosion) or indirectly (by, e.g., by saltwater intrusion into fresh water supply). In the scenario of 10 meters of sea level rise, not entirely out of the question on a timescale of a few centuries, the global costs as measured by any of the above metrics are rather staggering: more than 5000 square km of coastal land lost, nearly three trillion dollars of GDP lost, and more than a third of a billion people exposed to direct or indirect impacts of sea level rise.
As we will see later in this lesson, for many coastal regions the costs will be compounded by the added impact of greater hurricane damage.
© 2015 Pearson Education, Inc.