
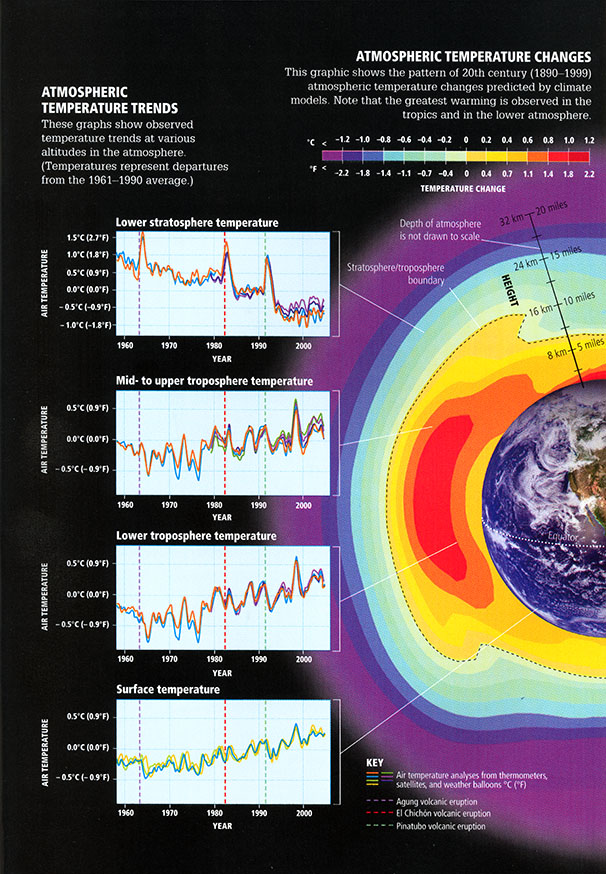
As alluded to previously, the vertical pattern of observed atmospheric temperature trends provides some important clues in establishing the underlying cause of the warming. While upper air temperature estimates (from weather balloons and satellite measurements) are only available for the latter half of the past century, they reveal a remarkable pattern. The lower part of the atmosphere — the troposphere, has been warming along with the surface. However, once we get into the stratosphere, the temperatures have actually been decreasing! As we will learn later when we focus on the problem of climate signal fingerprinting, certain forcings are consistent with such a vertical pattern of temperature changes, while other forcings are not.
© 2015 Pearson Education Inc.
Think About It!
Care to venture a guess as to which forcing might be most consistent with this vertical pattern of temperature change?
Click for answer.
We will later see why this explanation is consistent with the observed pattern of warming, while other explanations, such as natural changes in solar output, are not.