
There is perhaps no more impressive or—for that matter—deadly a weather phenomenon than tropical cyclones (and hurricanes—which are simply strong tropical cyclones).
We will focus, for the purpose of our discussion, on Atlantic tropical cyclones (TCs), as they are the best observed, providing records that go back more than a century (albeit with some uncertainties, particularly in earlier decades), and they are most relevant from the standpoint of North American impacts.
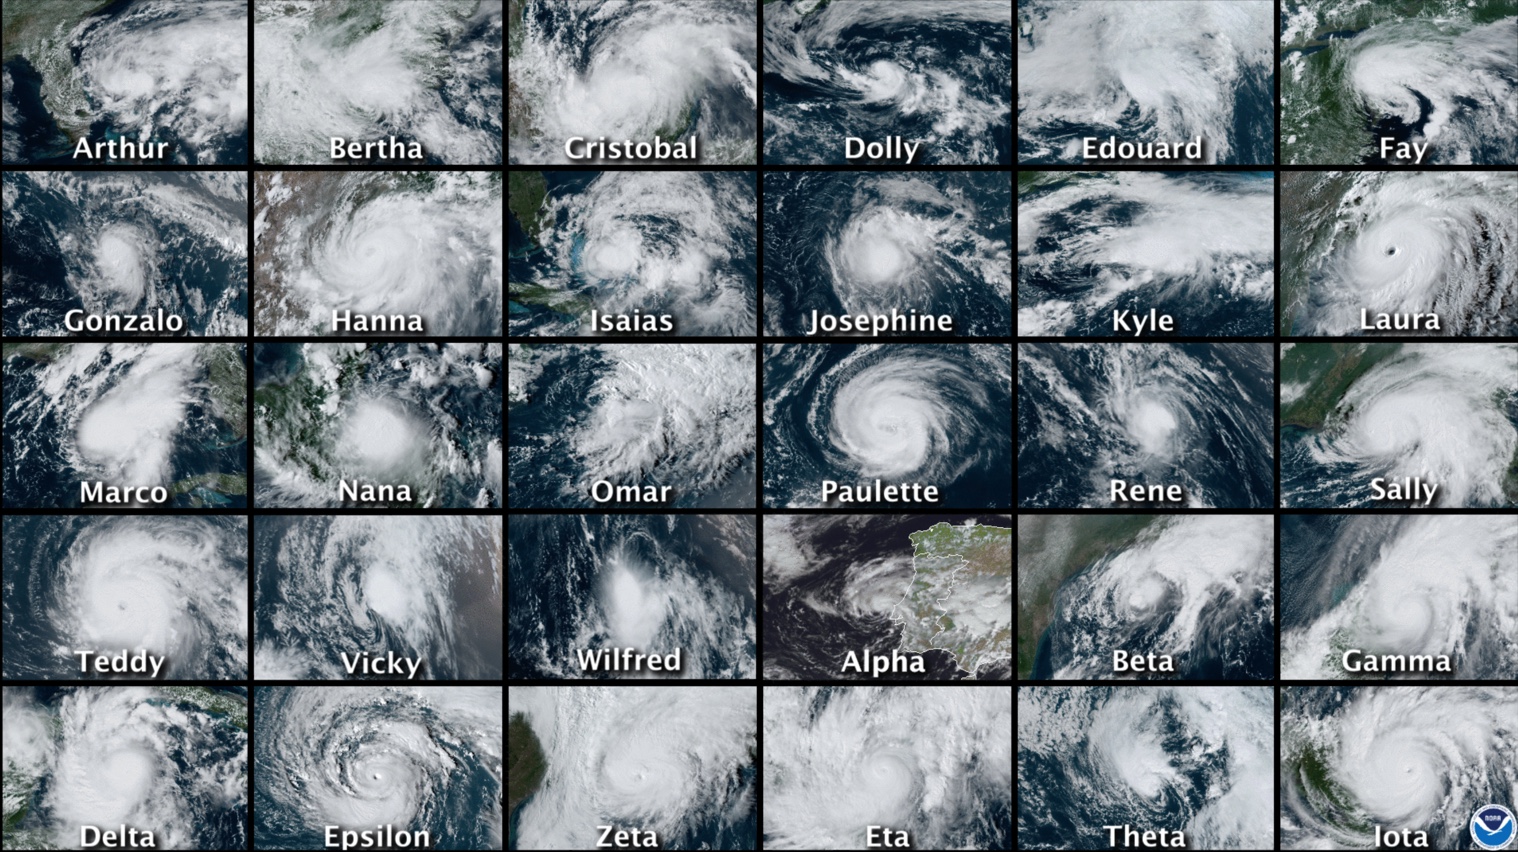
The 2020 Atlantic hurricane season was the most active ever, with a total of 30 TCs forming over the course of the Atlantic hurricane season (which formally runs from Jun 1-Nov 30, though storms sometimes occur outside this window).
One might well ask, is the apparent recent trend towards more destructive Atlantic hurricanes in some way tied to climate change? Well—as we will discuss in more detail in the next section on extreme weather—it is never possible to attribute any single weather event to climate change. But we can arguably see the impacts of climate change in the longer-term shifts in frequency and intensity of such events. In the case of Atlantic tropical cyclones & hurricanes, one convenient measure of activity is the net power dissipation, a measure that measures the energy dissipated by tropical cyclones & hurricanes as they interact with the ocean surface, averaged over the integrated lifetime of all storms during a particular season. Simple theoretical arguments developed by MIT hurricane expert Kerry Emanuel imply that this measure of hurricane activity should closely follow sea surface temperatures.
If we compare sea surface temperatures over the tropical Atlantic in the main development region (MDR) for tropical storms during the core of the hurricane season (August-October) to estimates of the power dissipation index, we do, indeed, find a very close relationship as far back as reliable records go (the mid 20th century). Indeed, the increase in powerfulness of storms in recent decades (the broader context for the unusually active 2005 season) does appear to be tied to the warming of Atlantic Ocean surface temperatures. Moreover, computer modeling studies aimed at detecting and attributing human impacts on climate (a topic discussed in later lectures) do indeed tie this warming to human causes. In this sense, it can be argued that human-caused climate change has played a role in the increased destructiveness of Atlantic hurricanes in recent years.
What about the number of Atlantic TCs, including the hyperactive 2005 season with its 28 named storms? Is this part of a longer-term trend? And if so, is that trend related to human influences on the climate? This question is still being actively debated within the scientific community. For one thing, there is some question about how reliable long-term records of TC counts are, particularly prior to the use of modern aircraft reconnaissance in the mid 1940s (if you're interested in the details, you can find a journal article about this topic by Michael Mann entitled Evidence for a modest undercount bias in early historical Atlantic tropical cyclone counts). Furthermore, while sea surface temperatures are one factor driving Atlantic tropical cyclone activity, there are other important factors as well. Even if sea surface temperatures are high—a favorable factor for development—other factors may mitigate tropical storm formation. High amounts of vertical wind shear, for example, are unfavorable for development. Such conditions typically prevail over the Caribbean during El Niño years, which are consequently unfavorable for Atlantic TC activity. La Niña years, by contrast, are favorable for Atlantic TC activity. Another climate pattern known as the North Atlantic Oscillation ('NAO'), which represents the year-to-year changes in the configuration of the jet stream over the North Atlantic, also has an influence on Atlantic TC activity. During years with a tendency for the negative phase of the NAO, when the Bermuda subtropical high pressure system is weaker than normal, storms are more likely to track through the tropical Atlantic and Caribbean where they encounter more favorable conditions for development. During positive NAO years, storms are more likely to track northward over colder extratropical Atlantic waters.
It is thus possible to relate year-to-year changes in Atlantic TC counts to three basic climate factors: (1) tropical Atlantic sea surface temperatures (SSTs) over the MDR during the August-October season, (2) ENSO, and (3) NAO. The long-term history of annual Atlantic TC counts, along with the time histories of factors (1)-(3) are shown below (for a, the red coloring indicates years with greater than average annual TC counts; for b-d, the red coloring indicates that the factor in question is more favorable than average for Atlantic TC activity. The Niño3.4 index is a time series that measures the state of ENSO where positive values indicate El Niño events and negative values indicate La Niña events.
There are a number of observations that can be made here. First of all, it is clear that annual TC counts have increased over time. How much we can conclude they have increased depends on the assumptions regarding how many TCs might have been missed in earlier decades, but even allowing for the upper-end estimates of undercounted past activity, the levels of activity over the past 15 years are without any modern-day precedent. It is also clear that this increase is coincident with increasing sea surface temperatures in the MDR. (Some researchers have argued that much of the long-term variability in temperatures is associated with the AMO mode discussed in the previous section; others, however, have argued that the long-term trends are mostly forced by a combination of human influences including greenhouse gases and sulphate aerosols. If you're interested in Michael Mann's work in this area, you can refer to the publication in the journal Eos entitled Atlantic Hurricane Trends Linked to Climate Change).
In the absence of other factors, we might assume that any continued warming of the tropical Atlantic in the future will lead to further increases. Yet, as alluded to earlier, there may be mitigating influences as well. We can, for example, see the mitigating impacts on annual TC counts of individual El Niño events if we look carefully at the respective time series shown above. Is it possible that a future trend towards a more El Niño-like climate could offset the effects of warming temperatures on Atlantic TC activity? We will revisit such questions in a later lecture on projected climate change impacts.
The historical relationship between annual TC counts and three climate factors identified above provide us with an ideal application of a new, somewhat more sophisticated statistical tool in our arsenal of methods for analyzing data. We will investigate the method of multivariate linear regression, a generalization of the OLS method investigated in our first problem set, which allows us to investigate a problem where there is more than one factor or 'predictor' (in our case, multiple climate factors such as MDR SST, El Niño, and the NAO) that appear to influence some target variable (in this case, annual TC counts) of interest. [note: Technically speaking, ordinary linear squares methods, including multivariate linear regression, are not strictly valid for discrete data, i.e., data such as storm counts that take on integer values, i.e., 0, 1, 2...rather than like, say, temperature, which takes on continuous values which better conform to a Gaussian distribution, as discussed in our previous lesson. Strictly speaking, a more sophisticated regression approach, known as Poisson Regression, is best used in such cases. However, it turns out that, as the counts become large, the assumption of continuous Gaussian behavior becomes increasingly valid. If we were looking at, say, the number of U.S. land falling major hurricanes, where numbers are quite small (typically at most a couple in any given year), that condition would not be met. But for looking at total named TCs, where the average value is about 10 per year, the Gaussian assumption is not too bad, and we can get away with applying standard regression methods.]
Later, you will perform a multivariate regression using these data in your next problem set, using the multivariate option in the online Regression Tool that you used in your previous problem set. In the meantime, however, we will use another example to explore how multivariate linear regression works...