
We saw earlier in the course that climate change already appears to have influenced the frequency and intensity of various types of extreme weather events. The observed warming so far amounts to less than a 1°C relative to pre-industrial time. Given projected warming of several more degrees C over the next century (depending on the precise emissions scenario), the future increases in extreme weather events can be expected to be far larger than what we have observed thus far.
A large increase in the incidence of extreme precipitation events is expected. As we know, warmer oceans evaporate water into the atmosphere at a faster rate, and a warmer atmosphere can hold more water vapor. These features imply a more vigorous hydrological cycle, and heavier individual events when conditions are conducive to precipitation. Basic atmospheric physics tells us that 1°C warming we have seen already implies roughly 2% higher concentration of water vapor in the atmosphere on average, and correspondingly, roughly 2% more precipitable water during any particular precipitation event. Depending on the particular emissions scenario, we can expect a several fold larger increase over the next century. Since flooding is associated with large accumulations of rainfall over short periods of time, this increase in precipitation intensity implies greater potential for flood conditions—ironically, even for regions that on average see greater drought, i.e., more dry days (something we alluded in our discussion of general precipitation trends in the previous lesson).
Where atmospheric temperatures are above freezing, we expect precipitation to fall as rain, but where temperatures are below freezing, we expect it to fall as snow. Climate change deniers often claim that heavy winter snowfalls argue against the reality of global warming. Nothing could be further from the truth, however. In any realistic scenario of the next century, we will still have winter. It will still be cold enough for snow over large parts of North America in winter, and as the atmosphere continues to warm and hold more water vapor, we expect those snowfalls to be heavier. In fact, there is a bit of a double whammy involved here: we also know that mid-latitude winter storms will likely become more intense—something we already see evidence of in meteorological observations. These more intense storms will be associated with stronger frontal boundaries, further increasing the potential for large snowfalls.
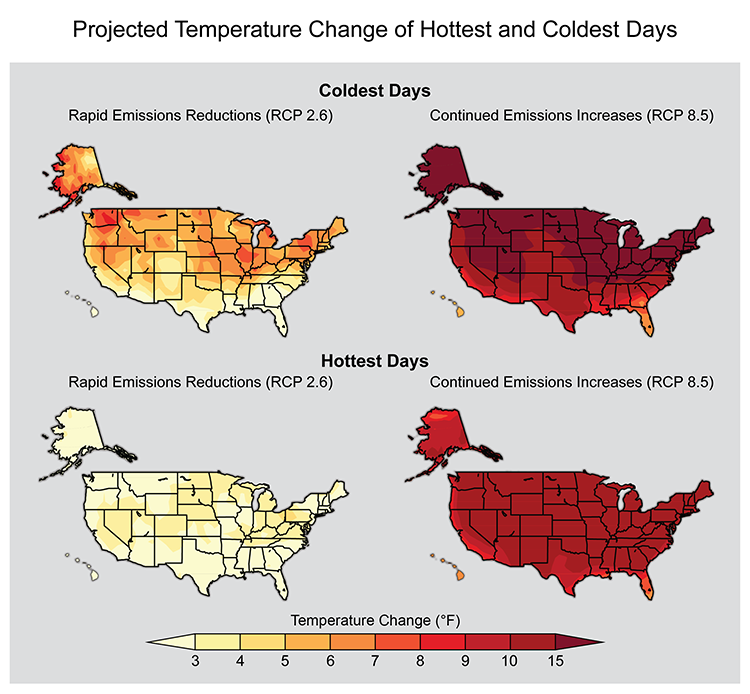
Profound changes are, of course, also expected in temperature extremes. Heat waves, which, as we saw earlier in the course, have already increased in duration and intensity owing to the warming of the past century, are projected to be subject to further increases over the next century, with the details depending, of course, on the emissions pathway. Not surprisingly, extreme cold days are projected to decrease in number.
In our original discussion of extreme weather in Lesson 3, we likened the incidence of extreme weather to the rolling of a die. Sixes come up relatively rarely in the roll of a fair die (1 in 6 rolls to be precise). Let us think of an unusually warm summer day (say, a 90F day in State College PA in July) as a rolling of a six. We have seen that the incidence of extreme warm days in the U.S. has roughly doubled since the mid 20th century. Think of that as a doubling of the probability of rolling a six. You got a sense for how apparent such a change in the odds might be in the day-to-day weather variations by playing a game where you compared a fair die and one that had been loaded to double the probability of sixes. It took a fair number of rolls in that case—perhaps as many as 10 or so—to be pretty confident from the pattern of rolls as to which one was the loaded die. Now, we will double the probability once more—so there is now a four-fold increase in the likelihood of rolling a six in the loaded die relative to a fair die. Using the updated version of the dice rolling application below, see how many rolls of the die it takes you now to figure out which one is loaded and which one is fair. What does this tell you about the degree to which the "loading of the die" will become more apparent in observations of extreme weather as time goes on?
Be prepared to discuss your observations in this week's discussion.