
Basics of Energy Balance and the Greenhouse Effect
An interactive animation provided below allows you to explore the balance of incoming and outgoing sources of energy within the climate system. A brief tutorial is provided below, first with the short wave component and then the long wave component of the energy budget. (Click image or link below to play the video.)
Video: Short Wave Components of the Energy Budget (2:15)
PRESENTER: OK, well, let's first look at the short wave part of the radiation budget. We start out with 100 parts of solar energy. Let's see what happens to those 100 parts within the atmosphere and the Earth's surface.
Well, 21% is reflected back out to space from cloud tops, 7% is back scattered by the atmosphere back out to space, and 3% is reflected from the Earth's surface. So if we add those up-- 21 plus 3, 24, plus 7-- 31 parts of that initial 100 unit of solar energy are reflected out to space, and that's what gives us Earth's albedo of roughly 31% or an albedo of 0.31.
OK, well, that leaves behind 69 parts of solar energy. So let's see what happens to those 69 parts.
3% are absorbed within the stratosphere by ozone, 18% is absorbed by the rest of the atmosphere or by dust, and then 3% is absorbed by clouds. So if we add that together, that's 18 plus 3, 21, plus 3, that's 24. 24 parts are absorbed somewhere within the atmosphere.
So that's 69 that weren't reflected to space. Of those 69, 24 are absorbed. That leaves behind now 45.
What happened to those remaining 45 unit of solar energy? Well, 25 are directly absorbed by the Earth's surface, and nearly as much, 20%, is actually diffuse radiation that scattered towards the surface.
The reason that we look up into the atmosphere and we see blue sky is because of the preferential scattering of the atmosphere in the wavelengths that correspond to blue light. And that's that 20% of diffuse radiation.
So that's the short wave budget of the atmosphere radiation budget.
Video: Long Wave Components of the Energy Budget (4:10)
[Please note that there is a slight error in the spoken part of the "Long Wave" video above, beginning around 3:17. While adding up the components of the long wave energy emitted by the atmosphere to space, which total 66 units, the narrator neglects to add in 8 units of direct heat loss to space.]
PRESENTER: OK, now we're going to look at the long wave component of the radiation budget, and we'll start at the surface.
Now we know that 45 parts of that initial solar energy, the initial short wave radiation, were absorbed at the surface, either from direct sunlight reaching the surface or diffuse radiation reaching the surface. So 45 were received by the surface. That means there are 45 parts of energy that need to leave the surface, and they do that in a number of different forms.
19 parts are released to the atmosphere through the transfer of latent heat, water evaporating from the surface, rising up in the atmosphere where it eventually condenses to form raindrops or cloud droplets. That delivers 19 parts of energy up into the atmosphere.
4 parts of energy are delivered up into the atmosphere through convective motions, through large scale wind patterns, storms, atmospheric disturbances that transport heat up into the atmosphere.
Now 110 parts leaves the surface as infrared radiation, as long wave radiation, emitted from the surface, but doesn't make it out to space because it's actually absorbed by greenhouse gases in the atmosphere.
Now of that 110, 96 are then emitted by those greenhouse gases back towards the surface, and 14 are emitted out to space. So that's a net gain-- it's a loss of 110, a gain of 96. So a net loss of only 14 parts.
Now 8 parts make it all the way out to space in the form of long wave radiation emitted from our surface. So we've got 14 plus 8, that's 22, plus 4, that's 26, plus 19, that's 45. That accounts for all 45 parts.
All right, well, let's see what happened up in the atmosphere. 19 parts of energy we said were delivered up into the atmosphere by latent heating, 4%-- 4 parts-- by convective heat transport from the surface and lower atmosphere, and a net gain of 14 parts of infrared radiation, and, of course, 8 parts were emitted all the way out to space.
So we've got 14 parts of infrared radiation that have been absorbed by the atmosphere, 23 that were gained from latent and convective heat transfer. And remember, we had 21 parts that were initially absorbed by the atmosphere-- 21 parts of the initial solar energy absorbed by the atmosphere or by clouds. 18 plus 3 gave us 21.
So we've now got 21 plus 23 plus 14. That gives us 66. So those 66 parts of energy that are absorbed by the atmosphere need to be admitted back out to space in the form of infrared radiation, and they are.
Add in the 3% that is emitted by ozone within the stratosphere, and that gives a 69-- the original 69 parts of solar energy that we started with that weren't reflected out to space. And so that completes our discussion of the global energy and radiation budget.
Now explore the two animations more carefully. It takes some time to absorb all of the information that is contained the animations. Return to the short wave energy budget animation and watch it again. Once you are satisfied that you understand the short wave energy information, go on to the somewhat more complex long wave energy budget animation and watch it until you understand all of the long wave energy information.
Consider how incoming and outcoming energy sources of shortwave and longwave radiation achieve a net balance:
- At the surface
- Within the atmosphere
- At the top of the atmosphere
In future lessons, we will examine the greenhouse effect in a more quantitative manner. Note here how the greenhouse effect works qualitatively. It involves the ability of greenhouse gases within the atmosphere to absorb longwave radiation, impeding the escape of the longwave radiation emitted from the surface to outer space.
In our first discussion session at the end of this lesson, you will be asked to speculate on certain aspects of this schematic, and to pose some questions of your own for your classmates to attempt to answer.
Seasonal and Latitudinal Dependence of Energy Balance
Next, let us note that the above picture represents average climate conditions, that is, averaged over the entire Earth's surface, and averaged over time. However, in reality, the incoming distribution of radiation varies in both space and time. We measure the radiation in terms of power (energy per unit time) per unit area, a quantity we term intensity or energy flux, which can be measured in watts per square meter (W/m2).
The dominant spatial variation occurs with latitude. On average, there is roughly 343 W/m2 of incoming shortwave solar radiation that is incident on the Earth, averaged over time, and over the Earth surface area. Obviously, there is more incoming solar radiation arriving at the surface near the equator than near the poles. On average, roughly 30%, or about 100 W/m2 of this incident radiation is reflected out to space by clouds and reflective surfaces of the Earth, such as ice and desert sand, leaving roughly 70% of the incoming solar radiation to be absorbed by the Earth's surface. The portion that is reflected by clouds and by the surface also varies substantially with latitude, owing to the latitudinal variations in cloud and ice cover:
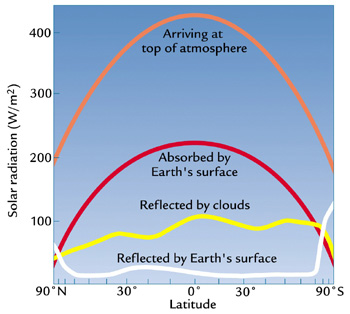
| Radiation (W/m 2) | 90ºn | 0º | 90ºs |
|---|---|---|---|
| ARRIVING AT THE TOP OF THE EARTH'S ATMOSPHERE | 200 | 420 | 190 |
| ABSORBED BYEARTH'S SURFACE | 95 | 210 | 93 |
| RELECTED BY cLOUDS | 95 | 100 | 95 |
| REFLECTED BY THE EARTH'S SURFACE | 97 | 91 | 110 |
Moreover, the distribution of outgoing longwave radiation also varies substantially with latitude:
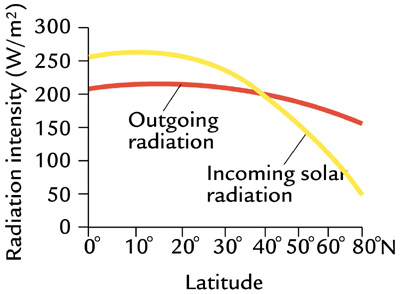
More terrestrial radiation is emitted from the warmer tropical regions and less emitted from the cold polar regions:
The disparity shown above (Figure 1.8) between the incoming solar radiation that is absorbed at the surface and the outgoing terrestrial radiation emitted from the surface poses a conundrum. As we can see in Figure 1.8, outgoing radiation exceeds incoming radiation near the poles, i.e., there is a deficit of radiation at the surface. Conversely, there is a surplus of incoming radiation near the equator. Should the poles, therefore, continue to cool down and the tropics continue to warm up over time?
Think About It!
Any idea what the solution to this conundrum might be?
Click for answer.
We will explore the details of how this is accomplished a bit later...
It is also worth noting that the incoming solar radiation is not constant in time. As we will see in later lessons, the output of the Sun, the so-called solar constant, can vary by small amounts on timescales of decades and longer. During the Earth's early evolution, billions of year ago, the Sun was probably about 30% less bright than it is today--indeed, explaining how the Earth's climate could have been warm enough to support life back then remains somewhat of a challenge, known as the "Faint Young Sun" paradox, although our understanding of it is improving.
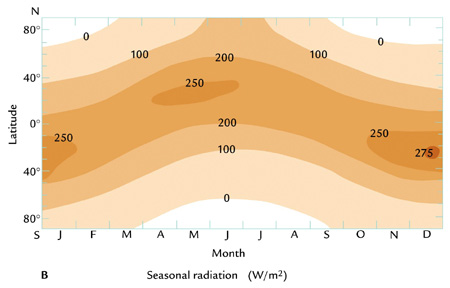
Even more dramatic changes in solar insolation take place on shorter timescales—the diurnal and annual timescale. These changes, however, do not have to do with the net output of the Sun, but rather the distribution of solar insolation over the Earth's surface. This distribution is influenced by the Earth's daily rotation about its axis, which of course leads to night and day, and the annual orbit of the Earth about the Sun, which leads to our seasons. While there is a small component of the seasonality associated with changes in the Earth-Sun distance during the course of the Earth's annual orbit about the Sun (because of the slightly elliptical nature of the orbit), the primary reason for the seasons is the tilt of Earth's rotation axis relative to the plane defined by the Earth and the Sun, which causes the Northern Hemisphere and Southern Hemisphere to be preferentially oriented either towards or away from the Sun, depending on the time of year.
Check it out for yourself with this animation (1:49):
The consequence of all of this, is that amount of shortwave radiation received from the Sun at the top of the Earth's atmosphere varies as a function of both time of day and season:
Subtle changes in the Earth's orbital geometry (i.e., changes in the tilt of the axis, the degree of ellipticality of the orbit, and the slow precession of the orbit) are responsible for the coming and going of the ice ages over tens of thousands of years. We will revisit this topic later in the course.