By far, the most critical issue regarding climate change impacts on ocean circulation patterns involves the thermohaline/conveyor belt /meridional overturning circulation, which we discussed earlier in the course (e.g., Ocean Circulation page of Lesson 1 and the Oceans page of Lesson 3). As we discussed earlier, it was once thought that global warming could paradoxically lead to cooling over a wide region of the globe by sending large amounts of fresh water into the high-latitudes of the North Atlantic, where it would freshen the surface waters and inhibit the formation of dense surface waters whose sinking in the subpolar North Atlantic constitutes the descending limb of the conveyor belt circulation. Since this ocean current system is a substantial contributor to the transport of heat to the high latitudes of the North Atlantic, such an occurrence could lead to widespread cooling of the North Atlantic and neighboring continental regions. Indeed, scientists believe this happened during the Younger Dryas event toward the end of the last ice age, between 13,000 and 12,000 years ago as the climate was warming during the initial phase of deglaciation.
Of course, as noted during our earlier discussion of the Younger Dryas event, the two situations are quite different in many respects. Toward the end of the last ice age, there was much ice to melt, and far greater potential to flood the North Atlantic with extremely large amounts of fresh water. Today, however, the ice sheets are much diminished, and there is less snow and ice available to melt. Nonetheless, certain simple climate models, such as the CLIMBER model used by the Potsdam Institute for Climate Change Impacts, suggest that global warming could lead to a substantial weakening of the thermohaline circulation and a fairly dramatic cooling of the North Atlantic and neighboring regions.
We have seen that current state-of-the-art climate models show only a weak semblance of this effect, however. Earlier in this lesson, we saw that the GFDL CM2.1 coupled model produces a very moderate cooling over a small region of the North Atlantic in response to anthropogenic warming, in part due to a slight weakening of the thermohaline circulation due to the mechanisms discussed before.
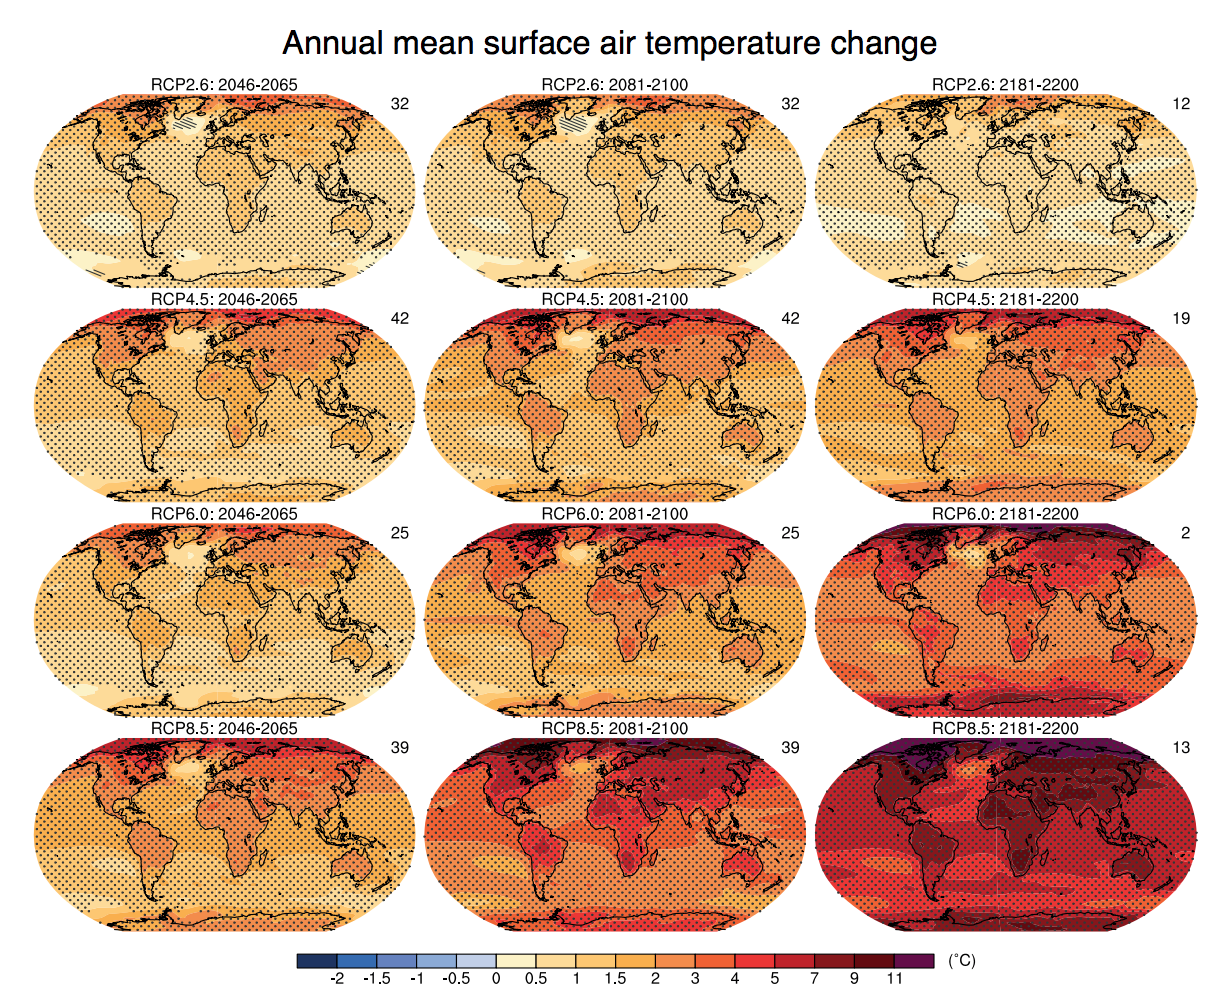
In fact, this model exhibits a larger response than most of the models used in the two most recent IPCC assessments. If we look at the average pattern of surface temperature change over the next century in the all of the RCP scenarios, averaged over all 20+ models, we see only the vaguest hint of the effect. Nowhere in the North Atlantic do we see any cooling. Instead, we see a small region in the North Atlantic, south of Greenland and Iceland, where there is less warming than in most other regions. Western Europe also sees somewhat less warming than most other regions due to the downstream effects. So if we take the composite response of the IPCC models as our best current assessment, we are led to conclude that the very, very small grain of truth to the Day After Tomorrow scenario, is that global warming may lead to a bit less warming in some parts of the North Atlantic and neighboring regions, owing to a slowing of the oceanic thermohaline circulation.
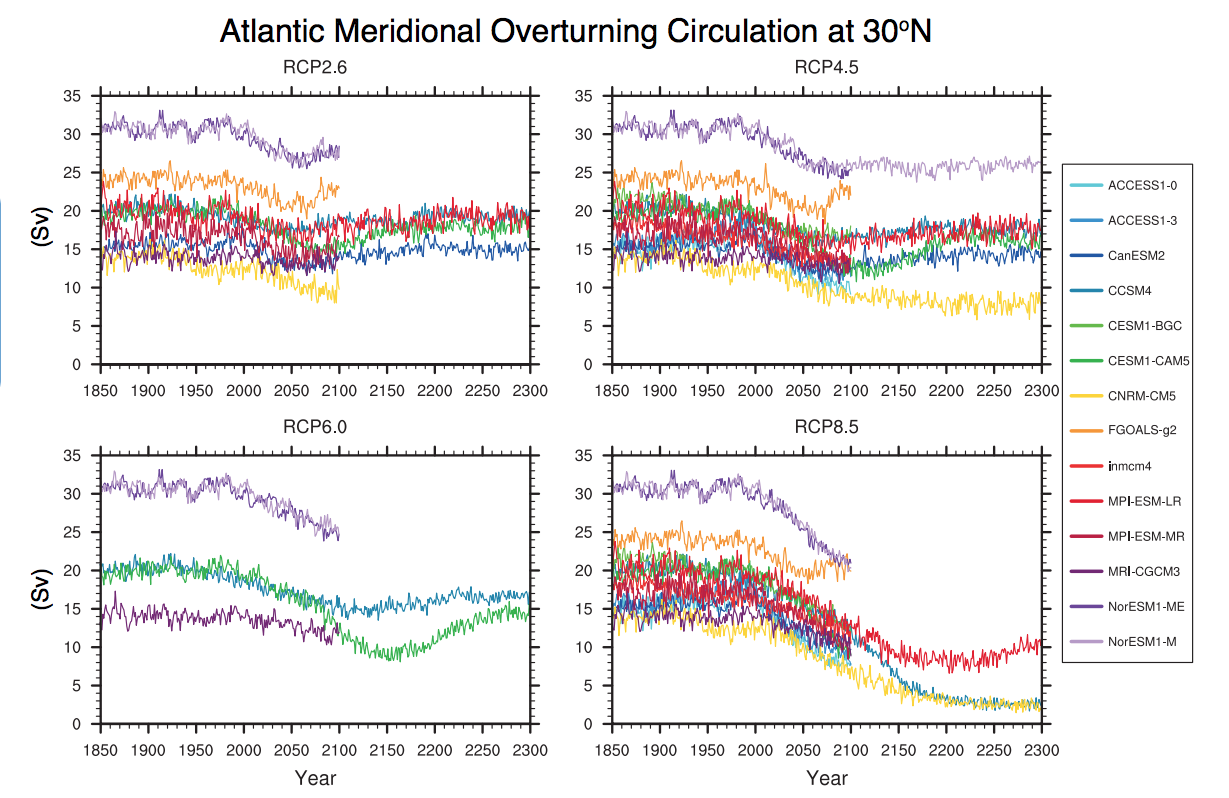
If we look at a more direct measure of the thermohaline circulation in the models, namely the intensity of the northward current associated with the meridional overturning component of the ocean circulation and thermohaline circulation, we see that in very few models does it actually collapse. In some models, it does weaken substantially, but in most models, it weakens only very modestly; and in some models, it marches along at near its current intensity, as if nothing happened at all! Why is this? More elaborate climate models, which contain detailed three-dimensional representations of ocean components that finely resolve boundary currents and even the eddies in these currents, tend to show far more robustness of the MOC than the simpler models, which ignore lateral ocean currents, eddies, etc. The state-of-the-art models have more degrees of freedom, i.e., more ways to circulate and transport water, heat, and salinity, and it is, therefore, much harder to cut off the poleward transport of heat by the ocean circulation, as there are multiple components of the oceanic circulation that can deliver heat poleward. These models typically, for related reasons, have a far more stable thermohaline circulation than simpler, earlier ocean models.