
As we have seen earlier, emissions arising from industrial processes, e.g., steel, cement, oil refineries, and paper productions, constitute the 2nd greatest among all sectors, accounting for nearly 20% of all anthropogenic carbon emissions.
As with emissions from coal burning for power, industrial carbon emissions are often from large point sources (i.e., factories), and CCS technology is potentially available as a mitigation option. This means that market-based decisions on emissions reductions are able to consider both the cost of CCS implementation and the cost of paying for emitted carbon (i.e., carbon tax or costs of emissions permits, depending on what scheme for pricing carbon is in place). Estimates of the mitigation potential in the various industrial sub-sectors therefore involve both options.
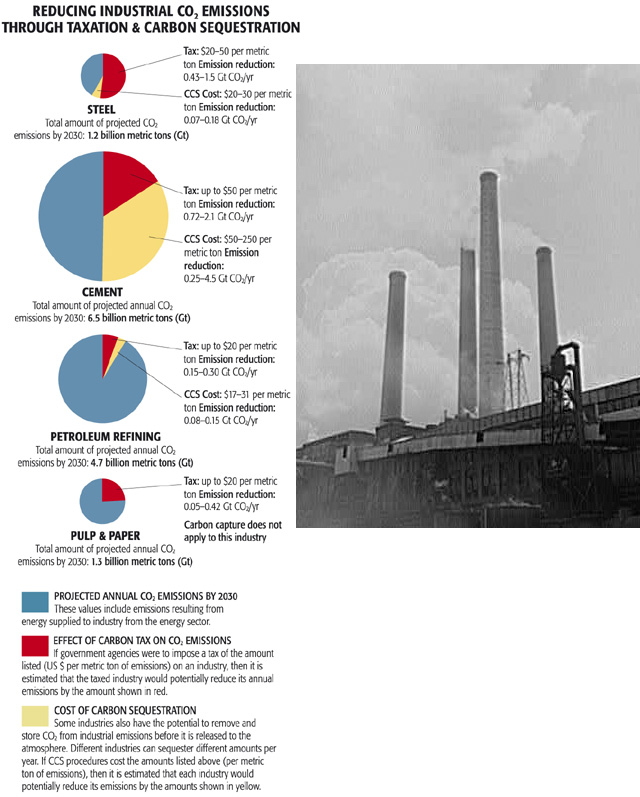
- Red = EFFECT OF CARBON TAX ON CO2 EMISSIONS: If government agencies were to impose a tax of the amount listed (US $ per metric ton of emissions) on an industry, then it is estimated that the taxed industry would potentially reduce its annual emissions by the amount shown in red.
- Blue = PROJECTED ANNUAL CO2 EMISSIONS BY 2030: These values include emissions resulting from energy supplied to industry from the energy sector.
- Yellow = COST OF CARBON SEQUESTRATION: Some industries also have the potential to remove and store CO2 from industrial emissions before it is released to the atmosphere. Different industries can sequester different amounts per year. If CCS procedures cost the amounts listed about (per metric ton of emissions), then it is estimated that each industry would potentially reduce its emissions by the amounts shown in yellow.
The four pie charts are as follows:
- STEEL: Total amount of projected CO2 emissions by 2030: 1.2 billion metric tons (Gt)
- red (a little over 50%) - Tax: $20-50 per metric ton; Emission reduction: 0.43-1.5 Gt CO2/yr
- yellow (about 5%) - CCS Cost: $20-30 per metric ton; Emission reduction: 0.07-0.18 Gt CO2/yr
- blue (about 45%)
- CEMENT: Total amount of projected CO2 emissions by 2030: 6.5 billion metric tons (Gt)
- red (about 17%) - Tax: up to $50 per metric ton; Emission reduction: 0.72-2.1 Gt CO2/yr
- yellow (about 33%) - CCS Cost: $50-250 per metric ton; Emission reduction: 0.25-4.5 Gt CO2/yr
- blue (about 50%)
- PETROLEUM REFINING: Total amount of projected CO2 emissions by 2030: 4.7 billion metric tons (Gt)
- red (about 3%) - Tax: up to $20 per metric ton; Emission reduction: 0.15-0.30 Gt CO2/yr
- yellow (about 2%) - CCS Cost: $17-31 per metric ton; Emission reduction: 0.08-0.15 Gt CO2/yr
- blue (about 95%)
- PULP & PAPER: Total amount of projected CO2 emissions by 2030: 1.3 billion metric tons (Gt)
- red (a little over 23%) - Tax: up to $20 per metric ton; Emission reduction: 0.05-0.42 Gt CO2/yr
- yellow (0%) - Carbon Capture does not apply to this industry
- blue (about 77%)
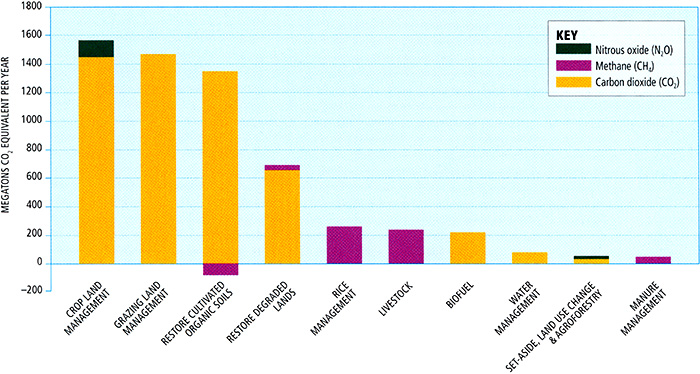
The potential for mitigation in the agricultural sector is often given less attention than that in, e.g., the transport sector, even though the two sectors are responsible for nearly equal contributions to global carbon emissions (in fact, agricultural emissions are roughly 0.5% greater!). While agricultural emissions are largely due to methane production from, e.g., rice cultivation and methane-producing livestock, such as beef cattle and dairy cows, interestingly enough, the primary opportunities for greenhouse gas emissions reductions in the agricultural sector actually involve CO2. This is because of the large amount of land globally used for agriculture or livestock pastures. This land has typically been degraded by these uses (i.e., vegetation has been destroyed and soil has been depleted of key nutrients) so that it cannot absorb and sequester atmospheric CO2 efficiently, in contrast with natural vegetated land. Because of this, the primary opportunities for mitigation of carbon emissions in the agricultural sector involve restoring degraded pasture and farm lands. There are other mitigation opportunities, however. One scheme that is being seriously considered involves changing the diet fed to ruminants to decrease their methane emissions. More efficient use of fertilizers can also potentially reduce agricultural emissions of nitrous oxide (not carbon dioxide, but a greenhouse gas, nonetheless). Another scheme involves improving the methods for rice cultivation, which could lead to both fewer emissions and more productive yields.
© 2015 Pearson Education, Inc.
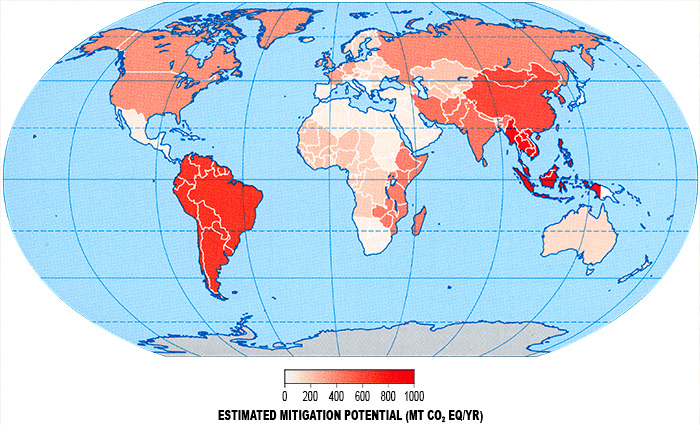
All of the major continents of the world contribute to agricultural carbon emissions today. As nations of South America, Asia, and Indonesia struggle, however, to feed increasingly large populations in the decades ahead, opportunities for carbon emissions mitigation will be greatest in these regions.
© 2015 Pearson Education, Inc.
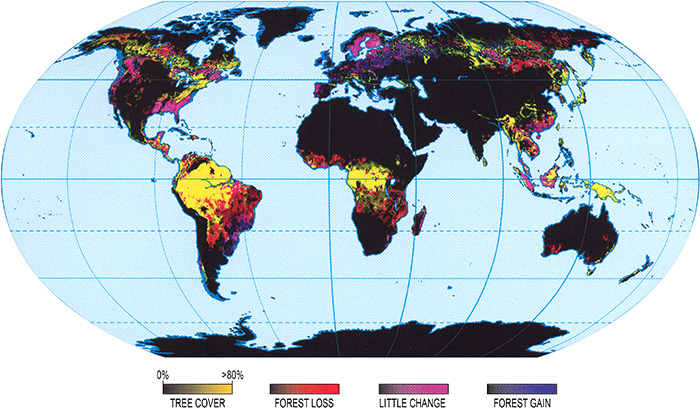
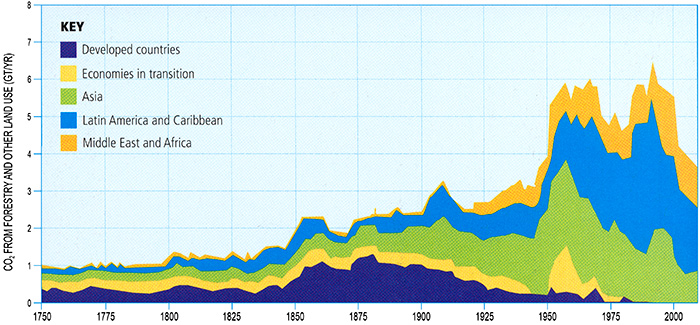
Let us finally talk about emissions in the forestry sector. Deforestation, as we know, is a major source of carbon emissions, larger than either transportation or agricultural, and the 3rd largest among all sectors, with only energy and industry responsible for greater emissions. So, clearly, the forestry sector has to be on the table if we are looking to mitigate global greenhouse emissions.
Reforestation would seem like an obvious strategy for mitigation in this sector. Unfortunately, reforestation faces some uphill challenges. The process of deforestation actually renders the land greatly degraded and largely stripped of key nutrients (these nutrients, after all, were taken up by the trees which have since been harvested). This makes it more difficult to grow trees on those lands. Since tree root systems and forest canopies are the main features that allow forests to retain water, deforested land has also lost much of its potential to store water and tends to dry out. Combined with a tendency for drying continents as a result of climate change, reforestation faces a serious battle. Indeed, forests are projected by climate models to transition from a net sink of carbon (which they are today) to a net source of carbon, constituting yet another potential positive carbon cycle feedback.
© 2015 Pearson Education, Inc.
© 2015 Pearson Education, Inc.