22. UTM Zone Characteristics
The illustration in Figure 2.23.1, below, depicts the area covered by a single UTM coordinate system grid zone. Each UTM zone spans 6° of longitude, from 84° North and 80° South. Zones taper from 666,000 meters in "width" at the Equator (where 1° of longitude is about 111 kilometers in length) to only about 70,000 meters at 84° North and about 116,000 meters at 80° South. Polar areas are covered by polar coordinate systems. Each UTM zone is subdivided along the equator into two halves, north and south.
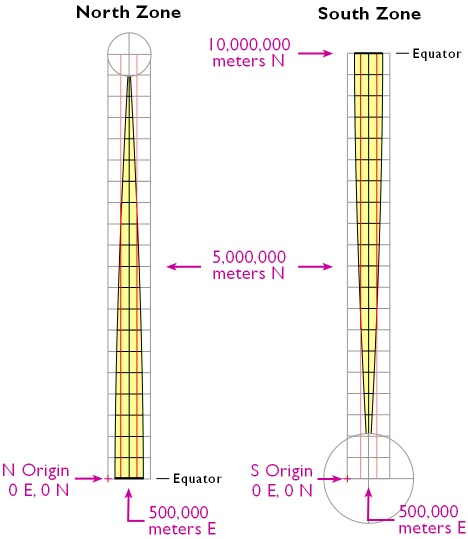
The illustration below in Figure 2.23.2 shows how UTM coordinate grids relate to the area of coverage illustrated above in Figure 2.23.1. The north and south halves are shown side by side for comparison. Each half is assigned its own origin. The north south zone origins are positioned to south and west of the zone. North zone origins are positioned on the Equator, 500,000 meters west of the central meridian. Origins are positioned so that every coordinate value within every zone is a positive number. This minimizes the chance of errors in distance and area calculations. By definition, both origins are located 500,000 meters west of the central meridian of the zone (in other words, the easting of the central meridian is always 500,000 meters E). These are considered "false" origins since they are located outside the zones to which they refer. UTM eastings range from 167,000 meters to 833,000 meters at the equator. These ranges narrow toward the poles. Northings range from 0 meters to nearly 9,400,000 in North zones and from just over 1,000,000 meters to 10,000,000 meters in South zones. Note that positions at latitudes higher than 84° North and 80° South are defined in Polar Stereographic coordinate systems that supplement the UTM system.
See the Bibliography (last page of the chapter) for further readings about the UTM grid system.