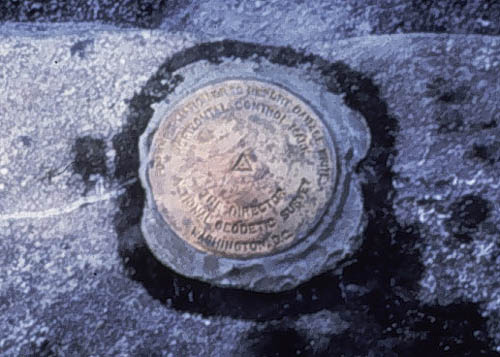
Geoids, ellipsoids, and even coordinate systems are all abstractions. The fact that "horizontal datum" refers to a relationship between an ellipsoid and a coordinate system, two abstractions, may explain why the concept is so frequently misunderstood. Datums do have physical manifestations, however.
Shown above (Figure 2.16.1) is one of the approximately two million horizontal and vertical control points that have been established in the U.S. Although control point markers are fixed, the coordinates that specify their locations are liable to change. The U.S. National Geodetic Survey maintains a database of the coordinate specifications of these control points, including historical locations as well as more recent adjustments. One occasion for adjusting control point coordinates is when new horizontal datums are adopted. Since every coordinate system grid is aligned with an ellipsoid that approximates the Earth's shape, coordinate grids necessarily shift when one ellipsoid is replaced by another. When coordinate system grids shift, the coordinates associated with fixed control points need to be adjusted. How we account for the Earth's shape makes a difference in how we specify locations.
Try This!
Here's a chance to calculate how much the coordinates of a control point change in response to an adjustment from North American Datum of 1927 (based on the Clarke 1866 ellipsoid) to the North American Datum of 1983 (based upon the GRS 80 ellipsoid).
- Find the geographic coordinates of a populated place
- Start at the USGS' Geographic Names Information System at the U.S. Board on Geographic Names.
- Follow the links labeled Domestic Names, then Search to search place names included in the Geographic Names Information System.
- At the Query Form, enter the name of your home town (or other named geographic feature) in the Feature Name field, as well as your home State. Choose Populated Place (or other, as appropriate) for the Feature Class.
- If your home is somewhere other than the U.S., enter a place name of interest or fantasy destination (e.g., "Las Vegas" ;-) ).
- Click Send Query.
- The result should include latitude and longitude coordinates of a centroid that represents where the name your town (or other feature) would appear on a map. You'll need those coordinates for the next step.
- Find the geographic coordinates of a nearby horizontal control point
- Visit the U.S. National Geodetic Survey home page.
- Follow the link labeled Survey Mark Datasheets.
- At the NGS Datasheet page, follow the link labeled Datasheets.
- You may wish to begin with the "Info Link" labeled "Tell me more about datasheets."
- At the NGS Datasheet Retrieval page, follow the link labeled Radial Search. (You're welcome to experiment with another retrieval method if you wish.)
- At the NGS Datasheet Point Radius form:
- Enter the latitude and longitude coordinates you looked up in step #1. Pay attention to the input format.
- Specify a Search Radius.
- Select Any Horz. and/or Vert. Control from the Data Type Desired scrolling field.
- Select Any Stability from the Stability Desired scrolling field.
- Click Submit.
- The result should be a Station List Results form that looks like the contents of the window pictured below. These are the results of my search on the centroid coordinates for State College PA. Note that I have highlighted the station that is both nearest to the coordinates I entered and a first-order control point (see the "1" under the column labeled "H"?)
 Figure 2.16.2 Station List ResultsCredit: noaa.gov
 - Select the station nearest to the coordinates you specified that is also the highest-order horizontal control point.
- Click Get Datasheets. The system should respond with a station datasheet like this example.
- In the example linked above, the CURRENT SURVEY CONTROL of the station point is listed as NAD 83(1992) 40 48 13.83840(N) 077 51 44.25410(W) ADJUSTED. These are the geographic coordinates of the control point relative to the NAD 83 horizontal datum. In the next step, we'll see how much the control point "moved" as a result of the adjustment of those coordinates from the earlier NAD 27 datum. (The geographic coordinates of the control point are specified to 100,000th of a second precision, or approximately 0.3 mm of longitude. Keep in mind, however, the difference between precision and accuracy; the trailing 0 suggests that the accuracy is an order of magnitude less than the precision.)
- Calculate the datum shift associated with a conversion from one horizontal datum to another
- Return to the U.S. National Geodetic Survey home page.
- Follow the link labeled geodetic tool kit.
- At the NGS Geodetic Tool Kit page, follow the link labeled NADCON (you'll be taken to an explanatory page, where you'll need to click NADCON again to proceed to the utility).
- At the North American Datum Conversion Utility page, read the introductory paragraphs.
- At the NADCON computations form, under the heading compute a datum shift for a specific location:
- Select direction of conversion: NAD 83 to NAD27.
- Enter the NAD 83 latitude and longitude coordinates of your control station. Pay attention to format.
- Click Compute Datum Shift for a Single Location.
- The result should be a NADCON Output report like this example. In the State College example, the adjustment from NAD 83 to NAD 27 (associated with the replacement of the old Clarke 1866 ellipsoid by the Earth-centered GRS 80 ellipsoid) caused the geographic coordinate system grid to shift nearly 7 meters South and over 23 meters West. That grid shift is reflected in the adjustment of the coordinates that specify the control point's location. Note that the point didn't move, rather, the grid shifted. How much shift occurred at your location?