Geostatistics has been well developed to quantitatively describe the characteristics of spatial physical heterogeneities, especially conductivity / permeability, in the natural subsurface. Here we briefly introduce a few geostatistical measures. Interested readers are referred to geostatistical books and software tools for more detailed information (Deutsch and Journel, 1992; Remy and Wu., 2009).
Mean of permeability
It measures the average water-conducting capability of porous media. There are different definitions widely used in subsurface hydrology:
Arithmetic mean $\kappa_T$ is defined as:
Here n is the total number of zones or subsystems; $\kappa_i$ is the local permeability of subsystem.
Harmonic mean $\kappa_h$ is defined as:
Geometric mean $\kappa_g$ is defined as:
Effective permeability$\kappa_e$ is derived from the Darcy’s Law:
where u is the average flow velocity (m/s) of the field; $\mu$ is the flow viscosity (Pa·s); $\Delta L$ is the length (m) along the main flow direction; $\Delta P$ is the pressure differential (Pa) along the main flow direction. The effective permeability describes the real water-conducting capability of the porous media. The upper bound of the effective permeability is often the arithmetic mean, and the lower bound is the harmonic mean. They correspond to flow through a perfectly layered systems, parallel and perpendicular to the layering, respectively (Heidari and Li, 2014; Zinn and Harvey, 2003).
Variance of permeability
The extent of deviation from the mean is calculated as follows:
where $\operatorname{Var}(\kappa)$ is the permeability variance (m4). Larger variance indicates larger extent of spatial heterogeneity. Permeability of geological media differs significantly in natural subsurface systems. Conductivity (K) is also commonly used as a measure of conducting capability of porous media. The Macrodispersion Experiment (MADE) site in Mississippi has both small silt and sand regions. It has a centimeter scale ln(K) variance as large as 20, while its variance at the meter-scale measured by borehole flowmeters is approximately 4.0, which is considerably smaller because small-scale variability is averaged out (Feehley et al., 2000; Harvey and Gorelick, 2000; Zinn and Harvey, 2003). The Wilcox aquifer in Texas also has high ln(K) variance of about 10, as does the Livermore site (ln(K) variance >20) (Fogg, 1986; LaBolle and Fogg, 2002). The Bordon site at Borden, Ontario, however, is relatively homogeneous with ln(K) variance around 0.20 (Mackay et al., 1986; Sudicky, 1986). Note that ln(K) mentioned here is the natural logarithm of hydraulic conductivity K (m/s).
Correlation Length
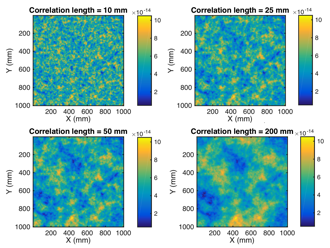
Correlation length is a measure of correlation in spatial variation. Two points that are separated by a distance larger than the correlation length have fluctuations that are relatively independent, or uncorrelated. In contrast, properties of two points that are within correlation length are correlated. For detailed calculation and application of correlation length in subsurface fields, readers are referred to (Bruderer-Weng et al., 2004; Gelhar, 1986; Heidari and Li, 2014; Salamon et al., 2007). Correlation lengths differ significantly in natural subsurface systems, as shown in Table 1. Figure 4 shows the patterns of permeability fields (m2) with different correlation length generated from Gaussian Sequential Simulation Method.
| Source | Geological Media | Correlation Length (m): Horizontal | Correlation Length (m): Vertical | Overall Length (m): Horizontal | Overall Length (m): Vertical |
|---|---|---|---|---|---|
| Socorro, New Mexico | fluvial sand | >3 | 0.1 | 14 | 5 |
| Rio Grande Valley, New Mexico | fluvial sand | 7.6 | 760 | ||
| Cape Cod, Massachusetts | glacial outwash sand | 5 | 0.26 | 20 | 5 |
| East central Illinois | sandstone aquifer | 4.5×10⁴ | -- | 5×10⁵ | -- |
| Las Vruces, New Mexico | alluvial silty-clay loam soil | 0.1 | -- | 6 | -- |
Hydraulic connectivity
A series of hydraulic connectivity have been defined as integrative measures of spatial heterogeneity characteristics. Static connectivity can be calculated by the connective structure of the hydraulic conductivity or geological facies. Dynamic connectivity directly relates to physical flow or transport processes. For interested readers, we refer them to (Knudby and Carrera, 2005; Knudby and Carrera, 2006; Renard and Allard, 2013; Siirila-Woodburn and Maxwell, 2014; Willmann et al., 2008).