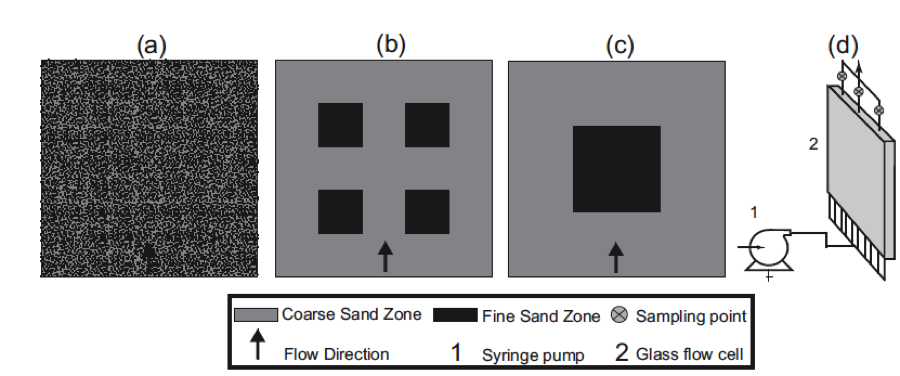
In Heidari and Li (2014), 2D flow experiments and modeling were used to understand non-reactive solute transport in heterogeneous porous media with different spatial patterns. There are three two-dimensional (2D) sandboxes (21.9 cm × 20.6 cm) packed with the same 20% (v/v) fine and 80% (v/v) coarse sands in three patterns that differ in correlation length: Mixed, Four-zone, and One-zone. The Mixed cases contain uniformly distributed fine and coarse grains. The Four-zone and One-zone cases have four and one square fine zones, respectively (Figure 8).
Read the paper carefully and follow the example in this lesson to generate the 2D flow fields and tracer breakthrough curves for the three sandboxes of high permeability contrast (HC). All parameters and properties of the three flow cells are in Table 1 and Table 2 in the paper. You can compare your modeling output of the flow field and breakthrough curves with Figure 5 (Flow field and local breakthrough curves) and Figure 6 (overall breakthrough curves from 2D model) in the paper. Note that one pore volume is the same as one residence time.
Note:
Apologies for no original CrunchFlow files for this hw. you can follow Example 8.1 and similarly set it up for this homework.