Seminar Course

What is a seminar course?
A seminar course is usually a relatively small-enrolling, discussion-based course. Students are required to read and complete assignments before coming together to discuss topics and themes.
What are the affordances of this model?
Seminar courses can engage students to think deeply, to discuss comprehensively, and to synthesize their learning while completing a semester project. This format is wonderful for fostering higher-order thinking and for encouraging student leadership and inclusivity.
Things to pay attention to:
Seminar courses generally do not rely on instructor-generated "lectures." They require that students have a clear understanding of the course structure and that they come ready to think critically and discuss in depth. Seminar courses give students opportunities to come together to discuss their findings, thereby collectively working to expand their understanding of the field of study. The social aspects of collaborative discussions help students learn from one another and help the learning community think about the limits and opportunities within the field.
We look forward to working with you!
Contact us directly or visit the Dutton Website to learn more!
Introduction to GEOG 580
Welcome to GEOG 580: Geovisual Analytics!
This course was developed to provide students with opportunities to explore real-world problems with geovisual analytics.
The seminar structure was chosen to give students experience investigating and discussing many topics, and hands-on lab work is included to provide experience using and critiquing various geovisual analytics platforms.
Students read and discuss weekly, complete four lab exercises, and delve into two major projects: a literature review and a final project that includes intermediary checkpoints. The literature review gives students practice reviewing and analyzing a large body of knowledge, and students enjoy the fact that they can choose their own topics so that they can dive into final projects that allow them to apply what they've learned in the labs. Finally, at the end of the course, students enjoy sharing and exchanging ideas surrounding the set of projects completed by their classmates.
Lesson 2 Overview
Overview first, zoom and filter, then details-on-demand.
-a Visual Information Seeking Mantra from Ben Shneiderman (2003)
Welcome to Lesson 2!
In the second lesson, we will continue our tour of the geovisual analytics research landscape. However, we will shift our focus from developing a broad understanding of what GVA is and why it emerged as an important discipline to beginning to explore focused and unique use cases for applying GVA concepts and techniques. More specifically, you will engage in a series of readings concentrated on leveraging visual analytics for use cases involving text and time. Paralleling this reading activity, you should be investigating the GVA literature to identify a topic for the literature review assignment. I encourage you to spend the time necessary to pick a topic that is well-defined, relevant to GVA, and hopefully of interest to you. Also for this lesson, you will complete a hands-on exercise that introduces you to ArcGIS Insights, which is another GVA platform created by Esri.
By the end of this lesson, you should be able to:
- generate a literature topic that is unique, narrowly focused, and clearly within the scope of GVA
- provide informed feedback to peers on the relevancy of selected research topics in the context of GVA
- compare and contrast GVA approaches to making sense of text
- show an understanding of the role of time in GVA applications
- demonstrate an understanding of/proficiency with ArcGIS Insights by engaging in a tutorial-based assignment
- evaluate the ArcGIS Insights platform for usability and utility
- based on an analysis of the platform, generate an idea for an improvement to the usability and utility of ArcGIS Insights
To Complete Lesson 2
- Read all Lesson 2 module materials
- Complete the assigned readings
- Participate in the Discussion Forum
- Complete the ArcGIS Lab
- Submit your topic selection to the topic choice spreadsheet
- Participate in the Topic Choice Discussion Board
Lesson 2 Reading Assignment
In this lesson, we will read a series of papers that begin to illustrate the breadth of diversity in (geo)visual analytics applications. R1 presents the novel use of GVA in supporting “close reading” of poetry through interactive, visual exploration of a poem’s sonic topology. R2 is all about time and storytelling, showcasing the complexity of effectively and expressively communicating multiple narrative points visually. Finally, in R3, we will see how GVA can be leveraged to support “distant reading” through enabling the digital humanities community to explore large text archives containing both spatial and temporal information.
For all of these works, consider the level of effort and time it took for the researchers to arrive at an effective design solution for a very specific use case or need. My hope is that these readings, along with looking ahead to future lesson topics/readings (in addition to your own research!), will help guide you in picking a literature review topic that is narrowly focused, GVA-relevant, and personally of interest! Don’t forget to submit your topic idea by the mid-lesson deadline and be prepared to provide a short paragraph summarizing your topic by the end-of-lesson deadline, in addition to commenting on at least two other classmates’ topics.
For this lesson’s discussion forum, respond in two-three paragraphs to one of the following prompts:
- Carefully consider R2 and reflect on how you might also integrate space and/or place into the various timeline design options. Explain what this integration could look like and outline any challenges you foresee in your proposed design option(s).
- Compare and contrast how GVA is used to support “close” (R1) and “distant” (R3) reading. Is there any overlap in the researchers’ approaches to informing these text-based use cases? Were there any methodological components that one study used that could have informed the other study had those researchers applied that approach?
Post your written work to Discussion Forum #2 and be sure to post substantive responses to at least two of your classmates.
- R1: McCurdy, Nina, Julie Lein, Katharine Coles, and Miriah Meyer. Poemage: Visualizing the sonic topology of a poem. IEEE transactions on visualization and computer graphics 22, no. 1 (2015): 439-448. https://doi.org/10.1109/TVCG.2015.2467811
- R2: Brehmer, Matthew, Bongshin Lee, Benjamin Bach, Nathalie Henry Riche, and Tamara Munzner. Timelines revisited: A design space and considerations for expressive storytelling. IEEE transactions on visualization and computer graphics 23, no. 9 (2016): 2151-2164. https://doi.org/10.1109/TVCG.2016.2614803
- R3: Bruggmann, André, and Sara I. Fabrikant. How does GIScience support spatio-temporal information search in the humanities? Spatial Cognition & Computation 16, no. 4 (2016): 255-271. https://doi.org/10.1080/13875868.2016.1157881
This reading is available via the Library Resources link in the Course Navigation Menu (at left).
Lab Assignment: Inights for ArcGIS - Investigating Suspicious Prescription Drug Trends and the Refugee Crisis
In this lab, we will explore the capabilities of the ArcGIS Insights platform for supporting geovisual analytics in the context of analyzing patterns in suspicious prescription drug trends and global refugee movement. We will complete two lessons that Esri has developed to showcase its capabilities, and then you will critique what you have seen.
The goals of this lab are to:
- become familiar with the geovisual analytics capabilities of the ArcGIS Insights platform,
- evaluate the extent to which the platform supports spatial analytical reasoning, and
- gain familiarity with common usability and utility assessment for system design.
Getting Started
To launch Insights for ArcGIS, you need to log in to your ArcGIS account. Once you’re logged in, click the Apps button at the top of the page and select the Insights application:
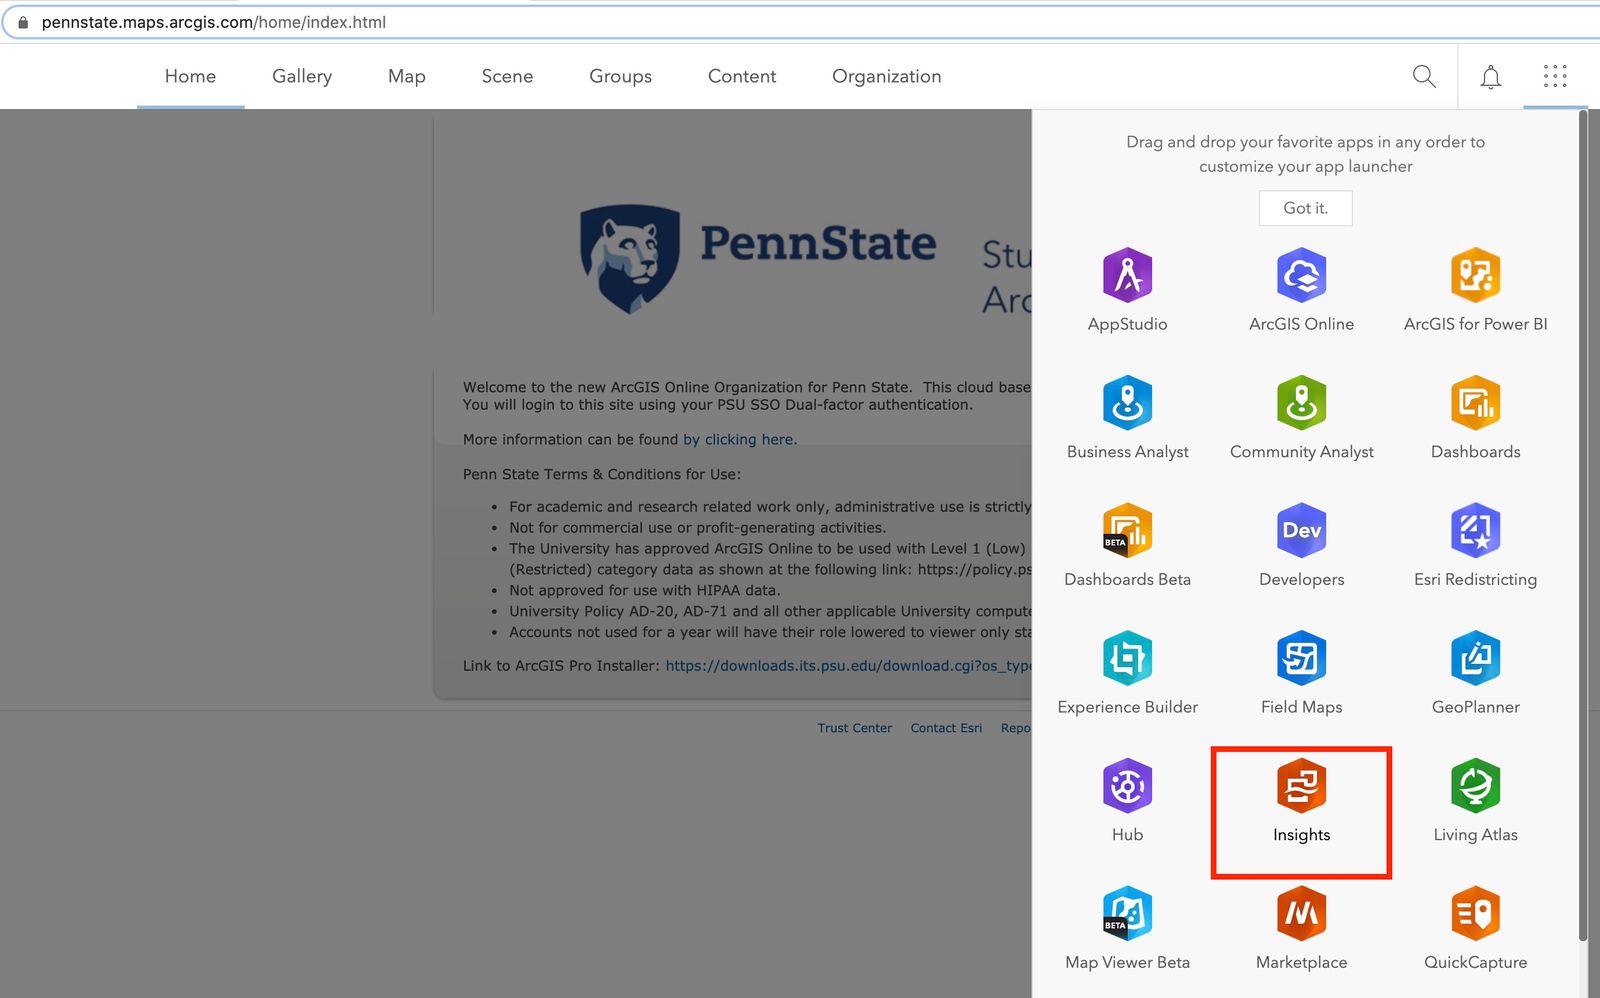
The Insights application
The activity we’re going to complete next is split into two parts. In the first part, you’ll learn how to do basic operations in the Insights application and do a little bit of visual analysis across coordinated views of prescription drug data. The second tutorial will have you explore refugee data and go a bit deeper into some of the analytical capabilities in the Insights platform.
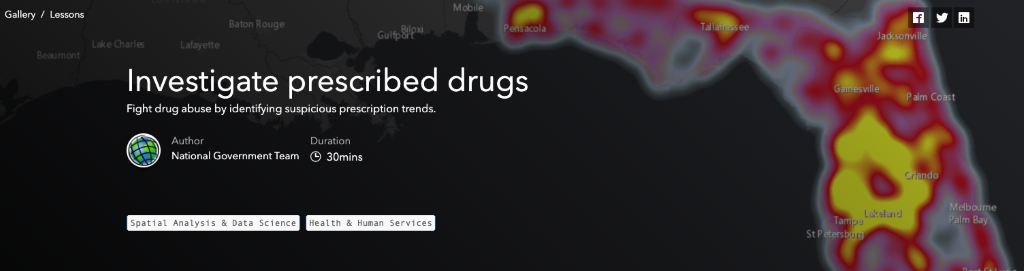
To access the instructions for the first exercise on prescription drug analysis, go here: Investigate prescribed drugs
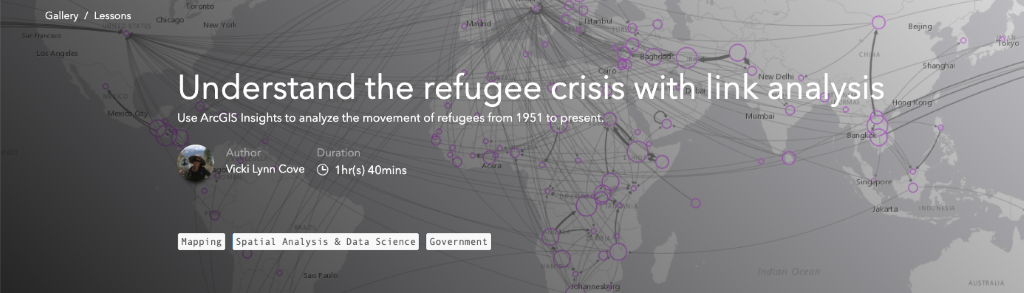
Once you’ve completed that tutorial, move on next to the tutorial on analyzing refugee data here: Understand the refugee crisis with link analysis
Deliverables
Work for this lab must be completed by Tuesday at 11:59 pm EST.
Below is a link to a “survey” consisting of three parts. The first part asks you to respond to short answer questions pertaining to the extent to which this platform supports spatial analytical tasks and who the target audience of this tool is. The second and third parts ask you to assess the usability and utility of the platform. Make sure to input your name on the final page before submitting.
Please see the Lab 2 drop box for the Grading Rubric for this assignment.