Multimodal Course

What is a Multi-Modal course?
A course that relies on a multimodal model is a course that provides instruction in several different ways, including video, pictures, audio, and text, to expose students to the same concept repeatedly and in different ways or "modes."
What are the affordances of this model?
Multimodal instruction enhances learning in two ways: first, by allowing students to experience learning in the way that is most comfortable for them, and second, by challenging students to experience and learn in other ways, which may be outside of their comfort zones. Multimodal instruction keeps students engaged with the content and is proven to increase students' abilities to understand and remember important information.
Things to pay attention to:
On the following pages, note that topics are presented in the form of text, video, images, and slideshows, allowing students to learn and process the same topic in a variety of ways.
We look forward to working with you!
Contact us directly or visit the Dutton Website to learn more!
Introduction to GEOSC 10
Welcome to GEOSC 10, Geology of the National Parks.
This course was developed to provide a broad overview of Geology while exploring some of our beautiful National Parks. It was developed to be a large enrolling, online general education course.
The instructors wanted to teach geology in a fun and engaging way by utilizing multiple modes of instruction. They include text, slide shows of the National Parks, detailed diagrams, narrated animations and PowerPoint mini-lectures, and vintage videos of students teaching other students about the geology of the National Parks. It also includes geological interpretations of classic rock songs performed by the course author! The student videos are from a CAUSE trip where students traveled to the National Parks and filmed each other teaching. The trip was way back in the early 2000s, but the videos remain in the course to build excitement for future student visits to the parks. The course has stood the test of time and remains a popular option for resident and online students alike.
The following pages are from a lesson, but the lesson in total is not replicated here. Note the structured layout of the material, providing students with clear learning objectives. The students are assessed with weekly multiple-choice quizzes, a final exam, and 6 online exercises.
Watch a brief video introduction from Dr. Alley! (1:03)
Welcome to Geosciences 10. I'm Richard Alley, and I'll be your tour guide to the geology of the national parks. In the course of the semester, we're going to visit some of the most beautiful and interesting places in the world. We're going to ask some big questions. Why are there mountains and volcanoes and earthquakes? Um, why are the mountains torn down by rivers, by glaciers? Um, what's the history of this planet, how do we live on the planet, how do we stay happy and healthy and terrific with the planet? And while we're doing it, we are going to visit some of the most beautiful and wonderful places on the planet. By the end of the semester, we're all going to know a lot more about the national parks, and you are going to be so excited that next summer you're going to be off to visit one because they're such wonderful places. Have a great semester. I'm going to jump on my bicycle and head into school and get to it.
Welcome to Module 5!
Tearing Down Mountains: Weathering, Mass Movement, & Landslides
This is Spring Creek. We're in the Spring Creek Canyon just downstream from Penn State's University Park Campus. People have been coming here to Fisherman's Paradise for a century almost, to catch wild brown trout in this world famous trout stream. The creek once flowed way above our heads, way up there, and it has cut this canyon and left these glorious 200 foot high cliffs here.
Right next to me there is a big rock and that big rock used to be at the top of the cliff and it fell down. If you have a kitten and you put something on a table or a shelf, the kitten tends to knock it off. There aren't kittens up there knocking down the rocks but there are ice crystals growing in cracks that widen the cracks. And there are tree roots growing in the cracks, and there are little earthquakes shaking things. The weather attacks the rocks. It breaks them up, things get in the cracks, and they knock them down. Once it gets down here, the stream may break it up more. The stream eventually will pick it up and take it down to the Chesapeake - to the ocean. And then sometimes the rocks dissolve on the way and there are things we can't see in the water that get taken down to the ocean, and they get made into seashells down there. And the pieces, and the seashells, eventually may get scrunched in an abduction zone or taken down a subduction zone to feed volcanoes, to make new rocks that can be attacked by the weather again. And if you see a cycle here, it's because there is a cycle.
We will tell you later how we know the times. The fastest this cycle can run is about 10 million years. Right here, these rocks are about 500 million years old so it's been a pretty slow cycle here, but pieces of it can be fast, because if you're in the way when that rock falls down it could kill you in a second. So there's very interesting things we have to understand here and we're going to deal with them in this module.
Fans of old-fogey rock music may recall that Paul Simon was "slip-sliding away." Paul was singing about human relations, not about debris flows. But, our hillsides really are “slip-sliding away,” too. Weather attacks rocks to make loose blocks, which may fall off cliffs rapidly or hang around to make soil before sliding downhill. So, crank up the tunes, watch out for rolling boulders, and let’s slip on into Module 5.
Learning Objectives
- Explain why the wind blows.
- Discuss why wind going up mountains produces rain and then becomes warmer going down the other side.
- Explain how weathering changes rocks physically and chemically at the Earth’s surface.
- Discuss mass movement and the downhill motion of loose rocks and soil.
- Explain how weathering and mass movement of old rocks are part of a cycle that leads to new rocks that experience weathering and mass movement.
What to do for Module 5?
You will have one week to complete Module 5. See the course calendar in Canvas for specific due dates.
- Take the RockOn #5 Quiz
- Take the StudentsSpeak #6 Survey
- Submit Exercise #2
- Begin working on Exercise #3
Questions?
If you have any questions, please feel free to send an email through Canvas. Remember to include all of the teachers and all of the TAs in the "To" line. Failure to email all teachers and all TAs may result in a delayed or missed response. Directions for how to send an email can be found in the Resources module.
Weathering Processes
Weathering Processes
We met metamorphism back in Module 4. If you take some Earth material (mud, for example) from one environment where it is “happy” (near the surface of the Earth), and move it into a very different environment, the mud changes. Moving the mud deep into the Earth, where temperature and pressure are high, causes new minerals to grow, and the soft mud with its tiny clay particles can become a hard metamorphic rock with big, beautiful crystals of fascinating minerals.
The materials in the mud are stable (or at least nearly so) under conditions found at the surface but not stable under conditions found deep in the Earth. And, perhaps not surprisingly, minerals produced deep in the Earth usually are not stable under surface conditions. Compared to deep in the Earth, the surface is wetter, has more oxygen, has a wider range of acid/alkaline conditions (with acid especially common at the surface), and has many more living things trying to break down the minerals to extract chemicals that are useful to them (“fertilizer”).
As a general rule, the more you change the conditions around a mineral, the faster the mineral changes into something new. (This “rule” has many exceptions, but it is often useful.) At or near the Earth’s surface, the changes that occur to a mineral at a place are called weathering. Moving the products of weathering is called transport. And weathering plus transport are lumped together as erosion.
Weathering, in turn, is divided into mechanical weathering and chemical weathering. Mechanical weathering refers to nature breaking big pieces to make little pieces; chemical weathering refers to nature making new types of materials that were not there previously.
Mechanical Weathering
Mechanical Weathering
Turning big pieces into little ones requires cracking the big ones. Cracks in rocks are caused or enlarged by processes including:
- Mountain-building stresses or earthquakes;
- Expansion as erosion removes the weight of overlying rock;
- Expansion and contraction during heating and cooling (especially very near the surface during forest fires; a really hot fire followed by a rainstorm can change temperature a lot in a hurry);
- Growth of things in cracks (tree roots, various minerals, and especially ice).
Probably the most important mineral that grows in cracks is ice, but others do too. For example, the mineral thenardite, Na2SO4 (no, you don’t have to memorize the mineral or the formula!) can add a lot of water to its structure (10 molecules of water for each Na2SO4, to make mirabilite, Na2SO4·10H2O, and you still don’t need to memorize the mineral or the formula), expanding in the process. Some pieces of the “dry” mineral, thenardite, may fall into a crack in a dust storm during the dry season, and then change to the much bigger mirabilite during the rainy season as the air gets humid, wedging open the crack. Too much rain may dissolve the mirabilite and move it deeper into the crack where it can lose water during the next dry season and then get wet and expand again, and again… This process is breaking many of the ancient monuments of Egypt as increased irrigation and other activities give seasonal increases in humidity in some places. (The story is even a little more complex than this, but, as shown below, the growth of minerals in cracks really does break rocks!)
Video: Rock Weathering (1:44)
Rock weathering really does happen. Things break rocks. Here is an example of tree roots breaking a human-made rock, or pavement, and we have to worry about a lot of human-made things being broken. The National Park Service preserves so many historical things that they actually have a National Center for Preservation Technology and Training to learn how to preserve our past for the future, as shown here. These pictures are just a little bit old, but they show an attempt by this National Center and Princeton University to learn how to save rocks from certain kinds of weathering. And they were worried about sodium sulfate salts that get into cracks and then can pick up water and expand, and in doing so they can break the rocks. And this would be thenardite changing to mirabilite. You don't need to know the detail, but it really does happen. And these pictures are slightly old, but what you can see here is they had developed a treatment that was used on some of these that protected them. And others, that were put in the salt and did not have the treatment, were very clearly not protected. So there are things that we humans can do to help save the things we made, but there is no question whatsoever, that nature does know how to break rocks.
Want to see more?
Enrichment: Another vintage movie for you to enjoy--and it won't be on a quiz. Here, National Park Service Ranger Jan Stock and the CAUSE students explore the freeze-thaw cycle in Bryce Canyon National Park.
Video: The Freeze-Thaw Cycle: Bryce Canyon National Park (1:17)
This white feature here is called the Wall of Windows. It's actually limestone. And it started out with a little tiny hole, like the hole on the left, and then it's eroding and eroding and eroding.
You've got the bridge on top. And then the bridge on top will fall away. And then you'll have the two hoodoos left standing. The difference between a natural bridge and an arch? Natural bridges are formed by streams and rivers running through underneath, cutting away.
Whereas this one is?
Whereas this is actually frost wedging.
OK.
Where it freezes and thaws and freezes and thaws and freezes and thaws and then it breaks away in the different layers.
Chemical Weathering
Chemical Weathering
Chemical changes are often more interesting and more complex than physical ones. There is a great range of possible changes, and you must know a lot of chemistry to really appreciate all of them. In general, weak acids are the most important. (Strong acids would be most important, except nature doesn’t make large quantities of them!) Rainwater picks up carbon dioxide from the air and becomes a weak acid called carbonic acid. In soils, water may pick up more carbon dioxide plus organic acids from decaying organic material, becoming a slightly stronger but still-weak acid.
When acid attacks a rock, the results depend on what minerals are present, how warm, wet, and acidic the conditions are, and a few other things you don’t need to worry about. We can sketch some general patterns. Suppose we start with granite, a silica-rich rock that forms in many continental and island-arc settings. Granite is fairly common and contains a lot of the commonest elements in the Earth’s crust, so learning about granite gives you insights into weathering of other things. Don’t obsess about learning the details of the minerals we discuss; start by looking for the big picture.
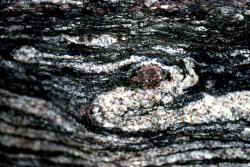
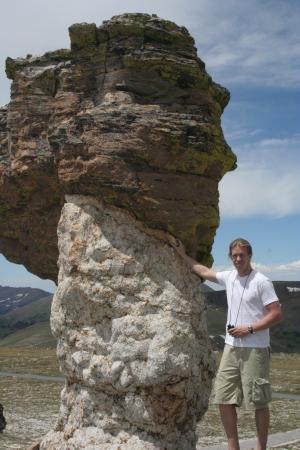
In the image below, you see Penn State graduate Matt Spencer in front of white granite that was intruded into dark metamorphic rock, along Trail Ridge Road in Rocky Mountain National Park. The granite has weathered faster than the metamorphic rock in this environment, so the granite remains only where it is protected by the overhanging metamorphic rock. (These vaguely mushroom-shaped features are called "hoodoos", by the way.)
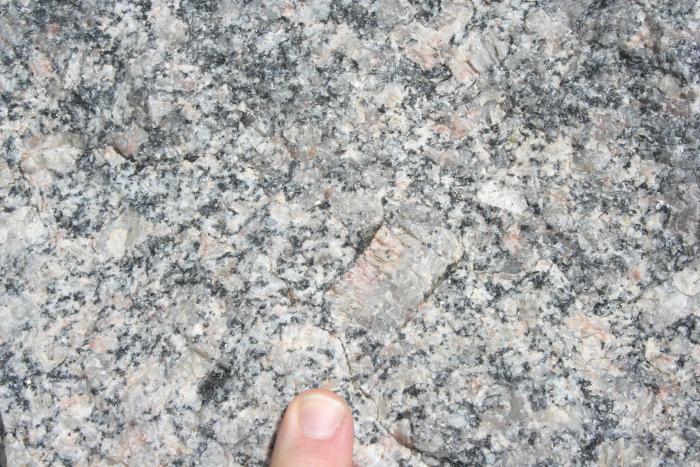
As shown in the close-up picture of a granite boulder below, granite usually is composed of four minerals: quartz (which is almost pure silica, with silica in turn composed of the elements silicon and oxygen), potassium feldspar and sodium-calcium feldspar (mostly silica, with a little aluminum replacing some of the silicon and potassium, sodium or calcium added for balance), and a dark silica-bearing mineral containing iron and magnesium (often a dark mica called biotite). The eight elements named in this paragraph make up almost 99% of the atoms in the rocks of the crust of the Earth. (Helping living things survive and running our economy requires many other elements that are quite rare in rocks, one reason that geologists are hired to find valuable, rare things and help mine them.)
When granite interacts with carbonic acid, several things happen. Typically, for most of the minerals in most environments:
- Iron (Fe) rusts. It picks up water and oxygen and remains in the soil as little pieces of rust.
- The aluminum (Al), potassium (K), and silica (SiO2) from the feldspars and from the dark mineral rearrange into new minerals, called clays, that also include some water.
- The calcium (Ca), sodium (Na), and magnesium (Mg) dissolve in water and wash away.
- Most of the quartz (silica as a mineral) sits there almost unchanged as quartz sand (a little of it may dissolve and wash away, but most stays).
One can write a sort of equation:
Granite → rust + clay + (dissolved-and-washed-away Ca + Na + Mg) + quartz sand
The rust, sand, and clay left behind, plus a little organic material often including worm poop, become the indispensable layer we know as soil. (And, if you have ever tried to drive a car on soft soil during a rainstorm and had your tires sink in and get stuck, you may call the soil “mud”, possibly with some bad words added.)
The calcium and silica that dissolve and wash into the ocean are used by sea creatures to make shells, the dissolved magnesium washed into the ocean often ends up reacting with hot rocks at spreading ridges to make new minerals in the seafloor or goes into some of the shells, and the dissolved sodium accumulates in the ocean to make it salty. (Eventually, the ocean loses some salt, often by the salty water getting trapped in spaces in sea-floor sediments and going down subduction zones to feed volcanoes; evaporation of water in restricted basins also may cause deposition of some salt.)
You should recognize that this is a very general description of what happens; were it this easy, there would not be hundreds of soil scientists working to understand this important layer in which most of our food grows. In general, the hotter and wetter the climate, the more stuff is removed—rust and quartz sand can be dissolved in some tropical soils, leaving aluminum compounds that we mine for use in making aluminum. In dryland soils, calcium and magnesium may be left behind forming special desert soils, or sodium may be left behind forming salty soils in which little or nothing will grow.
You also should recognize that the “chunks” in soil – rust, clay, sand, and organic materials – can be carried away by streams or wind, or glaciers, but as chunks rather than invisible dissolved materials. We discuss this loss of chunks in the next sections. If chunks are carried away more rapidly than new ones are formed, the soil will thin, and we will find it difficult to grow food to feed ourselves (this is what Teddy Roosevelt worried about in the quote at the start of this Module). The chunks eventually are carried to the oceans and deposited as sediment on the seafloor, together with a lot of shells.
Recycling
Granite may form beneath a volcano in a subduction zone. We have just seen that the granite then will begin to break down, making dissolved things and chunks. Eventually, the chunks are carried to the sea, by rivers and glaciers and wind (we will study this transport soon), while the dissolved things also go to the sea where they are turned into shells or other things. Sediment consisting of these chunks and shells, with some of the salty water in the spaces, is then taken down subduction zones to feed volcanoes that make granite. Some of the shells even contain a little carbon, and some dead things containing carbon are buried in the sediments, and some of this carbon is taken down subduction zones and supplies carbon dioxide to the volcanoes with water, helping make carbonic acid that weathers the granite.
If this looks like a cycle, it is! The Earth really does cycle, and recycle, everything! But, going around this loop once takes at least millions of years, and may take a lot longer than that, issues we'll discuss later.
Grand Tetons and the Gros Ventre Slide
The Grand Tetons tower above the valley known as Jackson Hole, Wyoming, provides the epitome of western scenery for many people. A still-active pull-apart fault lies along the front of the range and slopes steeply downward beneath Jackson Hole. From the highest peaks to the fields of the Hole, where elk and moose and bear are common, is well over a mile vertically (roughly 2 km), but the total vertical offset on the fault is almost 6 miles (10 km) (we don’t see this total offset because a lot of rocks have been eroded from the top of the range and deposited in the valley). The uplifted block is primarily old metamorphic rocks that erode only slowly. The faulting is probably related to the Basin and Range extension that also gave us Death Valley, although the complexity of the region makes any interpretation difficult. Dr. Alley recalls huddling next to an overhanging rock, far up on the steep front of the Tetons, watching hailstones rattle off the trail from a black deck of clouds barely over his head. It is a truly awesome place.
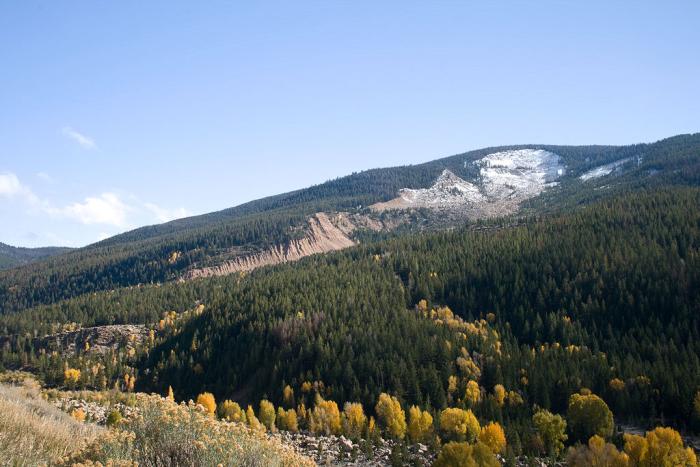
A few miles (few km) east of the park you can visit another interesting feature: the Gros Ventre Slide Geological Site. There, as shown in pictures and the VTrip below, a mountain-sized ridge is made of rock layers that slope steeply, almost parallel to the north slope of the ridge, down to the Gros Ventre River. Those layers include strong, resistant sandstone resting on weak, slippery shale. The river had eroded down through the sandstone and into the shale, leaving the toe of the sandstone unsupported. In June of 1925, after a particularly wet spring, the entire mountainside let loose, sliding along the soft shale down, across the river, and more than 300 feet up the other side; a rancher and his horse who were on the other side barely escaped safely. The slide mass made a dam, and the river then made a lake many miles long and as much as 200 feet (60 m) deep. The entire slide probably required only seconds to occur and moved cubic miles (many cubic kilometers) of rock.
Such a dam of loose debris is not very strong; water flowing through its porous spaces or over it can remove rocks and weaken it greatly until it collapses catastrophically. Back in Module 2, in the West Yellowstone VTrip, we saw that an earthquake just northwest of Yellowstone in 1959 caused a similar landslide, which dammed a river to form a new lake, and that the Army Corps of Engineers had rushed in to move massive amounts of debris and prevent a collapse of the dam. The Corps knew how likely and how dangerous such a failure would be, in part because the Corps had not been tasked to act at Gros Ventre in 1925. In 1927, the dam formed by the Gros Ventre slide failed, washing out a small town downriver and killing six people. The loss of life would have been much larger if more people had lived there. A few of the people living there were saved when a ranger saw the start of the flood, drove downstream faster than the flood and warned the people to flee. Unfortunately, not everyone listened.
Take a tour of the Grand Tetons National Park.
Want to see more?
Here are some optional resources you might also want to explore! (No, these won't be on the quiz!)
-
A Brief History of the Gros Ventre Slide Geological Site (US Forest Service)
- Photos of the Grand Tetons National Park (UCGS)
Mass Movement
The Gros Ventre slide is an especially dramatic example of an important process that usually is more boring: mass movement. This is the name given to the downhill motion of rock, soil, debris, or other material when the flow is not primarily in wind or in a glacier, or in water (if the material is washed along by a river, we call it a river)
Water is usually involved in mass movement, however, and most mass movements occur when soil or rock is especially wet. Water helps cause mass movement for four reasons: 1) water makes the soil heavier; 2) water lubricates the motion of rocks past each other; 3) water partially floats rocks (a rock pushes down harder in the air than in water) so that the rocks in the water are not as tightly interlocked and can move more easily past each other; and 4) filling the spaces in soil with water removes the effect of water tension.
Number four, above, may deserve a bit more explanation. Think about going to the beach and building sandcastles. Dry sand makes a little pile with sides rising at maybe 30 degrees (steep, but not too steep; see the diagram below). Totally saturated (wet) sand flows easily, forming a pile with a much more gradual slope. But people making sandcastles want damp sand, which can hold up a vertical face. You can even make and throw damp sand balls (be careful where you throw them).
Now watch a demonstration of the process followed by a video explanation.
Video: Mass Movement and Sandcastles Demonstration (:55 seconds)
So, let's see what happens with piles of sand. This is a protractor and I'm adding a little playground sand here. This is dry sand and you'll see it makes a moderate slope. It's going to be about 30 degrees there, as you see on the protractor. Now I'll add a little bit of water, but we're just going to make it damp, not wet and you're not going to be impressed by my skills at making sand castles. But you know when you've seen a sand castle that you can now get a very steep slope. But if we take that sand castle and a wave comes in, the tide comes in, we pour a lot of water on it, you see what happens. It flattens way out. And so we have very different behaviors depending on whether it's dry or damp or wet.
Video: Mass Movement and Sandcastles Explanation (2:09 minutes)
So what's going on with this dry damp wet sand, really what's going on down in it. Well let's take a zoom in on the dry sand. These are individual grains of sand made bigger and they make a nice pile that is sort of like this one. You could have a pile like that underwater and totally wet, but the water supports some of the weight of the grains of sand. The water makes it easier for the sand grains to move over each other and so even a little shake or a little current tends to knock down the pile and give you something very broad and not at all steep on the edges such as what we show here. In between the damp case, water molecules tend to stick to other water molecules and they tend to stick to the sand. So when the water is sticking to the sand and the other water, it sort of forms like you see in this diagram. And if we zoom in, here's two grains with the water in between sticking to the sand grains and to the other water molecules. If you were trying to pull the sand grains apart, it takes a force because you either have to pull a sand grain or both sand grains out of the water and break that attraction or you have to pull the water apart and break that attraction. And so the strength of the water sticking to the sand can hold up a sand castle or it can hold up most of the hillside slopes on the earth, most of the time. So here are three dr,y which might give you a sand dune, and damp, which can give you really spectacular sand castles and holds up most of the slopes on Earth, most of the time. But when you make them really wet they may make landslides and run down the hill and that's not good if you're in the way.
The details of the surface physics involved are a bit complicated, but basically, a drop of water will sit at the junction of two sand grains. If you pull the sand grains apart, both grains will end up wet, so you had to “break” the water from one continuous film into two. There is a similarity to a dripping faucet. A water drop doesn’t fall off immediately but first becomes large and heavy. Water molecules stick to each other, and to the faucet, so strongly that they can hold up a large drop of water before it falls. (In situations such as this, the attraction of water molecules for each other is usually called surface tension.) Damp sand thus is strong—a landslide would require some sand grains to move rapidly past other sand grains, breaking the water bonds between the grains. In fully wet sand, however, the grains move more freely in the water without ever breaking it, so motion is easy. Hence, wind can blow dry sand into dunes, damp sand tends to stay where it is, but wet sand flows easily.
Classifications of Mass Movements
There are elaborate classifications of mass movements, depending on how fast, how wet, how coarse, how steep, and how "other" they are. Most of the names make sense: falls are rocks that fell off cliffs, topples are rocks that toppled over from cliffs, landslides, debris flows, and debris avalanches are fast-moving events, and slumps are something like a person slumping down in a chair (failures of blocks of soil along concave-up curved surfaces).
One fascinating and scary type of mass movement occurs in “quick” clays. You can read about these in the Enrichment. Quite literally, in certain places at certain special times, the foundations of a town built on sediments made of certain types of clay may liquefy and flow down the river, killing people. (Most people don’t need to worry about these, though!)
Enrichment
The quick clays that cause large, dangerous landslides generally start off as clay layers deposited rapidly in a shallow ocean, that then is raised above sea level. This often occurs near a melting ice sheet at the end of an ice age. The melting ice dumps a lot of sediment including a lot of clay, and then, as the weight of the ice is removed, the land rebounds above sea level. Clay particles tend to be platy and may look a little like playing cards. When these particles are deposited rapidly in the ocean, the particles may make a house-of-cards structure, with lots of big spaces. The saltwater supplies large ions that sit in the spaces and help hold the “cards” in position, something like little bits of glue helping hold up a house of cards.
After the clay is raised above sea level, rain supplies fresh water that slowly washes out the salt, like removing the glue that was holding up the house of cards. Eventually, a small disturbance may start a collapse, and this tends to make the clay “run away”, failing catastrophically from a solid to a liquid almost instantaneously, and generating a flow.
Flows from such clays are known especially from parts of Canada and Scandinavia. A quick clay failure at Saint Jean Vianney, Quebec in May 1971 destroyed 40 houses and killed 31 people in Canada, and a similar one at Nicolet, Quebec in 1955 killed 3 people. The Norwegian Geotechnical Institute released an amazing report and video about the Quick Clay Slide at Rissa in 1978; this is generally available online, if you search for it, and is truly fascinating. A man with a new (in 1978) camera filmed part of it but then had to run for his life as the slide expanded toward him. (When this was being written, you could find the video on YouTube and elsewhere.)
Sometimes, a quick clay slide will be small and will generate a flow that crosses a road. Bulldozing the clay out of the way does little good; more just flows across. But throwing a bag of salt into the flow near the road and driving a tracked vehicle through to mix the salt and clay may cause the flow to solidify so that it can be bulldozed away.
Soil Creep
Soil Creep
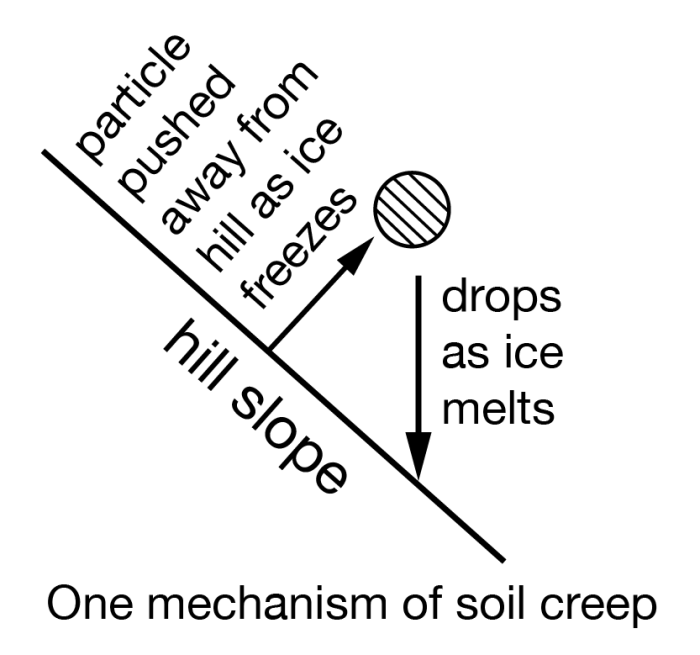
The most important mass-movement type in terms of transferring material downhill is soil creep, the slow (typically inches, or centimeters, per year or less) downslope motion of soil. Creep may be just a very slow landslide. It may occur from freeze-thaw processes—a column of ice that grows under a small pebble on a cold night pushes that pebble out from the hillslope, and the pebble falls straight down when the ice melts, effectively moving a tiny distance down the hill (see the video above). When trees fall over and uproot soil, or when groundhogs and even worms dig up rock grains and allow them to move downhill, creep is occurring. If you look at a typical hill slope, streams on the lower slopes are present to move water and rock downhill, but the upper slopes lack streams. There, soil creep moves the material downhill.
Naturally, hillslopes typically reach a balance, in which weathering breaks down rocks about as rapidly as mass movement and streams take the broken rocks away. The balance may occur with bare rock sticking out (making cliffs, for example), or with a lot of soil covering the rock. If soil creep dominates the mass movement, the hillslope may be close to balance at all times. If landslides dominate, then the soil will build up for a while before suddenly sliding off, and you have to watch for a long time to see the balance. Over a very long time, the hill will usually get flatter, causing the mass movement to slow. However, the soil will very gradually thicken to slow the weathering as the hillslope is reduced, and near-balance will be maintained.
Humans are greatly upsetting this balance worldwide. Our activities—bulldozing, cutting trees whose roots held the soil, plowing, and more—are moving more material than nature moved before we were involved. Landslides are becoming more common, and causing more damage as we build in more dangerous areas. Soil erosion has increased from our farm fields, making it harder for us to feed ourselves. We could slow or reverse many of these damaging trends if we decided to work at it.
Video: Soil Creep/Frost Heave (1:59)
There are many processes that move soil and loose rocks slowly downhills as soil creep. One of them we're going to show you here. We've drawn for you a hill with a pebble, just a little piece of rock, less than a half an inch or so. There would be lots of pebbles on this hill. Now sometimes on a cold night, ice will grow beneath the pebble and it will push it away from the hill as is shown here. This is a picture of how that process looks in the real world. So this is ice and it has shoved these pebbles up by about one inch from a little hillside. These are pine needles and these are pieces of leaves and bark. So, you can see this is at Colyer Lake in Central Pennsylvania. Now what will happen next is that the ice will melt during a warm day and when the ice melts the pebble will tend to fall down. And the net from that will be that the pebble has moved a little bit down the hill in a day or so. Later in the semester we will see that this process also happens to bring rocks out of the soil, up to the surface, so they can then be moved downhill. Pennsylvania's hillsides had a lot of this process during the Ice Age when we were in a permafrost climate. And our hillsides now are covered with big rocks that will twist your ankle if you're hiking if you're not careful and this is part of soil creep.
Here is a simplistic diagram. See if you can describe what is happening to a friend and then take a look at some truly amazing landslides from around the globe.
A Slideshow of Landslides Around the Globe
Optional Enrichment
These will not be on the quiz but might prove interesting. First, let's start with a video of some amazing landslides.
Video: Top 5 Massive landslide Caught on Camera (10:40)
You can hear background noise, but no true conversation.
And now a retro video about one of the National Park's most iconic elements.
Video: Formation of Delicate Arch (2:40)
Here we are at Delicate Arch. With the possible exception of Old Faithful, this is the most famous feature, the symbol of the parks. This is one of the very many, more than 2,000 arches, that are in Arches National Park, and it shares with them the same origin. These are not carved by running water shooting underneath them. Nor are they carved by wind blasting a hole through it. They're carved mostly by some very odd processes.
Down below, there's a layer of salt that was deposited in a sea a long time ago that was drying up here. Salt, when it's down deep and there's something sitting on top of it, is soft, and it flows. And the salt has flowed into sort of a mound, something like a lava lamp bulging up, and that mound has warped the rocks. And if you take rocks and sort of warp them up, they crack. And so there are these cracks that have made standing vertical walls of rock.
Well, the next thing that happens, if we look at that running along towards the bottom, there's a line on both sides of it. That's a soft layer, and it weakens things. Well, when you start undercutting a cliff-- we have these cliffs, and they get undercut by water leaking out along these little cracks-- then what happens is pieces fall off. And enough pieces fall off that eventually one of the pieces breaks through, and then it's an arch.
This arch is not long for the world. We see on the left, about halfway up, how thin it's getting. And we also see at the top a whole bunch of cracks that are developing. That layer across the top is trying to sag, and as it does, there are cracks that are forming. And some of those cracks sort of look like Pennsylvania keystone sitting up there.
And so it might last thousands of years. It might go in the next big storm. But it is not terribly long for the world. We know that many of the prominent and famous features in the park have changed in the time people have been watching. It will be a loss, but an educational one, when this very famous feature of the Park Service also changes.
Soil Erosion
(An extensive collection of animations on this subject)
Mass Wasting/Landslide Animations
(An extensive collection of animations on this subject)
A Rocking Review: Somewhere Over the Puddle
Somewhere Over the Puddle
If you want another look at the weather system, and the difference between the Redwoods and Death Valley, the Wizard of Odd takes you Somewhere Over the Puddle in this review revue. (The Sierra tops out over 14,000 feet but in most places is lower, so don't let it bother you that the air in the GeoClip went a little higher than the air in this song--both are right, depending on just where the air goes over.)
Video: Somewhere Over the Puddle (2:54)
Dr. Alley: (SINGING) Somewhere over the rainbow, raindrops drops. Sun and rain make a rainbow with your eyes in between, that's all. Sun falls straight on the equator, just skims the poles.
So tropical heating is greater. Air rises and sinks in rolls. Air lifted in these currents great expands as it feels lesser weight, brings cooling. Air cooling holds less H20, condenses to rain, clouds, or snow. That fall, no fooling.
When there's evaporation, it takes energy That is why perspiration drying cools you or me. Equatorial evaporation stores solar heat that's released by cloud condensation. Energy is conserved, pretty neat.
This heat from Condensation slows. Cloud cooling as it upward grows while raining. But when this air comes down, it's dry, and squeezing drives its fever high. And you know from your training.
Three degrees F per 1,000 feet upward, cools and rains. Five degrees F per 1,000 feet downward warms up the downwind plains. Somewhere over the rainbow, raindrops fall.
Sun and rain make a rainbow with your eyes in between, that's all. Wet redwoods, cold sierra high above Death Valley set to fry. That's why.
Introduction to EARTH 103
The course author's goal was to create an interactive and illustrative online "textbook" to show the impacts that climate change has on the earth now and in the future. Based on that, the text-first format worked well.
Students begin by reading text accompanied by lots of pictures, which were added using the H5P slide sorter that permits students to flip through several pictures embedded within sections of text. As students progress through the course, they encounter embedded videos, Knowledge Check questions, and Activate Your Learning exercises. Together, these elements keep students engaged with the content and help them to build knowledge as they go. Knowledge Checks, interactive questions developed with H5P, allow students to check their understanding of the topics covered in each section. The Activate Your Learning exercises are more involved, requiring students to take some kind of action beyond answering simple questions. These actions include visiting a website to search for a topic, gathering information, reading an article and writing a short essay, or running a simulation. Students work their way through the content by reading, looking at pictures, and completing any Knowledge Checks and Activate Your Learning activities. They then take a lesson quiz and either complete the lab or work on part of their capstone project.
Module 3: Earth's Climate System
Video: Module 3 Introduction (1:14)
Hi, students. Welcome to module 3 on climate models. I grew up in London back in the 1960s, and weather forecasts were always wrong. They would predict a storm--it would be perfectly sunny. They would predict sunny weather, and there would be a storm. They were always wrong. Now we're at a time when weather prediction is really good, and that is because the computer side of the models is very strong and very advanced, and we're getting much better at predicting climate in the future as well.
So, in this module, you'll learn about how CO2 levels and forecasted levels of CO2 drives climate models. The amount of CO2 in the atmosphere will definitely be related to the temperature in the future, as well as the global rainfall in the future, storm tracks, and storm intensity in the future, fire forecasts in the future, and sea level rise. And what we're going to learn about in this module is how different levels of CO2 that are controlled by human activity in the future will definitely be used to predict temperature, rainfall, hurricane intensity, as well as sea level rise. I think you're going to learn a lot about this module, how it's important for your future, and I hope you enjoy it.
Introduction
This course is all about the Earth’s climate. Thus, it is essential that you have a solid understanding of how the climate system works. This module is all about the climate system. It is by far the most technical module in the course, and our philosophy is to lay out the science in a comprehensive way, equations and all, so that you can see that Earth's climate is in part fairly simple, governed by physical relationships that describe how heat from the Sun is exchanged on the surface of the Earth and in its atmosphere. Then, there are some very complex aspects of the Earth's climate that we will not devote much time to.
Here is an example of why this module is important. The Polar Vortex has become a household name in the US in recent years. In Texas in the winter of 2021, the cold air from the vortex caused unusually cold temperatures and this crippled the power system that was not built to withstand such temperatures. The power cuts caused chaos, up to 5 million people were without power often for many days, 12 million people lost water service due to freezing pipes, and 151 people died as a result of hypothermia and carbon monoxide poisoning.
Video: Deep freeze in Texas: Millions without power, 21 dead in historic snowstorms (2:54)
Deep freeze in Texas.
Homes and roads blanked in deep snow and temperatures colder than Alaska… Historic and deadly winter storms have sent the southern US state of Texas into a deep freeze, with temperatures plummeting to as low as -18C in some places. In a state more used to heat and sunshine and ill-equipped for Arctic conditions.
Burke Nixon - Houston resident: We have no water. We woke up this morning, our pipes are all frozen, and we have no water in the house. Our neighbor just got us some propane to try to thaw our pipes because they are frozen. We’re not used to this in Texas.
For many, the conditions have been made tougher by being left without power. With the storm knocking out about a third of the state’s energy production capacity. As of late Tuesday, more than 4 million cross the state were still without electricity.
Birgit Kamps - Houston resident: We were getting ready to cook dinner and all of a sudden, lights went off, power went off, everything went off. And I was like, “Wow, now what do I do?” And, I grabbed a bunch of blankets. So we cuddled up with our three dogs, one cat, my daughter and, you know, made it through the night.
Scenes from, Louisville, Kentucky
Scenes from, Telluride, Colorado
Winter storms have hit vast swathes of central and southern US since the weekend.
Scenes from, Ciudad Juárez, Mexico
And even seen rare snowfall and caused power outages in northern Mexico.
Scenes from, Chicago, Illinois
At least 21 people have been killed across four US states, including in falls and traffic accidents.
Scenes from, Brunswick County, North Carolina
The extreme conditions have also triggered at least four tornadoes, including one in coastal North Carolina that killed at least three people. The freezing weather is expected to continue to grip much of the United States until the weekend.
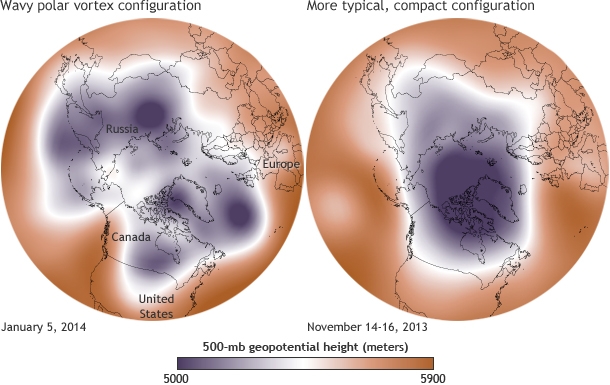
Those of us on the East Coast and Midwest of the US and our neighbors in Canada, 187 million people in all, lived through an extremely cold week at the beginning of 2014. Air temperatures, without the windchill factored in, reached -35oC in eastern Montana, South Dakota, and Minnesota. This cold was a result of the southward expansion of the polar vortex, a whirlwind of cold dense air that is normally restricted to the area around the poles. Understanding the polar vortex, and how it became unstable and swept across the Midwest and eastern parts of Canada and US, is key to interpreting the significance of the extreme cold in early 2014. Without this understanding, you might think that the expansion of cold air is a sign of cooling climate. However, it is likely that the opposite is the case; the recent cold snap is actually a result of warming. This is how it works. As you will learn in this module, the northern high latitudes are warming more rapidly than the rest of the globe as a result of melting sea ice. You will also learn that such warming leads to diminished wind velocities, including the polar vortex. As the vortex weakens, it becomes less stable and begins to wobble and stray from the region around the North Pole. It turns out that the recent cold snap was just one of these wobble events, and the projections are for polar vortices to become more common over North America in the future, just as other extreme events like extratropical hurricanes such as Sandy, heat waves and droughts become more frequent.
Now, right off the bat, we need to make it clear that the "simple" relationships are often portrayed in the module in terms of equations. You do not need to be a Math major to understand these equations, nor do we want you to memorize them. The point of showing the equations is not to cause great anxiety, but to provide an understanding of the relationship between two variables. For example, you should be looking to distinguish relationships that are linear (such as a=b*x [where * is multiplied by]) from those that are quadratic (such as a=bx2). This is the level at which we expect you to understand equations. One last word, the lab for this module is designed to strengthen the fundamentals you learn in the reading. By experimenting with climate in the lab, you should come away with a really solid understanding of the climate system.
Goals and Learning Outcomes
Goals
On completing this module, students are expected to be able to:
- describe how energy is absorbed, stored, and moved around in Earth's climate system;
- distinguish how the amount of energy stored determines the temperature;
- interpret the importance of feedback mechanisms that make our climate system sensitive to forcings, but also provide a stabilizing influence;
- infer how temperature responds to changes in solar input, albedo, and greenhouse gas concentrations;
- evaluate how simple (i.e., STELLA) models can be used to make projections of climate variables.
Learning Outcomes
After completing this module, students should be able to answer the following questions:
- What are heat and thermal energy?
- What are the different types of electromagnetic radiation?
- What is blackbody radiation and what is the significance of the Stefan-Boltzmann law?
- What is emissivity and what is its significance?
- What is albedo and what are albedo values for different materials?
- What is the solar constant and how is it measured?
- What is insolation and what are its geographic and annual distributions?
- What does sunspot history look like and how is it related to solar intensity?
- What are the relative heat capacities of different materials?
- What is the greenhouse effect and what are the different greenhouse gasses?
- What are the basic energy flows in the atmosphere?
- What is positive and negative feedback and what are examples of each?
- What are the energy budgets of different latitudes?
- How is heat transferred in the atmosphere?
- How is heat transferred in the oceans?
- What is the Global Conveyor Belt and what is its significance?
Assignments Roadmap
Below is an overview of your assignments for this module. The list is intended to prepare you for the module and help you to plan your time.
| Action | Assignment | Location |
|---|---|---|
| To Do |
|
|
NOTICE:
There is some math in this section! It is mostly algebra. You should know how to read and understand these equations, but you do not need to memorize equations.
Global Climate
We begin with a quick glimpse of the global climate — and then we’ll try to understand why it looks this way. But first, what does climate mean? In the simplest sense, it is the average weather of a region — the average temperature, rainfall, air pressure, humidity, cloud cover, wind direction, and wind speed. This means that climate is not the same as weather; weather implies a very short-term description of the atmospheric conditions, and it tends to change in a complex manner over short time scales, making it notoriously difficult to predict. In contrast, the climate is less variable — it smoothens out the variability of the short-term weather. This course is about climate, how it is changing, and what that means for our future; as we move through this class, you should remind yourself periodically that we are not talking about the weather — our time frame is much longer.
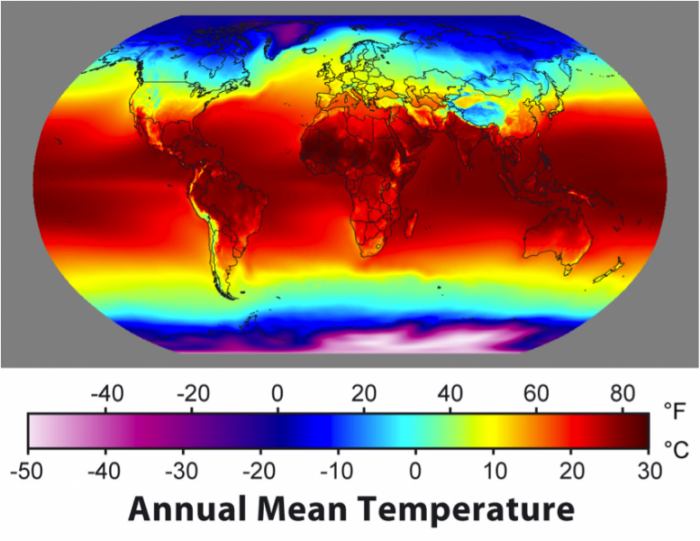
So, let’s have a look at the climate as expressed by temperature:
As you can see, the equatorial regions are the warmest, and the poles are the coldest, with Antarctica being noticeably colder than the Arctic. The temperature varies more within the continents than the oceans, and there is a pronounced northward extension of warm water in the North Atlantic.
The global climate system is like a big machine receiving, moving, storing, transferring, and releasing heat or thermal energy. The machine consists of the oceans, the atmosphere, the land surface, and the biota on land and in the oceans; in short, it consists of everything at the Earth’s surface. The average state of this system — the global climate — is represented most simply by the pattern of temperatures and precipitation at the surface.
In order to really understand this complex machine, we will have to understand something about its parts, but we also need to begin with some fundamental ideas about energy, heat, and temperature, including the source of the energy for the climate system — the sun.
Useful Terms and Definitions Related to the Energy of the Climate System
Energy
In the broadest terms, energy is a quantity that has the ability to produce change in a physical system; it includes all kinds of kinetic energy (energy of motion) and potential energy (energy based on the body's position) and is measured in joules. One joule represents the amount of energy needed to exert a force of one Newton over a meter; so 1 Joule = 1Nm.
Power
Energy expended over a period of time is a measure of power, and in the context of climate, power is expressed in terms of Watts (1 Watt = 1 joule per second). This is also called a heat flux — the rate of energy flow.
Heat
This is simply the thermal energy of a body, measured in joules. Think of this as the average kinetic energy (vibrations) of the atoms of a material.
Heat Flux Density
This is a measure of how concentrated the energy flow is and is given in units of Watts per square meter.
Temperature
This is obviously closely related to heat, but it is the average kinetic energy within somebody. Materials can be the same temperature, but they may have different amounts of thermal energy — for instance, a volume of water has much more thermal energy than a similar volume of air at the same temperature. Remember that there are 3 temperature scales: Fahrenheit, Celsius, and Kelvin. We’ll use Celsius and Kelvin, which have the same scale, just offset so that 0°C = 273°K.
Simple Climate Model
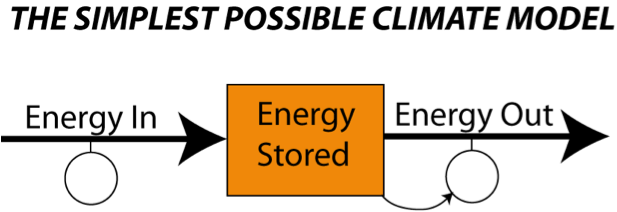
We begin with a very simple analog model for our planet’s climate (figure below) in which solar energy enters the system, is absorbed (some will have been reflected), stored (some will have been transformed or put to work), and then released back into outer space. The amount of energy stored determines the temperature of the planet. The balance between the incoming energy and the outgoing energy determines whether the planet becomes cooler, warmer, or stays the same. Notice the little arrow connecting the box to the Energy Out flow — this means that the amount of energy released by the planet depends on how hot it is; when it is hotter, it releases, or emits, more energy and when it is cooler, it emits less energy. What this does is to drive this system to a state where the energy out matches the energy in — then, the temperature (energy stored) is constant. This energy balance, sometimes called radiative equilibrium, is at the heart of all climate models.
Global Climate System
Now, let’s consider the connection between this idea of an energy flow system to the actual Earth. As shown in the figure below, this system includes the atmosphere, the oceans, volcanoes, plants, ice, mountains, and even people — it is intimately connected to the whole planet. We will get to some of these other components of the climate system later, but to begin with, we will focus on just the energy flows — the yellow and red arrows shown below.
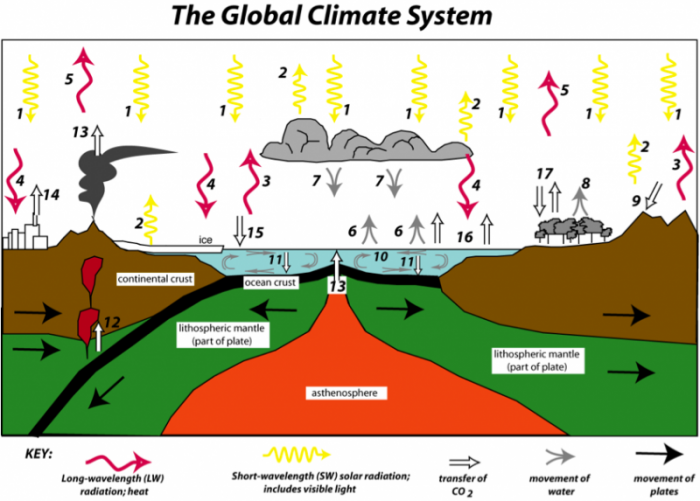
Numbers in the figure refer to the following key:
- Incoming short-wavelength solar radiation
- Reflected short-wavelength solar radiation
- Emission of long-wavelength radiation (heat) from surface
- Absorption of heat by greenhouse gases and emission of heat from the atmosphere back to the surface (the greenhouse effect)
- Emission of surface heat not absorbed by the atmosphere
- Evaporation cools the surface, adds water to the atmosphere
- Condensation of water vapor releases heat to the atmosphere, precipitation returns water to the surface
- Evapotranspiration by plants cools the surface
- Chemical weathering of rocks consumes atmospheric CO2
- Oceans store and transfer thermal energy
- Sedimentation of organic material and limestone (CaCO3) transfers carbon to sediment on the ocean floor
- Melting and metamorphism of sediments sends carbon back to surface
- Emission of CO2 from volcanoes
- Emission of CO2 from burning fossil fuels
- Cold oceans absorb atmospheric CO2
- Warm oceans release CO2 to the atmosphere
- Photosynthesis and respiration of plants and soil exchange CO2 between the atmosphere and biosphere
The figure above includes some new words and concepts, including short-wavelength and long-wavelength radiation, that will make sense if we devote a bit of time to a review of some topics related to energy.
Electromagnetic Spectrum
Brief Review of Electromagnetic Radiation
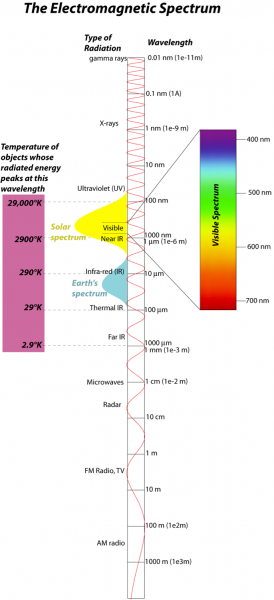
The energy we are concerned with here comes in the form of electromagnetic radiation, so it will help us to review some aspects of this form of energy. Electromagnetic (EM) radiation comes in a spectrum of waves, each consisting of an electrical and a magnetic oscillation of particles called photons; this spectrum is shown in the figure below:
Blackbody Radiation
In the realm of physics, a blackbody is an idealized material that absorbs perfectly all EM radiation that it receives (nothing is reflected), and it also releases or emits EM radiation according to its temperature. Hotter objects emit more EM energy, and the energy is concentrated at shorter wavelengths. The relationship between temperature and the wavelength of the peak of the energy emitted is given by Wien’s Law, which states that the wavelength, lambda, is:
λ= 0.0029/T (λ is in m, T in kelvins)
But the energy emitted covers a fairly broad range, as described by Planck’s Law, as shown below:
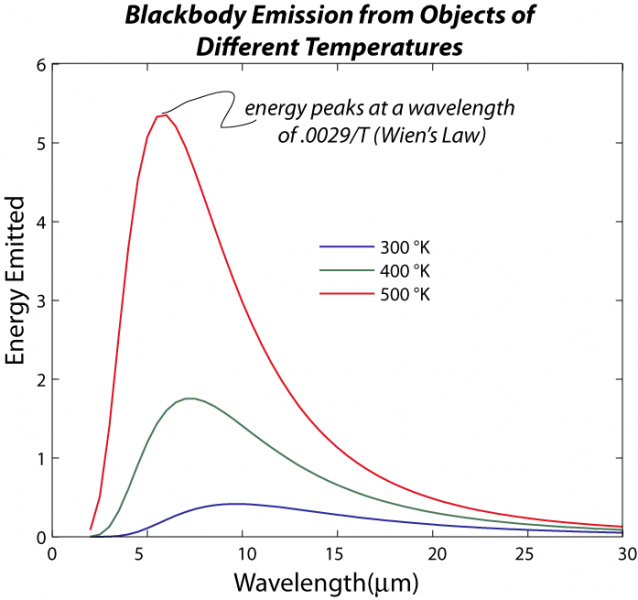
The total amount of energy radiated from an object is also a function of its temperature, in a relationship known as the Stefan-Boltzmann law, which looks like this:
F=σ T 4
where σ is the Stefan-Boltzmann constant, which is 5.67e-8 Wm-2K-4 (this is another way of writing 5.67 x 10⁻⁸; so 100 is 1e2, 1000 is 1e3, one million is 1e6, etc.), T is temperature of the object in °K, and so F has units of W/m2. If you multiply this by the surface area of an object, you get the total rate of energy given off by an object (remember that Watts are a measure of energy, Joules, per second). As you can see, the amount of energy emitted is very sensitive to the temperature, and that can be seen in the figure above if you think about the area beneath the curves of different color. This sensitivity to temperature is very important in establishing the radiative equilibrium or balance of something like our planet — if you add more energy, that warms the planet, and then it emits more energy, which tends to oppose the warming effect of more energy added. Conversely, if you decrease the energy added, the planet cools and emits far less energy, which tends to minimize the cooling. This is a very important example of a negative feedback mechanism, one that works in opposition to some imposed change. The thermostat in your house is another good example of negative feedback — it works to stabilize the temperature in your house, bringing it into radiative equilibrium.
The version of the Stefan-Boltzmann law described above applies for an ideal blackbody object, but it can easily be adapted to describe all other objects by including something called the emissivity, as follows:
F=εσ T 4
Here, epsilon is the emissivity, which is a unitless value that is a measure of how good an object is at emitting (giving off) energy via electromagnetic radiation. A blackbody has epsilon=1, but most objects have lower emissivities. A very shiny object has an emissivity close to 0, and human skin is between 0.6 to 0.8.