Introduction to EARTH 103
The course author's goal was to create an interactive and illustrative online "textbook" to show the impacts that climate change has on the earth now and in the future. Based on that, the text-first format worked well.
Students begin by reading text accompanied by lots of pictures, which were added using the H5P slide sorter that permits students to flip through several pictures embedded within sections of text. As students progress through the course, they encounter embedded videos, Knowledge Check questions, and Activate Your Learning exercises. Together, these elements keep students engaged with the content and help them to build knowledge as they go. Knowledge Checks, interactive questions developed with H5P, allow students to check their understanding of the topics covered in each section. The Activate Your Learning exercises are more involved, requiring students to take some kind of action beyond answering simple questions. These actions include visiting a website to search for a topic, gathering information, reading an article and writing a short essay, or running a simulation. Students work their way through the content by reading, looking at pictures, and completing any Knowledge Checks and Activate Your Learning activities. They then take a lesson quiz and either complete the lab or work on part of their capstone project.
Module 3: Earth's Climate System
Video: Module 3 Introduction (1:14)
Hi, students. Welcome to module 3 on climate models. I grew up in London back in the 1960s, and weather forecasts were always wrong. They would predict a storm--it would be perfectly sunny. They would predict sunny weather, and there would be a storm. They were always wrong. Now we're at a time when weather prediction is really good, and that is because the computer side of the models is very strong and very advanced, and we're getting much better at predicting climate in the future as well.
So, in this module, you'll learn about how CO2 levels and forecasted levels of CO2 drives climate models. The amount of CO2 in the atmosphere will definitely be related to the temperature in the future, as well as the global rainfall in the future, storm tracks, and storm intensity in the future, fire forecasts in the future, and sea level rise. And what we're going to learn about in this module is how different levels of CO2 that are controlled by human activity in the future will definitely be used to predict temperature, rainfall, hurricane intensity, as well as sea level rise. I think you're going to learn a lot about this module, how it's important for your future, and I hope you enjoy it.
Introduction
This course is all about the Earth’s climate. Thus, it is essential that you have a solid understanding of how the climate system works. This module is all about the climate system. It is by far the most technical module in the course, and our philosophy is to lay out the science in a comprehensive way, equations and all, so that you can see that Earth's climate is in part fairly simple, governed by physical relationships that describe how heat from the Sun is exchanged on the surface of the Earth and in its atmosphere. Then, there are some very complex aspects of the Earth's climate that we will not devote much time to.
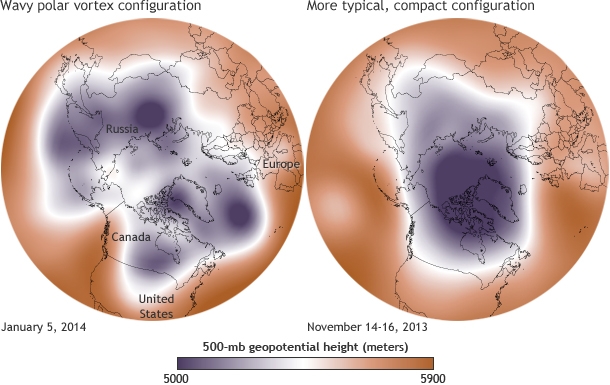
Here is an example of why this module is important. The Polar Vortex has become a household name in the US in recent years. In Texas in the winter of 2021, the cold air from the vortex caused unusually cold temperatures and this crippled the power system that was not built to withstand such temperatures. The power cuts caused chaos, up to 5 million people were without power often for many days, 12 million people lost water service due to freezing pipes, and 151 people died as a result of hypothermia and carbon monoxide poisoning.
Video: Deep freeze in Texas: Millions without power, 21 dead in historic snowstorms (2:54)
Deep freeze in Texas.
Homes and roads blanked in deep snow and temperatures colder than Alaska… Historic and deadly winter storms have sent the southern US state of Texas into a deep freeze, with temperatures plummeting to as low as -18C in some places. In a state more used to heat and sunshine and ill-equipped for Arctic conditions.
Burke Nixon - Houston resident: We have no water. We woke up this morning, our pipes are all frozen, and we have no water in the house. Our neighbor just got us some propane to try to thaw our pipes because they are frozen. We’re not used to this in Texas.
For many, the conditions have been made tougher by being left without power. With the storm knocking out about a third of the state’s energy production capacity. As of late Tuesday, more than 4 million cross the state were still without electricity.
Birgit Kamps - Houston resident: We were getting ready to cook dinner and all of a sudden, lights went off, power went off, everything went off. And I was like, “Wow, now what do I do?” And, I grabbed a bunch of blankets. So we cuddled up with our three dogs, one cat, my daughter and, you know, made it through the night.
Scenes from, Louisville, Kentucky
Scenes from, Telluride, Colorado
Winter storms have hit vast swathes of central and southern US since the weekend.
Scenes from, Ciudad Juárez, Mexico
And even seen rare snowfall and caused power outages in northern Mexico.
Scenes from, Chicago, Illinois
At least 21 people have been killed across four US states, including in falls and traffic accidents.
Scenes from, Brunswick County, North Carolina
The extreme conditions have also triggered at least four tornadoes, including one in coastal North Carolina that killed at least three people. The freezing weather is expected to continue to grip much of the United States until the weekend.
Those of us on the East Coast and Midwest of the US and our neighbors in Canada, 187 million people in all, lived through an extremely cold week at the beginning of 2014. Air temperatures, without the windchill factored in, reached -35oC in eastern Montana, South Dakota, and Minnesota. This cold was a result of the southward expansion of the polar vortex, a whirlwind of cold dense air that is normally restricted to the area around the poles. Understanding the polar vortex, and how it became unstable and swept across the Midwest and eastern parts of Canada and US, is key to interpreting the significance of the extreme cold in early 2014. Without this understanding, you might think that the expansion of cold air is a sign of cooling climate. However, it is likely that the opposite is the case; the recent cold snap is actually a result of warming. This is how it works. As you will learn in this module, the northern high latitudes are warming more rapidly than the rest of the globe as a result of melting sea ice. You will also learn that such warming leads to diminished wind velocities, including the polar vortex. As the vortex weakens, it becomes less stable and begins to wobble and stray from the region around the North Pole. It turns out that the recent cold snap was just one of these wobble events, and the projections are for polar vortices to become more common over North America in the future, just as other extreme events like extratropical hurricanes such as Sandy, heat waves and droughts become more frequent.
Now, right off the bat, we need to make it clear that the "simple" relationships are often portrayed in the module in terms of equations. You do not need to be a Math major to understand these equations, nor do we want you to memorize them. The point of showing the equations is not to cause great anxiety, but to provide an understanding of the relationship between two variables. For example, you should be looking to distinguish relationships that are linear (such as a=b*x [where * is multiplied by]) from those that are quadratic (such as a=bx2). This is the level at which we expect you to understand equations. One last word, the lab for this module is designed to strengthen the fundamentals you learn in the reading. By experimenting with climate in the lab, you should come away with a really solid understanding of the climate system.
Goals and Learning Outcomes
Goals
On completing this module, students are expected to be able to:
- describe how energy is absorbed, stored, and moved around in Earth's climate system;
- distinguish how the amount of energy stored determines the temperature;
- interpret the importance of feedback mechanisms that make our climate system sensitive to forcings, but also provide a stabilizing influence;
- infer how temperature responds to changes in solar input, albedo, and greenhouse gas concentrations;
- evaluate how simple (i.e., STELLA) models can be used to make projections of climate variables.
Learning Outcomes
After completing this module, students should be able to answer the following questions:
- What are heat and thermal energy?
- What are the different types of electromagnetic radiation?
- What is blackbody radiation and what is the significance of the Stefan-Boltzmann law?
- What is emissivity and what is its significance?
- What is albedo and what are albedo values for different materials?
- What is the solar constant and how is it measured?
- What is insolation and what are its geographic and annual distributions?
- What does sunspot history look like and how is it related to solar intensity?
- What are the relative heat capacities of different materials?
- What is the greenhouse effect and what are the different greenhouse gasses?
- What are the basic energy flows in the atmosphere?
- What is positive and negative feedback and what are examples of each?
- What are the energy budgets of different latitudes?
- How is heat transferred in the atmosphere?
- How is heat transferred in the oceans?
- What is the Global Conveyor Belt and what is its significance?
Assignments Roadmap
Below is an overview of your assignments for this module. The list is intended to prepare you for the module and help you to plan your time.
| Action | Assignment | Location |
|---|---|---|
| To Do |
|
|
NOTICE:
There is some math in this section! It is mostly algebra. You should know how to read and understand these equations, but you do not need to memorize equations.
Global Climate
We begin with a quick glimpse of the global climate — and then we’ll try to understand why it looks this way. But first, what does climate mean? In the simplest sense, it is the average weather of a region — the average temperature, rainfall, air pressure, humidity, cloud cover, wind direction, and wind speed. This means that climate is not the same as weather; weather implies a very short-term description of the atmospheric conditions, and it tends to change in a complex manner over short time scales, making it notoriously difficult to predict. In contrast, the climate is less variable — it smoothens out the variability of the short-term weather. This course is about climate, how it is changing, and what that means for our future; as we move through this class, you should remind yourself periodically that we are not talking about the weather — our time frame is much longer.
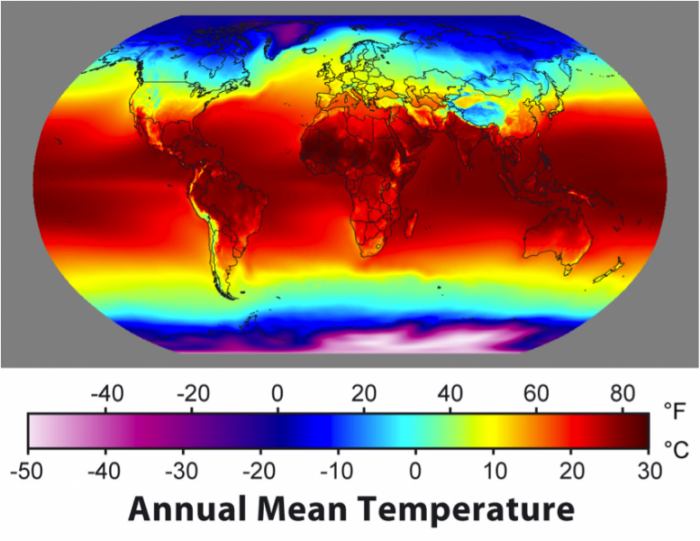
So, let’s have a look at the climate as expressed by temperature:
As you can see, the equatorial regions are the warmest, and the poles are the coldest, with Antarctica being noticeably colder than the Arctic. The temperature varies more within the continents than the oceans, and there is a pronounced northward extension of warm water in the North Atlantic.
The global climate system is like a big machine receiving, moving, storing, transferring, and releasing heat or thermal energy. The machine consists of the oceans, the atmosphere, the land surface, and the biota on land and in the oceans; in short, it consists of everything at the Earth’s surface. The average state of this system — the global climate — is represented most simply by the pattern of temperatures and precipitation at the surface.
In order to really understand this complex machine, we will have to understand something about its parts, but we also need to begin with some fundamental ideas about energy, heat, and temperature, including the source of the energy for the climate system — the sun.
Useful Terms and Definitions Related to the Energy of the Climate System
Energy
In the broadest terms, energy is a quantity that has the ability to produce change in a physical system; it includes all kinds of kinetic energy (energy of motion) and potential energy (energy based on the body's position) and is measured in joules. One joule represents the amount of energy needed to exert a force of one Newton over a meter; so 1 Joule = 1Nm.
Power
Energy expended over a period of time is a measure of power, and in the context of climate, power is expressed in terms of Watts (1 Watt = 1 joule per second). This is also called a heat flux — the rate of energy flow.
Heat
This is simply the thermal energy of a body, measured in joules. Think of this as the average kinetic energy (vibrations) of the atoms of a material.
Heat Flux Density
This is a measure of how concentrated the energy flow is and is given in units of Watts per square meter.
Temperature
This is obviously closely related to heat, but it is the average kinetic energy within somebody. Materials can be the same temperature, but they may have different amounts of thermal energy — for instance, a volume of water has much more thermal energy than a similar volume of air at the same temperature. Remember that there are 3 temperature scales: Fahrenheit, Celsius, and Kelvin. We’ll use Celsius and Kelvin, which have the same scale, just offset so that 0°C = 273°K.
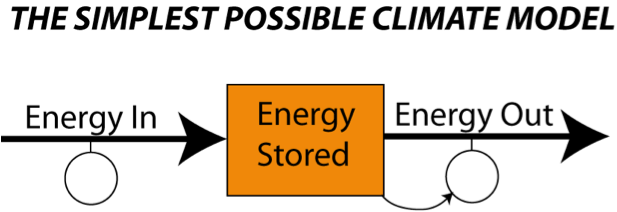
Simple Climate Model
We begin with a very simple analog model for our planet’s climate (figure below) in which solar energy enters the system, is absorbed (some will have been reflected), stored (some will have been transformed or put to work), and then released back into outer space. The amount of energy stored determines the temperature of the planet. The balance between the incoming energy and the outgoing energy determines whether the planet becomes cooler, warmer, or stays the same. Notice the little arrow connecting the box to the Energy Out flow — this means that the amount of energy released by the planet depends on how hot it is; when it is hotter, it releases, or emits, more energy and when it is cooler, it emits less energy. What this does is to drive this system to a state where the energy out matches the energy in — then, the temperature (energy stored) is constant. This energy balance, sometimes called radiative equilibrium, is at the heart of all climate models.
Global Climate System
Now, let’s consider the connection between this idea of an energy flow system to the actual Earth. As shown in the figure below, this system includes the atmosphere, the oceans, volcanoes, plants, ice, mountains, and even people — it is intimately connected to the whole planet. We will get to some of these other components of the climate system later, but to begin with, we will focus on just the energy flows — the yellow and red arrows shown below.
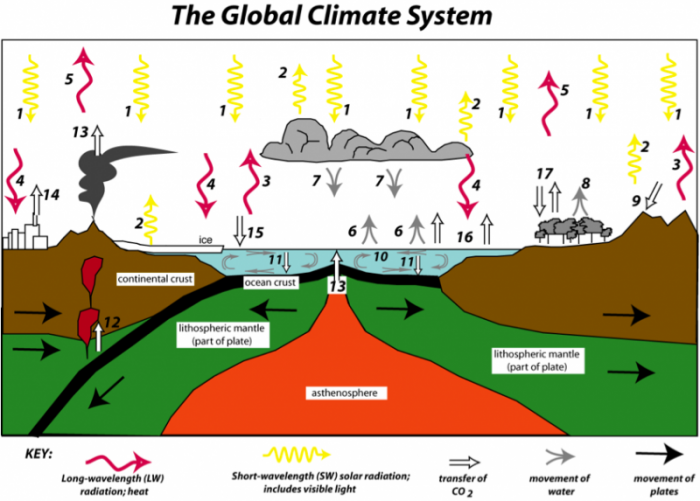
Numbers in the figure refer to the following key:
- Incoming short-wavelength solar radiation
- Reflected short-wavelength solar radiation
- Emission of long-wavelength radiation (heat) from surface
- Absorption of heat by greenhouse gases and emission of heat from the atmosphere back to the surface (the greenhouse effect)
- Emission of surface heat not absorbed by the atmosphere
- Evaporation cools the surface, adds water to the atmosphere
- Condensation of water vapor releases heat to the atmosphere, precipitation returns water to the surface
- Evapotranspiration by plants cools the surface
- Chemical weathering of rocks consumes atmospheric CO2
- Oceans store and transfer thermal energy
- Sedimentation of organic material and limestone (CaCO3) transfers carbon to sediment on the ocean floor
- Melting and metamorphism of sediments sends carbon back to surface
- Emission of CO2 from volcanoes
- Emission of CO2 from burning fossil fuels
- Cold oceans absorb atmospheric CO2
- Warm oceans release CO2 to the atmosphere
- Photosynthesis and respiration of plants and soil exchange CO2 between the atmosphere and biosphere
The figure above includes some new words and concepts, including short-wavelength and long-wavelength radiation, that will make sense if we devote a bit of time to a review of some topics related to energy.
Electromagnetic Spectrum
Brief Review of Electromagnetic Radiation
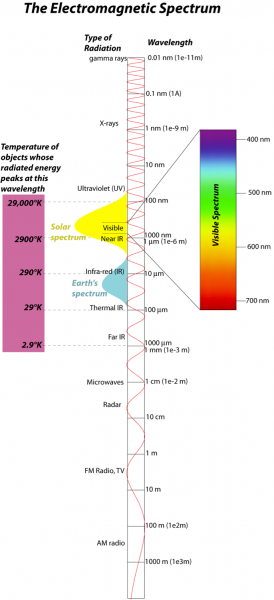
The energy we are concerned with here comes in the form of electromagnetic radiation, so it will help us to review some aspects of this form of energy. Electromagnetic (EM) radiation comes in a spectrum of waves, each consisting of an electrical and a magnetic oscillation of particles called photons; this spectrum is shown in the figure below:
Blackbody Radiation
In the realm of physics, a blackbody is an idealized material that absorbs perfectly all EM radiation that it receives (nothing is reflected), and it also releases or emits EM radiation according to its temperature. Hotter objects emit more EM energy, and the energy is concentrated at shorter wavelengths. The relationship between temperature and the wavelength of the peak of the energy emitted is given by Wien’s Law, which states that the wavelength, lambda, is:
λ= 0.0029/T (λ is in m, T in kelvins)
But the energy emitted covers a fairly broad range, as described by Planck’s Law, as shown below:
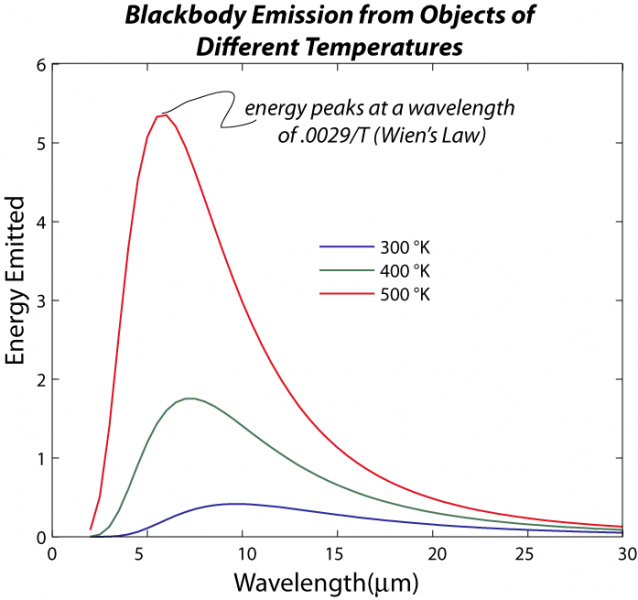
The total amount of energy radiated from an object is also a function of its temperature, in a relationship known as the Stefan-Boltzmann law, which looks like this:
F=σ T 4
where σ is the Stefan-Boltzmann constant, which is 5.67e-8 Wm-2K-4 (this is another way of writing 5.67 x 10⁻⁸; so 100 is 1e2, 1000 is 1e3, one million is 1e6, etc.), T is temperature of the object in °K, and so F has units of W/m2. If you multiply this by the surface area of an object, you get the total rate of energy given off by an object (remember that Watts are a measure of energy, Joules, per second). As you can see, the amount of energy emitted is very sensitive to the temperature, and that can be seen in the figure above if you think about the area beneath the curves of different color. This sensitivity to temperature is very important in establishing the radiative equilibrium or balance of something like our planet — if you add more energy, that warms the planet, and then it emits more energy, which tends to oppose the warming effect of more energy added. Conversely, if you decrease the energy added, the planet cools and emits far less energy, which tends to minimize the cooling. This is a very important example of a negative feedback mechanism, one that works in opposition to some imposed change. The thermostat in your house is another good example of negative feedback — it works to stabilize the temperature in your house, bringing it into radiative equilibrium.
The version of the Stefan-Boltzmann law described above applies for an ideal blackbody object, but it can easily be adapted to describe all other objects by including something called the emissivity, as follows:
F=εσ T 4
Here, epsilon is the emissivity, which is a unitless value that is a measure of how good an object is at emitting (giving off) energy via electromagnetic radiation. A blackbody has epsilon=1, but most objects have lower emissivities. A very shiny object has an emissivity close to 0, and human skin is between 0.6 to 0.8.