Meteorology: Tools of the Trade
About this Class
Welcome!
This course is offered as part of the Open Educational Resources initiative of Penn State's John A. Dutton e-Education Institute. You are welcome to use and re-use materials that appear in this site (other than those copyrighted by others) subject to the licensing agreement linked to the bottom of this and every page.
Not registered? Students who register for this Penn State course gain access to assignments and instructor feedback, as well as earn academic credit. Information about registering for this course is available at the Penn State World Campus [1].
Quick Facts about METEO 3
METEO 3 is a General Education course offered by the Department of Meteorology. The course is designed specifically for distance learners seeking general science credit. METEO 3 will introduce to you a wide variety of basic atmospheric concepts so that you can become a better "weather consumer" (better understand and evaluate weather information) and gain a better understanding of "how the weather works."
Why learn about the atmosphere?
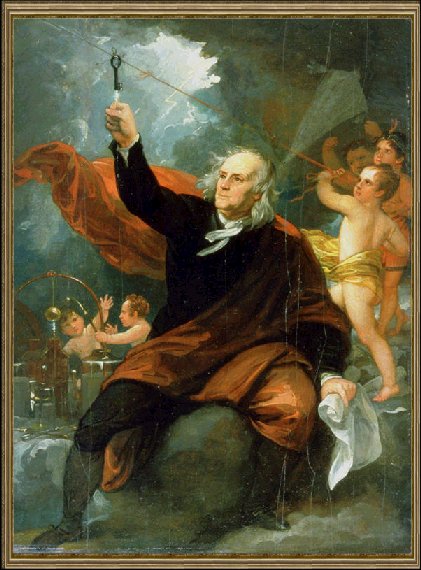
Most everyone is familiar with Benjamin Franklin's foray into cloud electrification using a kite. However, did you know that Franklin was an avid student of the weather? He was the first person to note that storms generally traveled from west to east at predictable speeds. Franklin also noted in 1743 that storms do not always travel in the direction of the prevailing winds - in fact can travel against the prevailing winds in some cases. Here's even a figure from a paper entitled "Waterspouts and Whirlwinds" [2] written by Franklin.
Granted, Benjamin Franklin dabbled in many diverse topics, but why did he find the study of weather so important? Well, I'm of the opinion that it might have been because weather affects all of us. Think about it. No matter where you live or what you do, weather is going to have some impact on your life. It may be that the effect is on the periphery of your life (such as determining what you wear on a certain day), or it may affect you more substantially (such as having a directly impact on your sources of income). Or, in rare cases, it may affect your very life (in an extreme event like a hurricane or a tornado). In whatever way the weather affects you, one thing is for sure… the weather does affect you.
So then, doesn't it make sense to know something about how the atmosphere works and make use of the many types of weather data available to you? I certainly think so. However, I am continually startled that a lot of people know so very little about something that plays such a pivotal role in their lives. Indeed, many people are interested in the weather, but not necessarily interested in learning about the weather. Hopefully, as a result of this course, you will come away with some very practical knowledge about the weather. This knowledge will make you a better weather consumer (that is, someone who can intelligently process weather information presented to you). And, who knows, this knowledge may even save your life! In the words of Ben Franklin, you'll be "weather-wise."
What will you learn in this METEO 3?
METEO 3 seeks to give you a better understanding of atmospheric structure and processes so you can better apply the weather information you encounter. With this knowledge of how the atmosphere works, you'll be able to understand what controls the evolution of storms and appreciate why weather forecasts are sometimes highly uncertain. You will also learn to "read" the sky so you can make your own short-term forecasts and adjust your behavior accordingly. You will also be better able to assess the validity of the commonly expressed concerns about climate change and deteriorating air quality.
Lesson 1: Weather Analysis Tools (composition of the atmosphere, map features (latitude lines, meridians and projections), UTC and common U.S. time zones, temperature scales, common statistical measures (range, mean, and normal), reading isoplethed maps, gradients, station models, meteograms)
Lesson 2: The Global Heat Budget (electromagnetic spectrum, Stefan-Boltzmann Law and Wien's Law, radiation processes, albedo, energy budgets, radiation at the Earth's surface, clouds and radiation, greenhouse effect, conduction and convection)
Lesson 3: The Global and Local Controllers of Temperatures (seasonal changes, climatic temperature variations, vertical temperature variation, air masses and fronts, advection, diurnal temperature changes)
Lesson 4: The Role of Water in the Atmosphere (hydrological cycle, water phase changes, vapor pressure and equilibrium vapor pressure, air "holding" water fallacy, relative humidity, cloud and fog formation, dew point temperature)
Lesson 5: Remote Sensing of the Atmosphere (remote sensing versus in-situ measurements, polar orbiting versus geostationary satellites, visible imagery, IR imagery, water vapor imagery, radar)
Lesson 6: Surface Patterns of Pressure and Wind (atmospheric pressure, "station pressure" vs "sea-level pressure", decoding station model pressure, troughs and ridges, wind (forces, direction at surface and aloft), convergence and divergence)
Lesson 7: Mid-Latitude Weather Systems (pressure decrease versus temperature, pressure heights, convergence / divergence effect on surface pressure, vorticity, short waves, jet streaks, mid-latitude cyclones (development, features, weather, conveyor belts))
Lesson 8: Stability and Thunderstorms (hydrostatic equilibrium, vertical velocity, buoyancy and stability, clouds vs stability, Bergeron-Findeisen process, lightning (terms and safety), thunderstorms (climatology, types, terms and life cycle))
Lesson 9: Severe Weather (flash floods, hail, microbursts, watches and warnings, squall line, derecho, bow echo, tornadoes (climatology, supercells, terms, radar signature, safety, Fujita scale, myths), other vorticies)
Lesson 10: The Human Impact on Weather and Climate (anthropogenic climate change (terms, processes, impacts), carbon-cycle, volcano impacts, global climate models, ozone layer, ozone hole, deforestation and urbanization)
Lesson 11: Patterns of Wind, Water, and Weather in the Tropics (tropics importance to general circulation, Hadley circulation, ITCZ, subtropical high pressure regions, Trade Winds, subtropical jet stream, Asian Summer Monsoon, Ekman Transport, El Niño (and La Niña), teleconnections)
Lesson 12: Hurricanes (tropical cyclone terms, hurricane climatology, tropical-cyclone naming conventions, tropical cyclone formation, easterly waves, structure of a mature hurricane, land-falling hurricane impacts)
How does this course work?
METEO 3 combines a traditional textbook (A World of Weather: Fundamentals of Meteorology, 5th Edition, by Lee M. Grenci and Jon M. Nese, 2010) with digital video, audio, simulation models, virtual field trips to online data resources, and interactive quizzes that provide instantaneous feedback. The course consists of 12 lessons, plus a course orientation week at the beginning of the semester. Lessons consist of an offline reading assignment, along with online interactive exercises, links, animations, movies, and supplementary explanations of basic scientific principles.
About the Author
David Babb, Course Instructor

I came to love weather rather early in life. Growing up in Chattanooga, Tennessee, I used to marvel at the squall-lines that came through during the summer. When I was sixteen, my family spent a year on a sailboat [3] cruising around inland river systems, the East Coast, and Bahamas. We weathered Hurricane Gloria, saw steam devils on the Tennessee River, had waterspouts on Lake Ontario, and experienced many other kinds of weather phenomena. This experience sealed my fate as a meteorologist. I also learned first hand how important understanding and forecasting the weather can be (especially for mariners).
By the time I attended college at the University of Kansas [4], I had decided to make a career out of studying the atmosphere. My real enthusiasm at the time was centered on tornado-chasing [5] which I did as often as possible, and led to summer internships at the National Severe Storms Laboratory [6] in Norman, Oklahoma. After completing my Bachelor's degree, I attended Penn State where I received my Doctorate in Atmospheric Science, studying radar measurements of clouds and precipitation. Over the course of my career, I have held many different positions including researcher, instructor, meteorological consultant, and instructional designer. Currently, I am an Assistant Professor in the Department of Meteorology [7] here at Penn State. I also serve as a Fellow in the John A. Dutton e-Education Institute [8] which promotes the development of high quality online education initiatives like the Certificate of Achievement in Weather Forecasting.
When not at work, which usually involves being online, I try to satisfy my glass addiction. I have been blowing glass for nearly ten year. Off-hand glass blowing uses a blowpipe to make much larger pieces such as vases [9], bowls [10], and goblets [11]. Here are a few photos of me making a vase (photo 1 [12]; photo 2 [13]).
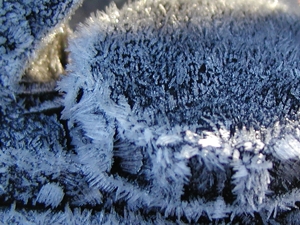
Like many meteorologists, I am also a "weather weenie". I am always pulling over on the highway to take a picture of some cloud or optical phenomenon. I am simply amazed by the complexity and diversity of what I observe going on in the atmosphere (check out the picture of frost on the right). I hope that throughout this course you begin to appreciate some of this complexity and beauty that the atmosphere provides us. Take some time every day to stop and look up at the clouds, become aware of the weather around you, look for patterns in what you observe, and try to figure out what's going on. I'm confident that you'll be rewarded.
Introduction
Overview
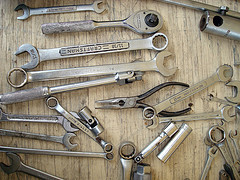
What role do tools play in your daily life? You might be tempted to say something like, "Well, I'm not really a handy person... I don't use tools very often." Well, I'm not just talking about the hammer or screwdriver kind of tools. If you search for a general definition of a tool, you might run across something like the following: "A broader definition of a tool is an entity used to interface between two or more domains that facilitates more effective action of one domain upon the other." (definition from Wikipedia). Umm... what does this mean, exactly? One simple interpretation is this, "A tool makes a particular task easier". Think about it. Everything that you use to make something easier is a tool. When you clean your teeth, you use a tool. When you communicate with someone, you most often use some sort of tool. When you want to collect and analyze information, you use tools. Indeed, you are surrounded by a multitude of tools that you use without even thinking about it. Does this realization change your perspective about "tools"?
Now that we've established the importance of tools, how important is it to know how to use them properly? Think back to the last time you got a new cell phone or some other such device made to make your life easier. It wasn't necessarily so labor-saving in the beginning, was it? In fact, until you became familiar with the new tool, it often took longer than the "old" way of doing things. But once you integrate the new tool into your life, you can't imagine life without it. This is typical of all tools. Not only do you have to know what it is and how it is used, but you must get yourself to the point of being comfortable using it. Only then can you realize the power of the tool itself. Alas, the only way to get comfortable with using a certain tool is to actually use it. This is an important fact that we will return to in a moment.
So, what's all this talk about tools have to do with learning about the weather? Well, Lesson 1 is all about the tools that meteorologists use to fashion understanding of the atmosphere out of raw observations. We'll start off examining such tools as map projections, universal time, temperature scales, and mathematical tools such as unit conversions and statistics. Then we'll move on to tools that deal with the analysis of meteorological data, in both time and space. Remember, these tools exist to make learning about the atmosphere easier (you need to learn them well). And, as with all tools, you not only need to learn about them, but you also need to practice using them. That is the only way to make these tools work for you.
Before you dive into the reading material, take a moment to consider the Learning Objectives on the next page. Understanding the learning objectives is very important because they very clearly define what tools you will be required to know about and use (and they specifically outline what you will be tested on).
Objectives and Assignments
What will we learn in Lesson 1?
Objectives play a key role in learning, in that they provide you, the student, with a road map as you read the material. When reading a long passage of text, it is often difficult to identify which concepts are of critical importance and which are more ancillary in nature. Having the objectives in mind helps you to focus on the important topics. These objectives also give you a preview to the lesson's quiz -- each quiz question will be mapped to a particular objective. They are the answer to the often asked question, "Is this going to be on the test?" We suggest that you print off the objectives, or otherwise make reference to them in your textbook and/or reading notes.
By the end of Lesson 1, you should be able to:
- discuss the composition of the atmosphere;
- identify/discuss map features such as latitude lines, meridians and projections. Orienting one's self on a certain projection is also required;
- convert to and from UTC and common US time zones;
- perform an estimated conversion between various temperature scales;
- place certain features within the categories of synoptic, mesoscale, and micro scale;
- provide statistical measures such as range, and mean, and normal;
- read specific point values off of an isoplethed map;
- determine through which "gate" a given isotherm will pass ( given a choice of paths);
- estimate and compare gradients in temperature (etc.);
- interpret a station model. This includes temperature, wind speed/direction, cloud cover, and obstruction to visibility;
- make observations of surface data displayed in a meteogram format.
What is due for Lesson 1?
Lesson 1 will take us one week to complete. Please refer to the Syllabus in Canvas for specific time frames and due dates.
The chart below provides an overview of the requirements for Lesson 1. For assignment details, refer to the lesson page noted.
| Requirement | Location | Submitted for Grading? |
|---|---|---|
| Lab 1: Collect your data, perform the analysis, and submit your answers in the "Lab Exercise #1" drop box. |
Canvas Modules page "Lab Exercise #1" |
Yes - This laboratory exercise will count towards your class grade. |
| Lesson Quiz #1 |
Canvas Modules page "Lesson 1 Quiz" |
Yes - Taking this Canvas-based quiz will count towards your overall quiz average. |
Questions?
If you have any questions, please let me know in class or via Canvas email.
Reading Assignment
Reading Assignment
The reading assignment for Lesson 1 is the following:
Chapter 1 (pages 1-31)
in A World of Weather: Fundamentals of Meteorology, 5th Edition (PDF file linked in Canvas modules)
Questions to think about...
When you read this chapter, make sure that you keep the learning objectives listed on previous page in mind. In addition, it's important that you keep your eye on the "big picture." To help you do so, consider these following questions (These might make good discussion topics in the "Classroom" discussion):
- Why is it important to have a good understanding of maps and map projections before starting to study the weather? What might be some common mistakes made if you don't have a good grasp of these concepts.
- Why do we need a common time format when looking at meteorological data? How might you easily remember the conversion from UTC to your local time?
- Memorizing the conversion from Fahrenheit to Celsius can be difficult. What would be an easy way to remember the formula?
- Why do you have to be careful when using statistics to describe the climate for a particular location? How might these statistics mislead your understanding of what to expect, weather-wise, for that location?
- Which is better... to have a map plotted with actual numbers, or contoured? Is there a case to be made for both methods of presenting data?
- Sometimes, having a map full of station models can be a little overwhelming. When might you want to look at individual station models, and when might you want to look at more "processed" form of data (like contour maps)?
- What role do meteograms play in understanding the state of the atmosphere? Do you think this type of data is important or does it fall more into the "gee-wiz" category?
When you have completed the textbook reading assignment, check out the "Additional Resources" on the next page.
Questions?
Remember, if you have any questions, please discuss them in class or drop me a note via Canvas.
Additional Resources
In addition to just reading the text, you may find these interactive exercises, media, and external links to be of great help in understanding and practicing certain skills.
Station Model Tool
A good way to learn about how station models are coded is to use this tool. Using the Station Model Tool [17], explore different scenarios (of temperature, dew point, wind, and weather) and test yourself to see if you know what the station model will look like. Another good exercise is to look at an existing station model from a weather map. Here's the current map of NE station models [18]. Decode the observation and enter it into station model tool. If you decoded the observation correctly, the tool's station model should look like the one on the map. If you want to choose a different region go to The National Center for Atmospheric Research (NCAR) Real-Time Weather Data: Surface [19] and click on any region of the map.
Time Conversion Quiz Tool
Converting time between GMT and local time is a difficult skill to learn for many folks to master. If you need more practice, use this handy Time Conversion quiz tool [20]. Select whether you want to practice converting local time to GMT or GMT to local time (or "Either"). Then hit the "Quiz me" button. Fill in the missing time and hit "Submit" to check your answer. Just a word of caution... follow the requested format or the tool gets confused.
Wind Direction on a Polar Stereographic Map
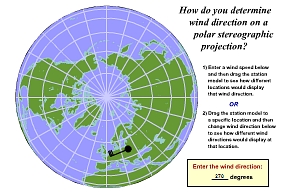
Many students find it difficult to get their sense of direction on a polar stereographic map. The Polar Stereographic Wind Direction Tool [21] will help you practice this skill and your skill at interpreting wind direction off of a station model. Open this tool and explore what the same wind direction looks like at several different locations on a polar stereographic map. Test yourself... Can you predict what the station model with a wind from 270° will look like over central Siberia? Another approach is to look at the surface map from the National Weather Service at Anchorage, AK [22] (it's polar stereographic). Find a station model and see if you can determine the wind direction. Check your answer by moving the station model to the proper location on the map and see if your station model matches the one on the map.
Contouring Tool
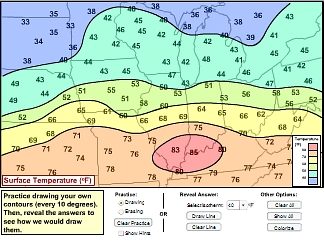
If you feel you need some "hands-on" practice check out this interactive contour tool [23]. With this tool, you can draw your own contour lines and then compare them to how the tool draws them. If it's tough at first, use the "Show hints" button to get you started. For more advanced practice, first go to The Surface Plotting Tool [24] and create a map of observations to contour (For example, choose "Temperature" over the "Northeast Region"). Print off the resulting map and contour it. To check your work, go to The Surface Contour Maker [25] and make a contour plot of the same variable and region. Note: these are computer generated contours and may differ slightly from your hand-drawn ones.
3-D Hawaii
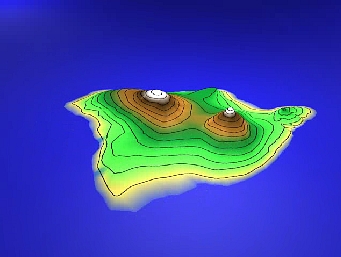
Do you have trouble visualizing contour spacing with the steepness of the gradient? If so, check out this 3-D model of the island of Hawaii [26](complete with contours of elevation). You can grab the model and look at it from many different angles. Notice that when elevation changes rapidly, the contours are spaced close together (and vice-verse).
Mini-Lectures...
If you're looking for a little extra discussion and some examples involving some key topics from the lesson, check out the short videos below. Note: These videos are designed to be viewed after you've thoroughly read the lesson's reading assignment.
Video transcript: The Station Model - Wind [27]
Video transcript: Interpreting Contour Plots [28]
Video transcript: Interpreting Gradients on Contour Plots [29]
Lab Exercise #1
Overview
Welcome to your first laboratory exercise. This particular laboratory exercise is designed to give you some practice with concepts from Lesson 1 while exposing you to learning tools available in METEO 3.
Before you get started, there are a few over-arching things to consider when approaching laboratory exercises.
- Follow directions. We find that most of the time, students lose points on these exercises simply because they don't follow directions. Make sure that you include all of the proper data sources that each lab requires and that you perform all the steps of the analysis that are required of you. You may find it helpful to print off these instructions.
- Don't procrastinate. Each week's exercise should not take you very long to complete, but I recommend that you get started early and not wait until the last minute. Doing so will prevent you from being adversely affected by any technical snafus. Websites you'll need to complete this assignment, like all websites, can go down unexpectedly (that's bad news for you if it happens near the assignment deadline). Another reason not to procrastinate is that the weather doesn't necessarily cooperate on a single day's notice. Suppose a given week's lab exercise requires you to work with a specific type of "weather" (low visibility, for example). If you wait until the last minute to do your assignment, the weather conditions that you are asked to document and analyze may not be present (in which case you will be out-of-luck).
With these simple suggestions in mind, let's get started.
Activity
Collect the Data
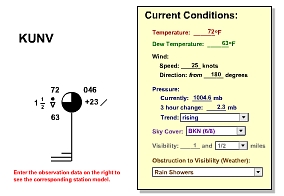
- Check out this station model [30] showing the weather conditions from an unknown time and date at KUNV -- University Park, PA. You'll need this station model to answer some of the questions below.
- Go to "Classroom" Discussion: Lesson 1 in Canvas and read my Lesson 1 comments. Not only do my comments have some important tips for Lesson 1, but it's also the basis for one of your lab questions. Also, click on the link for "Additional Resources" in my post as you'll need some of the tools and "Mini-Lectures" on that page to complete the lab.
Analyze the Data
- (1 point) Based on the station model given for KUNV, state the temperature of the station in both Fahrenheit and Celsius. Note: For questions 1, 2, and 4, you may want to use the interactive "Station Model Tool" on the "Additional Resources" page. The tool allows you to enter your own data to see what the corresponding station model will look like, giving you an opportunity to check your work.
- (1 point) State the sky cover and any obstructions to visibility (if any).
- (1 point) See the following statement:
Interpreting a Station Model: You should be able to interpret station models at the end of this lesson, which for the most part means familiarizing yourself with where temperature, dew point, sky cover, and obstructions to visibility are located on the model (and familiarizing yourself with the basic weather symbols and sky coverage indications). That's all covered on p.26 in the textbook. But, you should also be able to determine wind direction and speed from the station model. The first key to that is remembering that wind direction is always expressed as the direction FROM which the wind is blowing, based on the compass angles shown in figure 1.26 on p. 27.
What does the statement in bold tell you about the convention for expressing wind direction? - (1 point) With your answer to #3 in mind, state the direction and speed of the wind on the KUNV station model. For wind direction, specify the numerical direction (for example, 135 degrees) and describe it using words (for example, "southeast"). For wind speed, proper units are a must.
- (1 point) In my "Mini-Lecture" titled "Interpreting Contour Plots" (the second "Mini Lecture" on the "Additional Resources" page), what is the UTC time and date of the map of surface temperatures I use in the video? Convert the UTC time to local time in St. Louis, Missouri on that date (Central Standard Time). Note: the graphic in the video is a little small, so you may want to view a full-screen version of the video.
Submit Your Lab
Please follow the instructions for lab submission in Canvas.
Summary and Final Tasks
So how's your atmospheric toolbox? Hopefully it is full of some useful items. Don't forget how to use them! We are going to need them in the Lessons to come and it's going to be up to you to use them correctly without being prompted. If I had to pick three of the most important tools, I would say they are: time-conversion, figuring out wind direction, and reading contour maps. I think that you will use these tools often and many students have trouble with them (especially time conversion). If you have a good handle on these tools, you will be rewarded with an easier time of learning the more challenging topics that lie ahead if you take METEO 3.
Reminder - Complete all of the lesson tasks!
You have finished Lesson 1. Double-check the list of requirements on the Lesson 1 Overview page (2 graded assignments) to make sure you have completed all of the activities listed.